M A J O R A R T I C L E
Effect of Immunosuppression on T-Helper 2 and
B-Cell Responses to In
fluenza Vaccination
Adrian Egli,1,4Atul Humar,5Lukas A. Widmer,2Luiz F. Lisboa,4Deanna M. Santer,4Thomas Mueller,3Joerg Stelling,2 Aliyah Baluch,6Daire O’Shea,4Michael Houghton,4and Deepali Kumar5
1
Infection Biology Laboratory, Department of Biomedicine, University of Basel,2Department of Biosystems Science and Engineering, ETH Zurich, and Swiss Institute of Bioinformatics, Basel, and3Division of Nephrology, University Hospital Zurich, Switzerland;4Li Ka Shing Institute of Virology, University of Alberta, Edmonton, and5Transplant Infectious Diseases and Multi-Organ Transplant Program, University Health Network, Toronto, Ontario, Canada; and
6
Division of Infectious Diseases, Moffitt Cancer Center, Tampa, Florida
Background. Influenza vaccine immunogenicity is suboptimal in immunocompromised patients. However, there are limited data on the interplay of T- and B- cell responses to vaccination with simultaneous immunosuppression.
Methods. We collected peripheral blood mononuclear cells from transplant recipients before and 1 month after seasonal influenza vaccination. Before and after vaccination, H1N1-specific T- and B-cell activation were quantified withflow cytometry. We also developed a mathematical model using T- and B-cell markers and mycophenolate mofetil (MMF) dosage.
Results. In the 47 patients analyzed, seroconversion to H1N1 antigen was demonstrated in 34%. H1N1-specific interleukin 4 (IL-4)–producing CD4+T-cell frequencies increased significantly after vaccination in 53% of patients. Prevaccine expression of H1N1-induced HLA-DR and CD86 on B cells was high in patients who seroconverted. Seroconversion against H1N1 was strongly associated with HLA-DR expression on B cells, which was dependent on the increase between prevaccine and postvaccine H1N1-specific IL-4+CD4+T cells (R2= 0.35). High doses of MMF (≥2 g/d) led to lower seroconversion rates, smaller increase in H1N1-specific IL-4+CD4+T cells, and reduced HLA-DR expression on B cells. The mathematical model incorporating a MMF-inhibited positive feedback loop be-tween H1N1-specific IL-4+CD4+T cells and HLA-DR expression on B cells captured seroconversion with high spe-cificity.
Conclusions. Seroconversion is associated with influenza-specific T-helper 2 and B-cell activation and seems to be modulated by MMF.
Keywords. immunosuppression; cellular response; cytokines; computational model; influenza; vaccine; B cells; T cells; cytokine profile.
Infection with influenza viruses in organ transplant recip-ients is associated with greater risk of hospitalization and mortality [1,2]. The primary means to prevent influenza in this population is annual influenza vaccination [3]. In immunogenicity studies, transplant recipients show sub-optimal seroconversion rates against influenza [4,5]. Fac-tors associated with reduced humoral immunity include
the use of mycophenolate mofetil (MMF), vaccination within thefirst year after transplantation, and receipt of a lung transplant [4,6–9]. In particular, MMF dosage >2 g/d is a strong predictor of vaccine failure [9–11].
Protective immunity against influenza involves a multitude of interactions between the innate and adap-tive immune system [12,13]. Neutralizing antibody against influenza is well known to protect against infec-tion [14]. Seroprotection and seroconversion are fre-quently used as surrogates of vaccine protection in the general population. Although neutralizing antibodies play an important role in prevention of infection, influ-enza-specific T-cell responses add to the protection and may be cross-reactive to provide broad protection against drifted strains of influenza [15]. Whereas T-helper (Th) 1 and cytotoxic T-cell response clear viral infected cells, Th2 responses stimulate antibody Received 2 November 2014; accepted 23 December 2014; electronically
pub-lished 14 January 2015.
Correspondence: Adrian Egli, MD, PhD, Infection Biology Laboratory, Department of Biomedicine, University of Basel, Petersgraben 4, 4031 Basel, Switzerland ([email protected]).
The Journal of Infectious Diseases®
2015;212:137–46
© The Author 2015. Published by Oxford University Press on behalf of the Infectious Diseases Society of America. All rights reserved. For Permissions, please e-mail: [email protected].
production. The type of immunity stimulated by influenza vac-cination likely defines the degree of protection.
Previous studies of cellular immunity against influenza after transplantation have focused on production of interferon (IFN) γ (a Th1 cytokine) from T cells and have not shown an associ-ation with humoral immunity [16,17]. Limited data exist for the transplant population and the interaction of influenza-specific Th2 cells and B cells.
We hypothesized that influenza vaccine immunogenicity after transplantation is likely to be related to the interplay of Th2 and B cells and that immunosuppression is an important regulator. To test these hypotheses, we analyzed humoral and cellular immunity in a cohort of solid organ transplant recipi-ents and healthy controls that were given influenza vaccine. Pe-ripheral blood mononuclear cells (PBMCs) were stimulated with influenza antigen and underwent flow cytometric analysis for intracellular IFN-γ as a marker for Th1 response, interleukin 4 (IL-4) as a marker of Th2 response, and HLA-DR and CD86 expression as activation markers for B-cell response. We also developed a computational model to investigate the influence of MMF on the interplay of T and B cells.
MATERIALS AND METHODS Patient Population
From the original trial comparing intradermal versus intramus-cular influenza vaccine, adult solid organ transplant recipients were randomly selected to participate in a cellular immunity substudy (n = 47) [6]. No significant differences in humoral im-munity between intradermal and intramuscular vaccine were seen [6]. All patients received nonadjuvanted 2010–2011 influ-enza vaccine containing the following influenza strains: A/ California/7/2009 (H1N1), A/Perth/16/2009 (H3N2), and B/Brisbane/60/2008 in either a high-dose (18 µg per antigen) intradermal (Intanza; Sanofi-Pasteur) or a standard-dose (15 µg per antigen) intramuscular preparation (Vaxigrip; Sano fi-Pasteur). Patients had whole blood collected before and 4 weeks after vaccination.
Eleven healthy volunteers were separately recruited and re-ceived standard intramuscular vaccination with the 2011– 2012 vaccine (Vaxigrip, Sanofi-Pasteur). The vaccine viruses in the 2011–2012 vaccine were identical to those in the 2010– 2011 vaccine. The study protocols were approved through the institutional research ethics board, and written informed con-sent was obtained from all participants.
Humoral Response to Vaccine
Serum samples underwent hemagglutination inhibition (HAI) assay for the H1N1 antigen contained in the vaccine, as de-scribed elsewhere [18]. Definitions of vaccine immunogenicity were based on recommendations for annual licensure of influ-enza vaccine (European Medicines Agency document CHMP/
VWP/164653/2005). Seroconversion was defined as a ≥4-fold rise in titer from the prevaccine titer and a postvaccine titer ≥1:40. However, if prevaccine antibodies are present, the defini-tion ofseroconversion may also represent a booster effect or a cross-reactive immune response.Seroprotection was defined as a titer of≥1:40.
PBMC Isolation and Stimulation
The PBMCs were isolated from whole blood using a Ficoll-based method, cryopreserved until use, and then stimulated with formalin-inactivated, partially purified A/California/7/ 2009 (H1N1) (NIBSC, NYMC-X179A), the same strain as in the vaccine. Afinal concentration of 0.3 µg/mL was used to stimulate cells for 16 hours at 5% carbon dioxide. Cells were stimulated in Roswell Park Memorial Institute containing 5% fetal calf serum and 1% Glutamax (R5; all Sigma) at a concen-tration of 2 × 10⁵cells per well.
Flow Cytometry
Experiments were performed on a FACSCanto IIflow cytome-ter (BD) and analyzed with FlowJo software (version 10.0.5; TreeStar).Supplementary Figure 1shows the overall gating strategy (Supplementary Figure 1). Medium alone served as negative control and was subtracted from samples stimulated with influenza antigen. LIVE/DEAD staining was performed (near-IR; Invitrogen). Markers for identifying T-cell subsets were CD3 (Pacific Blue), CD4 (phycoerythrin–cyanine 7), and CD8 (characterized as the CD4-negative gate). Intracellular cytokine staining was performed according to protocols pub-lished elsewhere [19]. IFN-γ (Alexa Fluor 488) and IL-4 (allo-phycocyanin) were used as key representatives for Th1 and Th2 cytokine production, respectively. All reagents, including perm andfixation buffers and antibodies, were from eBioscience. Iso-type controls have previously been used to establish the assays. Markers for B-cell subsets were CD20 (Alexa Fluor 488) and CD27 (PE), with CD20+CD27− as naive B cells and CD20+ CD27+as memory B cells. HLA-DR (Pacific Blue) and CD86 (allophycocyanin) served as activation markers (Biolegend or eBioscience).
Cytokine Profile
Cell-free supernatants from H1N1-stimulated PBMCs were col-lected after 24 hours and used for cytokine analysis. A 17-plex Luminex-based cytokine profiling kit was used (Eve Technolo-gies), including fractalkine, IFN-α, IFN-γ, growth regulated oncogene, monocyte chemoattractant protein 3 (MCP-3), leukin 13, soluble CD40-L, interleukin 9, interleukin 1β, inter-leukin 2, IL-4, interinter-leukin 5, interinter-leukin 6, interferon gamma induced protein 10, MCP-1, macrophage inflammatory protein 1α (MIP-1α), and tumor necrosis factor α.
Cytokine Profile Analysis
GeneSpring GX version 12 (Agilent Technologies) was used for cluster and principal component analysis of the cytokines mea-sured in H1N1-stimulated PBMCs. Nonstimulated samples were subtracted from stimulated PBMCs. Percentile shift was used as normalization algorithm, and baseline transformation was performed to the median of all samples. Hierarchical clus-tering was done using Euclidean as the similarity measure and centroid linkage as the linkage rule. Principal component anal-ysis was used to detect major trends in the experimental condi-tions, and cluster analysis of variance was used to compare antibody response clusters.
Mathematical Model
We constructed a phenomenological ordinary differential equa-tion (ODE) model, as described in detail in theSupplementary
Information and Supplementary Table 1. Numerical
simula-tions were performed in MATLAB (R2014a; MathWorks), with the CVODE ODE integrator from the sundialsTB toolbox [20]. Parameter estimation was performed using the MEIGO toolbox [21], and confidence intervals were determined using the HYPERSPACE toolbox [22].
Statistical Analysis
Statistical analyses were performed using SPSS Statistics (version 20.0; IBMIL) and GraphPad Prism (version 4.0; GraphPad Software). Data are shown as medians and inter-quartile ranges. Categorical variables were analyzed using a χ2test, and continuous nonnormal distributed data (Shapiro– Wilk test) were analyzed using a Mann–Whitney U test or, if paired, a Wilcoxon matched-pairs rank test. All tests were 2 tailed.
RESULTS
Impact of MMF on Humoral Immunity
We enrolled 51 transplant recipients for cellular immune assays. Of these, 2 were lost to follow-up and 2 did not have sufficient T cells in the postvaccine sample for analysis. Of the remaining 47 patients, the median age was 53.4 years (range, 21–77 years), and 24 of 47 (51%) were kidney transplant recipients (Table1). Patients were under a combination of immunosuppressive drugs. All transplant recipients had received prior-year influen-za vaccine and had not previously had microbiologically proven influenza infection. By HAI assay, the prevaccine seroprotection rate to influenza A/H1N1 was 46.8% (22 of 47). The postvaccine seroprotection rate was 68.1% (32 of 47) for influenza A/H1N1, but only 16 of 47 (34%) demonstrated seroconversion. Trans-plant recipients receiving MMF at≥2 g/d showed significantly lower geometric mean antibody titers than those receiving <2 g/d (geometric mean titer, 43.1 vs 128.4;P = .03). The medi-an trough level of tacrolimus medi-and cyclosporine in patients
receiving MMF at ≥2 g/d MMF not significantly different from that in with those receiving <2 g/d (7.85 vs 6.5 µg/mL and 68 vs 187 µg/mL, respectively). In lung transplant recipients compared with non–lung transplant recipients seroconversion rates did not differ significantly for H1N1 (P = .35).
H1N1-Specific T-Cell Responses After Vaccination In transplant recipients, H1N1-specific IL-4+
CD4+ T cells showed a significant increase from before to after vaccination Table 1. Characteristics of Transplant Recipients and Healthy Volunteers Characteristic Transplant Recipients (n = 47) Healthy Volunteers (n = 11) P Value Age, median (IQR), y 53.4 (16) 33 (10) <.05 Sex, male/female, No. (%) 33/14 (70.2/29.8) 7/4 (63.6/36.4) NS Time between transplantation and immunization, median (range), y 4.34 (0.26–22.34) . . . .
Type of vaccine, No. (%) Standard intramuscular 26 (55) 11 (100) . . . High-dose intradermal 21 (44.7) . . . . Seroconversion, No. (%) Influenza A/H1N1 16 (34.0) 11 (100) <.05 Influenza A/H3N2 12 (25.5) 11 (100) <.05 Influenza B 7 (14.9) 7 (63.6) <.05 Prevaccine titer (GMT) Influenza A/H1N1 26 66 .06 Influenza A/H3N2 19 55 .01 Influenza B 16 12 NS Postvaccine titer (GMT) Influenza A/H1N1 82 345 .02 Influenza A/H3N2 43 206 .001 Influenza B 29 34 NS
Type of graft, No. (%)
Kidney 24 (51.1) . . . . Lung 15 (31.9) . . . . Heart 4 (8.5) . . . . Liver 4 (8.5) . . . . Immunosuppression, No. (%)a Prednisone 35 (74.5) . . . . Tacrolimus 36 (76.6) . . . . Cyclosporin 9 (19.1) . . . . MMF 34 (72.3) . . . . Sirolimus 5 (10.6) . . . .
Abbreviations: GMT, geometric mean titer; IQR, interquartile range; MMF, mycophenolate mofetil; NS, not significant.
a
The median doses for prednisone and MMF were 5 mg/d and 2 g/d, and the median trough levels for tacrolimus, cyclosporin, and sirolimus were 7.4, 78, and 8.2 µg/mL.
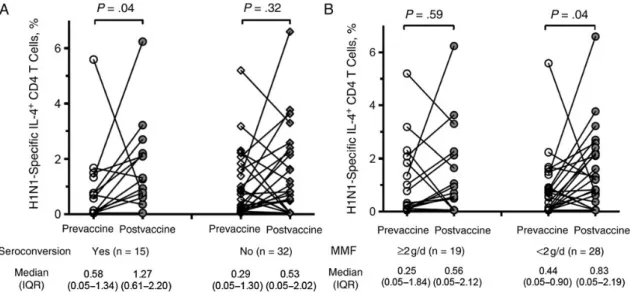
(median, 0.32%–0.78%; P = .04) (Supplementary Figure 2A). Of the 47 patients, 25 (53.2%) had an increase in H1N1-specific IL-4+CD4+T cells after vaccination. This increase was driven primarily by seroconverting patients. We observed a significant induction of postvaccine IL-4+CD4+T cells only in persons with seroconversion (Figure1A). Patients who were receiving MMF at≥2 g/d had a lower, nonsignificant increase in their IL-4+CD4+T cells, whereas those receiving lower MMF doses had a significant increase (P = .04; Figure1B). The frequency of H1N1-specific IFN-γ+
CD4+and IFN-γ+CD8+T cells did not show a significant increase after vaccination (
Supplementa-ry Figure 2B). IFN-γ+T-cell frequencies were not significantly
associated with seroconversion and did not show any associa-tion with MMF dose (data not shown). However, the prevac-cine-postvaccine ratio of IL-4+CD4+to IFN-γ+CD4+T cells was significantly higher in patients with seroconversion, sug-gesting differences in expansion dynamics of T-cell subsets (median, 1.7-fold to 1.0-fold;P = .047). Lung transplant recipi-ents showed a median prevaccine IL-4+CD4+T-cell frequency of 0.33% versus 0.35% in non–lung transplant recipients (P = .26). Similarly, the postvaccine IL-4+CD4+T-cell frequency was 0.62% versus 0.86% (P = .58) in lung transplant recipients versus recipients of other transplant types.
H1N1 Stimulated B-Cell Activation After Vaccination
We measured B-cell activation markers after stimulation with H1N1 antigen. In transplant recipients, HLA-DR expression in all B cells (measured by mean fluorescence intensity) did not significantly increase after vaccination. However, baseline HLA-DR expression was significantly greater before vaccination
in patients who eventually went on to seroconversion. This was true for both the naive B-cell subset (CD20+CD27−;P < .001) as well as memory B cells (CD20+CD27+;P < .001) (Figure2A). Table2provides an overview comparison of patients in differ-ent subsets (Table2).
H1N1-inducible CD86 expression did not significantly chan-ge after vaccination. However, CD86 expression was signi fi-cantly greater in patients who seroconverted specifically in the naive B-cell subset (Figure2B). In addition, after vaccination, patients receiving MMF at≥2 g/d had reduced H1N1-stimulated CD86 expression on naive B cells compared with those receiving <2 g/d (P = .05) (Figure2C). Prevaccine (baseline) levels of CD86-and HLA-DR expression were predictors of seroconversion (area under the curve for HLA-DR, 0.843). For HLA-DR (CD86) expression, the highest sensitivity and specificity were 76.5% (70.6%) and 84.6% (76.9%), respectively (Table3). We further explored the role of IL-4+CD4+T cells on B-cell activation, a process partially regulated by T-helper cells and Th2 cytokines, such as IL-4. In patients who seroconverted, the increase in H1N1-specific IL-4+
CD4+T cells after vaccination was directly correlated to HLA-DR expression on B cells (P = .02; Figure2D).
H1N1 Induced Cytokine Profile in Transplant Recipients Cytokine profiles were measured in supernatants collected from postvaccine samples in which PBMCs were stimulated with H1N1 antigen. We explored the differences in cytokine profiles with or without seroconversion using a heat map and principal component analysis (Figure3A). Based on the expression pro-file of 28 immune markers (including 17 cytokines), the cluster analysis indicated 3 predominant groups. These 3 clusters Figure 1. H1N1-specific interleukin 4 (IL-4)+CD4+T-cell dynamics during vaccination. A, Frequency of H1N1-specific IL-4+CD4+T cells in patients who
seroconverted to influenza A/H1N1 versus those who did not. Patients who seroconverted had a greater rise in the frequency of IL-4+CD4+T cells after vaccination (P = .04). B, Frequency of H1N1-specific IL-4+CD4+T cells in patients who received mycophenolate mofetil (MMF) at≥2 g/d versus those who
represent patients without seroconversion but with protection (cluster 1), patients without seroconversion or sero-protection (nonresponders) (cluster 2), and patients with both seroconversion and seroprotection (cluster 3). Figure3B shows the mean expression of each marker in the 3 clusters. Cluster 1 showed a relatively high expression of Th2 cytokines and low expression of Th1 cytokines; this was associated with high pre- and postvaccine HAI antibody titers to H1N1, even though these patients did not seroconvert. Cluster 3 identified a popu-lation of patients with a significant increase in HAI titers after vaccination; in particular the B-cell activation markers were sig-nificantly up-regulated in these patients. Two-dimensional principal component analysis indicated that HLA-DR expres-sion and Th2 cytokines may be responsible for this clustering (data not shown).
Use of Phenomenological Mathematical Model to Predict Vaccine Response
We developed a dynamic mathematical model of the following structure (Figure4A). An assumption for the model was that IL-4–producing CD4+
T cells activate B cells and up-regulate HLA-DR expression in a positive feedback loop. This interac-tion results in antibody producinterac-tion from B cells. MMF serves as a dose-dependent inhibitor of this feedback loop. The model describes the evolution over time of the percentage of H1N1-specific IL-4+CD4+T cells, HLA-DR expression on B cells, and serum antibody (HAI) titers as a result of H1N1 vaccination.
Using this model, day 30 ( postvaccine) values for each vari-able as well as dynamics for these varivari-ables after vaccination can be predicted in patients who seroconverted versus those that Figure 2. H1N1-induced B-cell activation during vaccination. The background (nonstimulated) expression of HLA-DR and CD86 was subtracted. The me-dian background was 95.9 AU for HLA-DR and 43.7 AU for CD86 (also see Table2). A, Expression of H1N1-induced HLA-DR expression on naive and memory B cells before vaccination was greater in patients who seroconverted (n = 15) than in those who showed no seroconversion to influenza A/H1N1 (n = 32). B, Expression of H1N1-induced CD86 expression on naive and memory B cells was greater in patients who seroconverted (n = 15) than in those who showed no seroconversion to influenza A/H1N1 (n = 32). C, Expression of H1N1-induced CD86 expression on naive B cells after vaccination based on mycophenolate mofetil (MMF) dose. Patients receiving MMF at≥2 g/d had significantly less expression of CD86. In A–C, bars and whiskers represent indicate median values with interquartile ranges; Mann–Whitney U tests were used to identify significant differences. D, Regression analysis of fold change in interleukin 4 (IL-4)+T-cell frequencies and their impact on HLA-DR expression on B cells in patients with seroconversion (n = 15). Abbreviations: MFI, meanfluorescence intensity; PBMCs, peripheral blood mononuclear cells.
did not. The model was calibrated to conservatively predict seroconversion, and based on our current data it achieves a sen-sitivity of 70% and specificity of 100%, as determined by leave-one-out cross-validation (seeSupplementary Informationfor details andSupplementary Table 1for the estimated model parameters). Figure4B shows the predicted dynamics of the IL-4+CD4+T-cell frequency, HLA-DR expression on B cells, and H1N1 antibody HAI titer starting from patient baseline val-ues at day 0 with modulation by actual MMF dosages. These simulation results illustrate a strong dependency of seroconver-sion on sufficient prevaccine HLA-DR expresseroconver-sion levels. Simu-lations with hypothetical low (Figure4C) and high (Figure4D) MMF dosages demonstrate an inhibitory effect of MMF that is especially pronounced at high dosages (≥2 g/d).
Healthy Volunteer Response to Vaccine
Humoral and cellular vaccine responses were also evaluated in 11 healthy volunteers. Healthy volunteers were significantly younger than the transplant recipients and did not receive im-munosuppressive drugs. All volunteers had received influenza vaccine in prior years and did not have a history of microbio-logically proven influenza infection. A significant increase in HAI titers to H1N1 after immunization (tumor necrosis factor, 66–345; P = .009) was observed (100% seroprotection and sero-conversion to H1N1). Geometric mean titers were significantly higher in healthy controls than in transplant recipients (83 vs 345;P = .02). Similar to transplant recipients, healthy volunteers also showed a significant increase in the frequency of H1N1-specific IL-4+
CD4+T cells after vaccination. However, unlike transplant recipients, healthy volunteers did show an increase in IFN-γ+
CD4+T cells after vaccination (Supplementary
Fig-ure 2B). H1N1-induced B-cell activation markers were high in
healthy volunteers and were similar to those in transplant recip-ients (data not shown); healthy volunteers also had no signi fi-cant changes in HLA-DR- and CD86 expression from before to after vaccination (data not shown). The postvaccine cytokine profile showed that healthy controls had significantly greater levels of fractalkine, IFN-γ, MCP-3, interleukin 1β, interleukin 6, and MIP-1α (Supplementary Figure 2C). The results of the cytokine profile are shown inSupplementary Table 2. These findings should be interpreted in the context of the significantly younger age of the healthy volunteers compared with the trans-plant recipients.
DISCUSSION
We performed a detailed analysis of H1N1-induced B- and T-cell responses to assess factors associated with successful sero-conversion after influenza vaccination in the organ transplant population. We show that Th2 cytokines are associated with H1N1-induced B-cell activation in terms of HLA-DR (antigen presentation) and CD86 (costimulatory signaling) expression,
Ta b le 2 . B-C ell Activa tion Mark ers Befor e and After V a ccina tion in B-C ell Subsets According to Se roconv ersion Sta tus V a ccine HLA -DR, MF I a CD8 6, M F I a Se rocon v ers ion No Se rocon v ers ion Se roco nv ers ion No Ser conv ersion Pr eva cccin e P os tva cccine Pr eva cc cine P o s tva cccin e P reva cccin e P os tva cccine Pr eva cc cine P o s tva cccine All (CD2 0 + ) 203 (1 25 – 321) 196 (85 – 287) 1 (1 – 81) 1 (1 – 1) 276 (145 – 330) 235 (101 – 419) 105 (1 – 213) 142 (64 – 274) Naiv e (CD2 0 + CD27 − ) 168 (1 33 – 296) 246 (108 – 287) 1 (1 – 41) 1 (1 – 1) 204 (92 – 289) 211 (87 – 328) 83 (1 – 151) 59 (3 – 209) Mem ory (CD2 0 + C D27 + ) 132 (6 3– 358) 208 (65 – 318) 1 (1 – 94) 1 (1 – 36) 409 (282 – 623) 414 (192 – 790) 253 (41 – 436) 348 (88 – 596) Abbr evia tion: MFI, mean fluor escence intensity . aMFI values ar e sho wn in pH1N1 o v ernight-s timula ted B-cell subsets (ba ckgr ound subtr a cted). Da ta repr esent median values (interquartile range).
as well as antibody secretion. MMF reduced IL-4+CD4+T-cell frequencies and B-cell activation. The type of graft (lung vs nonlung transplant) did not have an effect on T-cell responses. We used several analytical techniques to formulate sensitive and specific predictive models to discriminate vaccine responders from nonresponders.
The influenza vaccine stimulates the Th1- and Th2-pathway in order for B-cell differentiation to occur [23]. One of our key findings was the increase in H1N1-specific IL-4+
CD4+T cells after vaccination. IL-4 is involved in humoral immunity and, to our knowledge, has not previously been explored in the con-text of vaccination of transplant recipients. IL-4 (originally termedB-cell stimulatory factor 1) is a cytokine produced by Th2 cells and has been shown to increase HLA-DR expression on resting B cells, thereby increasing production of immuno-globulin G (IgG) [24, 25]. Th2 responses have also been shown to be important in mice immunized with a universal in-fluenza vaccine [26].
We did not observe a significant rise in IFN-γ+
CD8+T-cell frequency after vaccination in transplant recipients, contrary to that seen in the healthy volunteer cohort. The frequency of H1N1-specific IFN-γ+CD4+and IFN-γ+CD8 T cells was con-sistent withfindings in previous studies of influenza vaccine [27]. These results were also similar to results shown by Cowan et al [28], who showed a significantly greater increase in IFN-γ responses in healthy controls compared with kidney transplant recipients. Another study in lung transplant Table 3. ROC Curve Statistics for Prevaccine HLA-DR and CD86
Expression on All B Cells for the Prediction of Successful Seroconversion Variable AUC, Mean (SE) P Value 95% CI Best Cutoff Value, MFI Sensitivity, % Specificity, % HLA-DR 0.843 (0.060) <.001 .72–.97 123 76.5 84.6 CD86 0.700 (0.083) .01 .58–.89 213 70.6 76.9 Abbreviations: AUC, area under the curve; CI, confidence interval; MFI, mean fluorescence intensity; ROC, receiver operating characteristic; SE, standard error.
Figure 3. H1N1-induced cytokine profile. A, Heat map of cytokines, antibody titers and B-cell activation markers in H1N1-stimulated peripheral blood mononuclear cells of the total postvaccine transplant cohort. Blue represents seroconversion (n = 15); red, no seroconversion (n = 28; for 4 samples, no cytokine profile was available). Nonstimulated background samples were subtracted before the normalization algorithm. Relative changes in a marker are indicated by change in color code (blue, maximum 5.8-fold down-regulation; red, maximum 5.8-fold up-regulation). Markers analyzed (top to bottom): fractalkine (FRAK), interleukin 13 (IL-13), interleukin 9 (IL-9), interleukin 5 (IL-5), CD4+T-cell (CD4) interferon (IFN)γ, CD4 interleukin 4 (IL-4), IL-4, memory-phenotype B-cell (mB) CD69, interleukin 1β (IL-1β), growth regulated oncogene (GRO), soluble CD40L (sCD40L), H1N1 antibody (Ab) titer, IFN-α, interleukin 2 (IL-2), IFN-γ, tumor necrosis factor (TNF) α, interleukin 6 (IL-6), macrophage inflammatory protein 1α (MIP-1α), monocyte chemoattractant protein 3 (MCP-3), naive-phenotype B-cell (nB) CD69, interferon gamma induced protein 10 (IP-10), mB CD86, nB CD86, monocyte (mo) CD86, nB HLA-DR expression (DR), mB DR, mo DR, and MCP-1. B, Cluster 1 represents patients without seroconversion but with seroprotection (left); cluster 2, patients without seroconversion or sero-protection (middle); and cluster 3, patients with both seroconversion and serosero-protection (right). Relative changes are indicated by changes in color code (see A). Markers analyzed (top to bottom): FRAK, mo DR, IL-13, CD4 IFN-γ, 9, 5, CD4 4, 1β, 4, mB CD69, sCD40L, H1N1 antibody titer, GRO, IFN-α, IFN-γ, IL-6, MIP-1α, MCP-3, IL-2, TNF-α, mo CD86, nB CD86, mB CD86, nB CD69, MCP-1, nB DR, mB DR, and IP-10. One-way analysis of variance (ANOVA; performed with GeneSpring software) was calculated to indicate that a cytokine is differentially expressed in≥1 of the 3 groups analyzed; ANOVA used the mean of the sum of squared deviates as an aggregate measure of variability for the selected group of genes, applying parametric testing for equal group sizes and inde-pendent samples, without post hoc testing. Principal component (PC)1, PC2, and PC3 had weights of 54.6%, 31.9% and 13.5% respectively.
recipients also did not show an increase in influenza vaccine– related IFN-γ after influenza vaccination [17]. Previous studies in transplant recipients have not found a relationship between IFN-γ and humoral responses. For example, in a kidney trans-plant cohort, although an increase in IFN-γ was seen after vac-cination, this was not associated with humoral responses [16]. The study by Cowan et al [28] also did not show a correlation between IFN-γ T-cell responses and influenza-specific IgG responses. Virus-specific CD8+
T cells typically recognize peptides derived from internal components of the virus [29].
Thus, during influenza replication, cytotoxic T cells could re-spond to a broader spectrum of possible expressed epitopes and proteins in comparison to strain-specific antibodies to the viral hemagglutinin (HA) and neuraminidase (NA) glycopro-teins [30]. However, inactive vaccines do not replicate, and therefore they contain only a limited spectrum of proteins, namely HA and NA glycoproteins; the induced CD8+T-cell re-sponse may not directly correlate with an antibody rere-sponse. Nevertheless, if an IFN-γ response develops, it could promote the induction of HA-specific neutralizing antibodies and may Figure 4. Mathematical model. A, Overview of the structure of the phenomenological mathematical model. Interleukin 4 (IL-4)–producing T cells and HLA-DR–expressing B cells activate each other in a mutual feedback loop that is inhibited by mycophenolate mofetil (MMF). Antibody production is modeled in a HLA-DR expression–dependent manner. B–D, Dynamics of the ordinary differential equation model for IL-4+T-cell frequency, HLA-DR expression on naive B cells, and H1N1 antibody hemagglutination inhibition titer starting from patient baseline values on day 0 for nonseroprotected patients and dis-tinguishing between patients who seroconverted (black) and those who did not (red). Simulations were performed with patient-specific MMF dosage (B) and 2 hypothetical situations where patients receive no MMF (C) or a 3-g daily dose (D ).
in fact help with broadening responses to heterologous influen-za viruses [31,32].
In the nontransplant literature, the ratio of Th2 to Th1 cyto-kines has been suggested to be associated with vaccine respons-es in the elderly. Similar to our study, McElhaney et al [33] measured interleukin 10 as a marker of Th2 responses and showed a significant rise after vaccination in PBMCs of elderly persons stimulated with H1N1. In our cohort we observed a sig-nificant increase of IL-4–producing CD4+
T cells in patients with seroconversion. Our cytokine profile also indicated sig-nificant differences in Th2 cytokines in patients with serocon-version and seroprotection compared with nonresponding patients.
We also explored B-cell immunity using HLA-DR and CD86 as markers of activation. HLA-DR acts as a ligand for the T-cell receptor resulting in antigen presentation and further stimula-tion of T cells. In addistimula-tion, CD86 acts as a costimulatory mol-ecule on B cells and interacts with CD28 on T cells [34]. To our knowledge, these markers have not previously been explored in the context of immunization of organ transplant recipients. The prevaccine expression of these markers was high in patients who seroconverted, suggesting a role for these markers in prediction of seroconversion. Indeed, receiver operating characteristic curve analysis showed that baseline HLA-DR and CD86 expres-sion had high sensitivity and specificity in predicting serocon-version. The high responsiveness of memory B-cell subsets before vaccination may be partially explained by prior illness or previous vaccination. All transplant recipients and healthy volunteers had previously received influenza vaccine.
General effects on IgG serum concentration in transplant re-cipients treated with MMF have been described elsewhere [35]. Several studies have now shown that high doses of MMF reduce the immunogenicity of influenza vaccination [9–11]. Our co-hort also had reduced responses by HAI assay in patients receiv-ing≥2 g/d. MMF and mycophenolic acid have been shown to inhibit B-cell activation and proliferation and plasma cell for-mation [36,37]. Our study provides insight into a possible mechanism. We found that high doses of MMF had a deleteri-ous impact on IL-4+CD4+T-cell frequencies and was associated with reduced HLA-DR expression on B cells.
Our results are consistent with those of a previous study, which showed a dose-dependent reduction of HLA-DR expres-sion on B cells with increasing mycophenolate [38]. In addition, the ODE model predicts high, sustained antibody titers in most patients who seroconverted and low antibody titers (with pos-sibly high transient titers) in those who did not. Without MMF, the model predicts that most patients who did not seroconvert in the study would develop high antibody titers at day 30, and with a hypothetical MMF dosage of 3 g/d, it predicts that none of the patients would seroconvert. Large uncertainties in esti-mated model parameters, however, indicate that more data ( patients and time points) and possibly model extensions will
be required to drawfinal conclusions on the predictive power of this modeling approach.
Our study has some limitations. Almost all of our patients and healthy volunteers had been previously vaccinated, which may have influenced responses. We used only certain signature cytokines for the Th1 and Th2 response, and it is possible that other cytokines may behave differently. In addition, although the trivalent influenza vaccine contains 2 A strains and 1 B strain, we used influenza A/H1N1 as a model for vaccine re-sponses. It is possible that other strains of influenza such as A/H3N2 and B strains induce differing Th1 and Th2 profiles. We also had different organ types represented in our popula-tion, though this allowed us to provide a broad overview of cellular immunity to vaccine in the transplant recipient popula-tion. An important point is that our healthy control group was also significantly younger than the transplant cohort. It has been well described that aging is an important factor for re-duced humoral responses [33], and the comparative immuno-logical responses in transplant and healthy individuals should be interpreted in this context.
In summary, Th2 responses seem to be key regulators of in-fluenza vaccine response in transplant recipients. B-cell activa-tion markers before immunizaactiva-tion have the potential to predict future humoral responses to vaccine. MMF is a key regulator of these responses at the cellular level. Tailoring immunosuppres-sion to influence the vaccine response via up-regulation of a Th2 cytokine profile may be a future strategy to improve out-comes of vaccination.
Supplementary Data
Supplementary materialsare available atThe Journal of Infectious Diseases
online (http://jid.oxfordjournals.org). Supplementary materials consist of data provided by the author that are published to benefit the reader. The posted materials are not copyedited. The contents of all supplementary data are the sole responsibility of the authors. Questions or messages regard-ing errors should be addressed to the author.
Notes
Acknowledgments. We thank Leticia Wilson (University of Alberta) for recruiting patients and Sarah Tschudin-Sutter, MD, MSc (University of Basel) for statistical advice.
Financial support. This work was funded by the Canadian Institutes of Health Research and Canadian National Transplant Research Program, the Swiss National Fund (grant PBBSP3-130963 to A. E.), the Lichtenstein Foundation and the SNSF Ambizione Score Grant (grant to A. E.), the Canadian Society of Transplantation (fellowship to L. F. L.), and the Cana-dian Institutes of Health Research and Alberta Innovates Health Solutions ( postdoctoral fellowships to D. M. S.).
Potential conflicts of interest. A. H. and D. K. have received research grants from Roche, and D. K. has received a research grant from Glaxo SmithKline. All other authors report no potential conflicts.
All authors have submitted the ICMJE Form for Disclosure of Potential Conflicts of Interest. Conflicts that the editors consider relevant to the con-tent of the manuscript have been disclosed.
References
1. Kumar D, Michaels MG, Morris MI, et al. Outcomes from pandemic influenza A H1N1 infection in recipients of solid-organ transplants: a multicentre cohort study. Lancet Infect Dis2010; 10:521–6.
2. Vilchez RA, McCurry K, Dauber J, et al. Influenza virus infection in adult solid organ transplant recipients. Am J Transplant2002; 2: 287–91.
3. Danziger-Isakov L, Kumar D; AST Infectious Diseases Community of Practice. Vaccination in solid organ transplantation. Am J Transplant 2013; 13(suppl 4): 311–7.
4. Kumar D, Blumberg EA, Danziger-Isakov L, et al. Influenza vaccination in the organ transplant recipient: review and summary recommenda-tions. Am J Transplant2011; 11:2020–30.
5. Cordero E, Manuel O. Influenza vaccination in solid-organ transplant recipients. Cur Op Organ Transplant2012; 17:601–8.
6. Baluch A, Humar A, Eurich D, et al. Randomized controlled trial of high-dose intradermal versus standard-dose intramuscular influenza vaccine in organ transplant recipients. Am J Transplant2013; 13: 1026–33.
7. Hayney MS, Moran J, Wiegert NA, Burlingham WJ. Lung transplant patients’ T cell responses to influenza vaccine viruses between seasons. Vaccine2008; 26:2596–600.
8. Keshtkar-Jahromi M, Argani H, Rahnavardi M, et al. Antibody response to influenza immunization in kidney transplant recipients receiving either azathioprine or mycophenolate: a controlled trial. Am J Nephro2008; 28:654–60.
9. Sanchez-Fructuoso AI, Prats D, Naranjo P, et al. Influenza virus immu-nization effectivity in kidney transplant patients subjected to two differ-ent triple-drug therapy immunosuppression protocols: mycophenolate versus azathioprine. Transplantation2000; 69:436–9.
10. Salles MJ, Sens YA, Boas LS, Machado CM. Influenza virus vaccination in kidney transplant recipients: serum antibody response to different immunosuppressive drugs. Clin Transplan2010; 24:E17–23. 11. Scharpe J, Evenepoel P, Maes B, et al. Influenza vaccination is efficacious
and safe in renal transplant recipients. Am J Transplant2008; 8:332–7. 12. Nakaya HI, Wrammert J, Lee EK, et al. Systems biology of vaccination
for seasonal influenza in humans. Nat Immunol 2011; 12:786–95. 13. O’Shea D, Widmer LA, Stelling J, Egli A. Changing face of vaccination
in immunocompromised hosts. Cur ID Reports2014; 16:420. 14. McCullers JA, Huber VC. Correlates of vaccine protection from
influ-enza and its complications. Hum Vaccin Immunother2012; 8:34–44. 15. Wilkinson TM, Li CK, Chui CS, et al. Preexisting influenza-specific
CD4+T cells correlate with disease protection against influenza chal-lenge in humans. Nature Med2012; 18:274–80.
16. Candon S, Thervet E, Lebon P, et al. Humoral and cellular immune re-sponses after influenza vaccination in kidney transplant recipients. Am J Transplant2009; 9:2346–54.
17. Mazzone PJ, Mossad SB, Mawhorter SD, Mehta AC, Mauer JR. Cell-mediated immune response to influenza vaccination in lung transplant recipients. J Heart Lung Transplant2004; 23:1175–81.
18. World Health Organization. Immunization, vaccines, and biologicals.
http://www.who.int/vaccine_research/diseases/influenza/Guidelines_
regulatory_preparedness_pandemic_influenza_vaccines.pdf. Accessed
October 2014.
19. Egli A, Silva M Jr, O’Shea D, et al. An analysis of regulatory T-cell and Th-17 cell dynamics during cytomegalovirus replication in solid organ transplant recipients. PLoS One2012; 7:e43937.
20. Hindmarsh AC, Brown PN, Grant KE, et al. SUNDIALS: suite of non-linear and differential/algebraic equation solvers. ACM Trans Math Softw2005; 31:363–96.
21. Villaverde AF, Egea JA, Banga JR. A cooperative strategy for parameter estimation in large scale systems biology models. BMC Syst Biol2012; 6:75.
22. Zamora-Sillero E, Hafner M, Ibig A, Stelling J, Wagner A. Efficient char-acterization of high-dimensional parameter spaces for systems biology. BMC Syst Biol2011; 5:142.
23. Alam S, Knowlden ZA, Sangster MY, Sant AJ. CD4T cell help is limiting and selective during the primary B cell response to influenza virus in-fection. J Virol2014; 88:314–24.
24. Paul WE, Ohara J. B-cell stimulatory factor-1/interleukin 4. Annu Rev Immunol1987; 5:429–59.
25. Mosmann TR, Coffman RL. TH1 and TH2 cells: different patterns of lymphokine secretion lead to different functional properties. Annu Rev Immunol1989; 7:145–73.
26. Adler-Moore J, Munoz M, Kim H, et al. Characterization of the murine Th2 response to immunization with liposomal M2e influenza vaccine. Vaccine2011; 29:4460–8.
27. Baluch A, Humar A, Egli A, et al. Long term immune responses to pan-demic influenza A/H1N1 infection in solid organ transplant recipients. PLoS One2011; 6:e28627.
28. Cowan M, Chon WJ, Desai A, et al. Impact of immunosuppression on recall immune responses to influenza vaccination in stable renal trans-plant recipients. Transtrans-plantation2014; 97:846–53.
29. Wahl A, Schafer F, Bardet W, Buchli R, Air GM, Hildebrand WH. HLA class I molecules consistently present internal influenza epitopes. Proc Natl Acad Sci U S A2009; 106:540–5.
30. Kreijtz JH, Fouchier RA, Rimmelzwaan GF. Immune responses to influ-enza virus infection. Virus Res2011; 162:19–30.
31. Clegg CH, Roque R, Van Hoeven N, et al. Adjuvant solution for pan-demic influenza vaccine production. Proc Natl Acad Sci U S A 2012; 109:17585–90.
32. Bright RA, Carter DM, Daniluk S, et al. Influenza virus-like particles elicit broader immune responses than whole virion inactivated influenza virus or recombinant hemagglutinin. Vaccine 2007; 25:3871–8.
33. McElhaney JE, Upshaw CM, Hooton JW, Lechelt KE, Meneilly GS. Responses to influenza vaccination in different T-cell subsets: a comparison of healthy young and older adults. Vaccine 1998; 16:1742–7.
34. Li XC, Rothstein DM, Sayegh MH. Costimulatory pathways in trans-plantation: challenges and new developments. Immunol Rev2009; 229:271–93.
35. Ganschow R, Lyons M, Kemper MJ, Burdelski M. B-cell dysfunction and depletion using mycophenolate mofetil in a pediatric combined liver and kidney graft recipient. Ped Transplantation2001; 5:60–3. 36. Eickenberg S, Mickholz E, Jung E, Nofer JR, Pavenstadt HJ, Jacobi AM.
Mycophenolic acid counteracts B cell proliferation and plasmablast for-mation in patients with systemic lupus erythematosus. Arthritis Res Ther2012; 14:R110.
37. Karnell JL, Karnell FG III, Stephens GL, et al. Mycophenolic acid differ-entially impacts B cell function depending on the stage of differentia-tion. J Immunol2011; 187:3603–12.
38. Heinschink A, Raab M, Daxecker H, Griesmacher A, Muller MM. In vitro effects of mycophenolic acid on cell cycle and activation of human lymphocytes. Clinica Chimica Acta2000; 300:23–8.