ORIGINAL PAPER
Does diagnostic delay result in decreased survival
in paediatric brain tumours?
Karel Kukal&Milana Dobrovoljac&
Eugen Boltshauser&Roland A. Ammann&
Michael A. Grotzer
Received: 12 March 2008 / Accepted: 30 April 2008 / Published online: 7 June 2008 # Springer-Verlag 2008
Abstract To study the hypothesis that a delay in the diagnosis of paediatric brain tumours results in decreased survival outcome probability, we compared the prediagnostic period of 315 brain tumour patients (median age 6.7 years, range, 0 to 16 years) with progression-free and overall survival. The median prediagnostic symptomatic interval was 60 days (range, 0 to 3,480 days), with a median parental delay of 14 days (range, 0 to 1,835 days) and a median doctor’s delay of 14 days (range, 0 to 3,480 days). The prediagnostic symptomatic interval correlated significantly with the patient age, tumour histology, tumour location and year of diagnosis, but not with gender. We then grouped the patients according to histology (low-grade glioma [n=77], medulloblastoma [n=57], high-grade glioma [n=40], cranio-pharyngioma [n=27], ependymoma [n=20] and germ cell tumours [n=18]). Contrary to common belief, long prediag-nostic symptomatic interval or long doctor’s delay did not result in decreased survival outcome probability in any of
these groups. The effect of tumour biology on survival seems to be dominant and overwhelms any possible opposing effect on survival of a delay in diagnosis.
Keywords Brain tumour . Diagnosis . Survival outcome
Introduction
As a group, brain tumours are the most common solid tumours in children [9]. They differ from primary central nervous system tumours occurring in adults not only in histology, localisation, management and prognosis, but also in clinical presentation [14]. At the onset of illness, the nature of neurological and systemic dysfunction is often non-specific and variable, and relates not only to the site of origin of the tumour, but also to the child’s age and developmental level [20]. The diagnosis of brain tumours poses difficulties and this is sometimes reflected in long prediagnostic symptomatic intervals (PSI) [3,4,8,13,15,
16, 18, 22, 23]. The better availability of computed tomography (CT) and magnetic resonance imaging (MRI) since the 1990s has resulted in shorter doctor’s delay [3]. However, the median PSI of a recently described cohort of 200 patients diagnosed between 1988 and 2001 was still 2.5 months (range, 1 day to 120 months) [23]. Understand-ably, parents frequently raise the question as to whether an earlier diagnosis could have been made and, if so, whether the “delay” adversely affects prognosis. Recent reports describe the symptomatology of paediatric brain tumour cohorts [3, 22, 23], but information on the potential influence of PSI and doctor’s delay on prognosis is scant. The present study was undertaken to study the common belief that a delay in the diagnosis of paediatric brain tumours results in decreased survival outcome probability.
K. Kukal
:
M. Dobrovoljac:
M. A. Grotzer (*) Department of Oncology,University Children’s Hospital of Zurich, Steinwiesstrasse 75,
8032 Zurich, Switzerland
e-mail: [email protected] E. Boltshauser
Department of Neurology,
University Children’s Hospital of Zurich, Zurich, Switzerland
R. A. Ammann
Department of Paediatric Haematology/Oncology, University Children’s Hospital of Bern,
Patients and methods
A retrospective study was undertaken on children up to the age of 16 years with primary brain tumours, admitted consecutively to the University Children’s Hospital of Zurich, Switzerland, from January 1980 to December 2004. The clinical signs and symptoms of part of this series (n=252) have been reported previously [3]. Medical case notes, referral letters, neurosurgical records, histopa-thology reports, follow-up and survival outcomes were reviewed by two independent investigators (K.K. and M. D.). The PSI was defined as the interval between the onset of signs/symptoms and the time of diagnosis by MRI, CT or other imaging techniques. The PSI was subdivided into an interval between symptom onset and the first medical consultation (parental delay), and an interval between the first medical consultation and diagnosis by CT, MRI or other imaging techniques (doctor’s delay). Discrepancies in the PSI were noted for 32 patients. These cases were re-examined together with the last author, and a consensus was reached.
Statistical analyses
Since most data were non-normally distributed, medians and interquartile ranges (IQR) were calculated for
descrip-tive statistics, and non-parametric exact methods were used in the analytical statistics. In order to assess potential associations between the patient characteristics and delays, the Wilcoxon-Mann-Whitney test was used for binary variables, the Kruskal-Wallis test for categorical variables and the Jonckheere-Terpstra test for continuously measured variables divided into ordered categories before analysis. Overall survival (OS) was defined as the probability of survival, with only death as the event; children who were alive were censored at their last follow-up. Progression-free survival (PFS) was defined as the probability of being alive and free of progression/relapse; death and progression/ relapse were considered as events. For survival analysis, the Kaplan-Meier estimate and its 95% confidence intervals (95% CI) were calculated. Age at diagnosis, PSI and the doctor’s delay were categorized into four groups, each according to their quartiles before analysis, since a linear association between these delay times and outcome could not been assumed. The log-rank test was used to detect
Table 1 Location and histology of the 315 brain tumours examined in this study
Location and tumour histology Number of tumours %
Infratentorial 136 43
Medulloblastoma 57 18
Low-grade cerebellar glioma 31 10
Brainstem glioma 19 6
Ependymoma 11 3
Other 12 4
Tumours of unknown histology 6 2
Supratentorial hemispheric 103 33
Low-grade glioma 29 9
High-grade glioma 18 6
Choroid plexus tumour 7 2
Ependymoma 8 3
Primitive neuroectodermal tumours 7 2
Oligodendroglioma 3 1
Other 27 9
Tumours of unknown histology 4 1
Supratentorial midline 76 24
Craniopharyngioma 27 9
Germ cell tumour 17 5
Low-grade glioma 14 4
Primitive neuroectodermal tumours 2 1
Other 11 3
Tumours of unknown histology 5 2
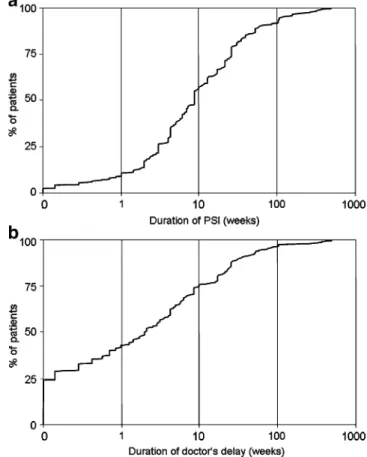
Fig. 1 a Cumulative distribution of the prediagnostic symptomatic interval (PSI) for 315 paediatric patients with brain tumours. b Cumulative distribution of the doctor’s delay for 234 patients, where medical charts permitted subdividing the PSI into an interval between symptom onset and the first medical consultation (parental delay), and an interval between the first medical consultation and diagnosis by computed tomography (CT), magnetic resonance imaging (MRI) or other imaging techniques (doctor’s delay)
differences in survival between different groups of patients. Two-sided tests were used throughout, and P-values below 0.05 were considered to be significant. StatXact 6 (Cytel Software Corp., Cambridge, MA, USA) was used for the exact non-parametric tests and S-PLUS 6.0 (Insightful Corp., Seattle, WA, USA) was used for the survival analyses and graphics.
Results
Patient and tumour characteristics
Three hundred and fifteen patients with a primary brain tumour were admitted to the University Children’s Hospital of Zurich, Switzerland, between January 1980 and December 2004. The tumour characteristics of these patients are summarised in Table 1. They are comparable to those of larger series [14]. Therefore, the present cohort can be considered as adequately representative. The median age at diagnosis for all patients was 6.7 years (range, 0.0 to 16.0 years; IQR, 3.0 to 10.5 years). One hundred and eighty-five (59%) patients were male and 130 (41%) were
female. Tumour location was infratentorial in 136 (43%) and supratentorial in 179 (57%) patients. Diagnoses were established by the histological assessment of a tumour specimen obtained at surgery in 274 (87%) patients and by typical imaging findings in 26 (8%) patients (e.g. diffuse intrinsic pontine glioma). In 15 (5%) patients with large tumours and poor general condition, no biopsy was undertaken and the histology remains unknown. The median follow-up time for all patients was 3.4 years (range, 0.0 to 25.3 years).
Prediagnostic symptomatic interval
The median PSI of all patients was 60 days (range, 0 to 3,480 days; IQR, 21 to 180 days), with a median parental delay of 14 days (range, 0 to 1,835 days; IQR, 0 to 46 days) and a median doctor’s delay of 14 days (range, 0 to 3,480 days; IQR, 1 to 69 days) in the 234 (74%) patients where this distinction was possible. Figure 1a shows the overall cumulative distribution of PSI (n=315). Only 112 (36%) of the 315 brain tumours were diagnosed within 30 days from the onset of signs/symptoms. PSI was 31– 60 days in 62 (20%) patients, 61–180 days in 75 (24%)
Table 2 Prediagnostic symptomatic interval (PSI), parental delay and doctor’s delay (median and interquartile range [IQR]) in relation to age at diagnosis, gender, histology, tumour location and year of diagnosis
PSI (days) Parental delay (days) Doctor’s delay (days)
Age at diagnosis JT=4.83, P<0.001 JT=2.23, P=0.025 JT=1.50, P=0.13 - Up to 4 years (n=100) 31 (14–62) 5 (0–27) 10 (1–49) - 4 to 8 years (n=92) 63 (29–180) 21 (2–51) 14 (0–103) - 8 to 12 years (n=62) 79 (33–270) 21 (0–48) 29 (6–66) -≥12 years (n=61) 106 (30–219) 11 (0–101) 20 (1–173) Gender WMW=1.44, P=0.15 WMW=0.55, P=0.58 WMW=1.57, P=0.12 - Female (n=130) 60 (21–180) 14 (0–49) 21 (2–120) - Male (n=185) 53 (21–150) 14 (0–44) 13 (0–60) Histology KW=36.09, P<0.001 KW=15.1, P=0.017 KW=13.83, P=0.030 - Ependymoma (n=20) 30 (9–60) 5 (0–8) 5 (2–40) - Medulloblastoma (n=57) 36 (21–60) 20 (3–40) 6 (0–30)
- Germ cell tumour (n=18) 39 (19–216) 14 (0–40) 14 (0–39)
- High-grade glioma (n=40) 49 (21–120) 10 (0–20) 13 (4–47) - Low-grade glioma (n=77) 142 (42–195) 29 (3–86) 38 (2–148) - Craniopharyngioma (n=27) 210 (81–445) 38 (4–135) 39 (7–338) Location KW=9.47, P=0.008 KW=6.57, P=0.039 KW=2.85, P=0.24 - Infratentorial (n=136) 45 (23–124) 17 (2–42) 10 (0–43) - Supratentorial hemisphere (n=103) 60 (15–180) 7 (0–30) 13 (1–120) - Supratentorial midline (n=76) 98 (30–360) 21 (0–75) 25 (1–180) Year of diagnosis JT=2.11, P=0.034 JT=0.57, P=0.57 JT=1.28, P=0.20 - 1980 to 1984 (n=66) 60 (30–210) 10 (0–30) 30 (4–165) - 1985 to 1989 (n=51) 90 (30–202) 8 (0–56) 25 (0–96) - 1990 to 1994 (n=61) 49 (21–175) 14 (0–46) 12 (0–60) - 1995 to 1999 (n=59) 65 (28–180) 26 (0–90) 12 (0–70) - 2000 to 2004 (n=78) 42 (17–118) 14 (1–37) 9 (2–49)
JT=Jonckheere-Terpstra statistic, exact P-value calculated; WMW=Wilcoxon-Mann-Whitney statistic, exact P-value calculated; KW=Kruskal-Wallis statistic, exact P-value calculated.
patients, 181–365 days in 31 (10%) patients and >365 days in 35 (11%) patients.
The cumulative distribution of the doctor’s delay is shown in Fig. 1b. The doctor’s delay was 0 days in 57
(24%) patients, 1–30 days in 81 (35%) patients, 31–60 days in 35 (15%) patients, 61–180 days in 33 (14%) patients, 181–365 days in 14 (6%) patients and >365 days in 14 (6%) patients. The doctor’s delay, thus, exceeded 30 days in 96 (41%) of 234 patients. There was a non-significant trend that doctor’s delays were longer compared with parental delays (Wilcoxon signed-rank statistic, 1.51, P=0.15).
The age at diagnosis was significantly associated with PSI, which was shorter in younger children (see Table 2). This was mainly due to a shorter parental delay in younger children, while doctor’s delay was not significantly associ-ated with age at diagnosis. There was no association, however, of gender with any of the three delay measures. Tumour histology was also found to correlate with PSI. Aggressive fast-growing tumours (e.g. medulloblastoma, germ cell tumours and high-grade gliomas) had a shorter PSI compared with slow-growing tumours (e.g. low-grade gliomas and craniopharyngiomas; Table 2). The tumour location was significantly associated with both PSI and parental delay, with supratentorial midline tumours having longer delays than supratentorial hemispheric (e.g. cases presenting monosymptomatically with focal seizures) and infratentorial tumours. During the study period of 25 years, there was a statistically significant decrease in the PSI. This was mainly due to a decrease in the doctor’s delay, which might be explained by the improved availability of non-invasive imaging techniques. At the Children’s Hospital of Zurich, CT was introduced in 1982 and MRI in 1986. The parental delays of the six most frequent brain tumours did not change significantly over time.
Survival probability
The progression-free and overall survival of the 315 patients are summarised in Fig. 2. The estimated 5-year and 10-year OS rates were 73% (95% CI, 68 to 79%) and 71% (66 to 77%), respectively. The estimated 5-year and 10-year PFS rates were 53% (95% CI, 47 to 59%) and 48% (42 to 55%), respectively.
Survival probability according to PSI
Progression-free and overall survival according to PSI are summarised in Fig. 3. In the group with the longest PSI (≥180 days, n=83), the survival probability was the highest (10-year OS 86% and PFS 61%), followed by the group with PSI <20 days (n=66; 10-year OS 71% and PFS 49%), the group with PSI 60–179 days (n=82; 10-year OS 66% and PFS 43%) and the group with PSI 20–59 days (n=84;
10-year OS 61% and PFS 39%). These differences were significant for both OS (P<0.001) and PFS (P=0.029). Survival probability according to doctor’s delay
Progression-free and overall survival according to doctor’s delay are summarised in Fig. 4. The survival probability was highest in the group with the longest doctor’s delay (≥70 days, n=59, 10-year OS 78% and PFS 60%), followed by the group without any doctor’s delay (<1 day, n=57; 10-year OS 67% and PFS 53%), the group with doctor’s delay 14–70 days (n=62; 10-year OS 67% and PFS 40%) and the group with doctor’s delay 1–14 days (n=56; 10-year OS 64% and PFS 49%). However, these differences were not statistically significant (P=0.24 for OS and P=0.64 for PFS).
Survival probability of histological subgroups according to PSI and doctor’s delay
We then grouped the patients according to histology (low-grade glioma [n=77], medulloblastoma [n=57], high-(low-grade
Fig. 2 a, b Estimated survival of 315 paediatric patients with brain tumours. Kaplan-Meier curves show the probability of overall survival (OS, a) and progression-free survival (PFS, b)
glioma [n=40], craniopharyngioma [n=27], ependymoma [n=20] and germ cell tumours [n=18]) and repeated the analyses. Despite the fact that both PSI and doctor’s delay were significantly different between these subgroups (Table 2), shorter PSI or shorter doctor’s delay did not
result in better survival outcome probabilities in any of them (data are shown for the two largest groups, low-grade glioma and medulloblastoma; Table3).
Discussion
Parents frequently tend to blame the primary care doctor for a“delay in the diagnosis” of a brain tumour and questions are raised as to whether an earlier diagnosis could have been made and, if so, whether the “delay” has adversely affected the prognosis. Therefore, in the current study, we tested the hypothesis that paediatric brain tumour patients with a shorter PSI have a better prognosis. Indeed, lay people may think that the child who is diagnosed with a brief history of symptoms/signs is more likely to have a
smaller brain tumour that is easier to resect. The prognostic value of extensive tumour resection, which is controversial with regard to malignant brain tumours in adults, has been confirmed for a variety of childhood brain tumours, including medulloblastoma, supratentorial primitive neuro-ectodermal tumours, ependymoma and astrocytoma [2,15,
17,24,25].
The PSI correlated significantly with the patient age, tumour histology, tumour location and year of diagnosis. This is in accordance with the literature [5, 16, 23]. Age differences in PSI may be attributed to age-related differences in the occurrence of tumour characteristics, such as brain tumour symptoms and tumour location relative to the tentorium, to differences in the tumour biology and to differences in medical care.
Contrary to common belief, the PSI correlated inversely with the progression-free and overall survival probability. Our findings are in accordance with the previously reported results of a smaller group of paediatric brain tumour patients (n=28; [19]) and the results of Halperin et al [11].
Fig. 4 a, b Estimated survival of 234 paediatric brain tumour patients, where medical charts permitted subdividing the PSI into a parental and a doctor’s delay. Kaplan-Meier curves show the probability of OS (a) and PFS (b) in relation to the duration of the Fig. 3 a, b Estimated survival of 315 paediatric patients with brain
tumours in relation to the duration of the PSI. Kaplan-Meier curves show the probability of OS (a) and PFS (b)
Analysing 122 medulloblastoma patients, they found that the PSI correlated inversely with metastatic stage at the time of presentation. Although not tested formally in their study, it can be assumed that patients with longer PSI had not only lower metastatic stages, but also had higher survival probability, because the metastatic stage is probably the most important clinical risk factor in medulloblastoma [1,
7,12,21,25].
This suggests that, often, it is the biology of the disease that is the most important determinant for PSI and survival probability. Some rapidly growing aggressive brain tumours call attention to themselves more readily than slowly growing tumours. Perhaps the more slowly growing tumours allow the patient to adapt to the increase in intracranial pressure and impingement on normal tissue more readily than to a rapidly growing mass [6,10,11].
The doctor’s delay did correlate with tumour histology, but not with the progression-free or overall survival probability. This is also in contrast to common belief and has potential legal implications. Alleged delay in diagnosis is a common plaintiff’s assertion in cancer-related malprac-tice suits. It is a fact that the more aggressive tumours tend
to be diagnosed after a shorter duration of symptoms than less malignant tumours: this makes it difficult to cite the long duration of symptoms, by itself, as a significant factor in support of the argument that,“if only the diagnosis had been made more quickly,” then the patient would have had a better prognosis.
We believe that this study of a large series of children with brain tumours represents the first analysis of the relationships between PSI, doctor’s delay and survival outcome probability. Clearly, this study has limitations. The numbers of patients in each histological category are small, the categories are not homogenous in terms of localisation and biology, and the treatment used over a relatively long period of time has not been uniform. As analysis relied on a retrospective review of medical records, it was not possible to assess the reliability with which the data regarding symptom onset and the division of symptoms into that occurring before and after medical advice was recorded. However, the results do indicate that the age at presentation and histology are determinants for PSI, and that a short PSI is not necessarily related with better survival outcome probability.
Table 3 Survival probabilities (proportion in percentage and 95% confidence interval [CI]) according to PSI and doctor’s delay χ2 =log-rank statistic, 3 degrees of freedom 10-year OS 10-year PFS All tumours (n=315) χ2=16.4, P<0.001 χ2=9.0, P=0.029 - PSI <20 days (n=66) 71 (59–85) 49 (37–64) - PSI 20–59 days (n=84) 61 (50–73) 39 (28–54) - PSI 60–179 days (n=82) 66 (55–80) 43 (32–60) - PSI >180 days (n=83) 86 (78–95) 61 (50–74)
Tumours with known doctor’s delay (n=234) Χ2=4.2, P=0.24 χ2=1.7, P=0.64
- Doctor’s delay <1 day (n=57) 67 (55–81) 53 (41–68)
- Doctor’s delay 1–14 days (n=56) 64 (51–79) 49 (35–67)
- Doctor’s delay 15–70 days (n=62) 67 (53–83) 40 (26–60)
- Doctor’s delay >70 days (n=59) 77 (65–90) 60 (47–75)
Low-grade glioma (n=77) Χ2=2.5, P=0.48 χ2=3.3, P=0.35
- PSI <20 days (n=10) 100 58 (31–100)
- PSI 20–59 days (n=13) 92 (79–100) 92 (79–100)
- PSI 60–179 days (n=26) 76 (52–100) 50 (27–92)
- PSI >180 days (n=28) 94 (83–100) 63 (45–88)
Low-grade glioma with known doctor’s delay (n=58) Χ2=2.4, P=0.50 χ2=0.6, P=0.90
- Doctor’s delay <1 day (n=14) 100 76 (56–100)
- Doctor’s delay 1–14 days (n=9) 100 83 (58–100)
- Doctor’s delay 15–70 days (n=15) 74 (46–100) 53 (25–100)
- Doctor’s delay >70 days (n=20) 82 (60–100) 70 (52–94)
Medulloblastoma (n=57) Χ2=1.1, P=0.77 χ2=1.0, P=0.79
- PSI <20 days (n=12) 75 (54–100) 56 (34–94)
- PSI 20–59 days (n=27) 56 (40–80) 33 (19–59)
- PSI 60–179 days (n=14) 54 (33–90) 24 (5–100)
- PSI >180 days (n=4) 50 (19–100) 25 (5–100)
Medulloblastoma with known doctor’s delay (n=49) Χ2=1.8, P=0.60 χ2=1.3, P=0.72
- Doctor’s delay <1 day (n=16) 60 (39–91) 38 (19–75)
- Doctor’s delay 1–14 days (n=13) 39 (18–85) 23 (8–71)
- Doctor’s delay 15–70 days (n=15) 57 (36–91) 31 (12–81)
Instead of analysing the age at diagnosis, PSI and the doctor’s delay by Spearman’s correlation, we deliberately chose a method of analysis based on quartile grouping, since, primarily, it cannot be assumed that the association of delay with outcome is a linear one. As Figs.2(for PSI) and
4 (for doctor’s delay) demonstrate for the whole set of patients, as does Table3for some important subgroups, this assumption would clearly have been wrong. Since there is no linear association between delay and outcome, we deliberately chose to perform log-rank tests of outcomes between subgroups of patients instead of performing Cox regression analysis.
Future studies are needed that prospectively analyse more homogeneous (histological and therapeutic) groups of brain tumour patients. It still remains to be tested whether long delays in diagnosis are associated with higher risks of perioperative morbidity and, therefore, reduced quality of life. Whilst a child might still survive with a brain tumour diagnosed over a prolonged symptom interval, there may be considerable impairment of cognitive function due to prolonged hydrocephalus or other tumour-related brain damage.
Independent of current and future study results, early diagnosis remains a high priority. Patients with biologically aggressive tumours are likely to profit from an early start of anti-neoplastic therapy, and patients with slow growing tumours might be salvaged from irreparable functional deficits. Furthermore, a prolonged diagnostic delay is associated with the high burden of uncertainty for the families involved.
Acknowledgements We thank Dr. Regula Angst, Department of Oncology, Children’s Hospital of Aarau; Dr. Ueli Caflisch, Department of Oncology, Children’s Hospital of Luzern; Dr. Heinz Hengartner, Department of Oncology, Children’s Hospital of St. Gallen; and Dr. Luisa Nobile, Department of Oncology, Hospital La Carità, Locarno, Switzerland, for providing follow-up information on the patients.
References
1. Albright AL, Wisoff JH, Zeltzer PM, Boyett JM, Rorke LB, Stanley P (1996) Effects of medulloblastoma resections on outcome in children: a report from the Children’s Cancer Group. Neurosurgery 38:265–271
2. Cohen BH, Zeltzer PM, Boyett JM, Geyer JR, Allen JC, Finlay JL, McGuire-Cullen P, Milstein JM, Rorke LB, Stanley P, Stehbens JA, Shurin SB, Wisoff J, Stevens KR, Albright AL (1995) Prognostic factors and treatment results for supratentorial primitive neuroectodermal tumors in children using radiation and chemotherapy: a Children’s Cancer Group randomized trial. J Clin Oncol 13:1687–1696
3. Dobrovoljac M, Hengartner H, Boltshauser E, Grotzer MA (2002) Delay in the diagnosis of paediatric brain tumours. Eur J Pediatr 161:663–667
4. Edgeworth J, Bullock P, Bailey A, Gallagher A, Crouchman M (1996) Why are brain tumours still being missed? Arch Dis Child 74:148–151
5. Flores LE, Williams DL, Bell BA, O’Brien M, Ragab AH (1986) Delay in the diagnosis of pediatric brain tumors. Am J Dis Child 140:684–686
6. Freeman CR, Krischer JP, Sanford RA, Cohen ME, Burger PC, del Carpio R, Halperin EC, Munoz L, Friedman HS, Kun LE (1993) Final results of a study of escalating doses of hyper-fractionated radiotherapy in brain stem tumors in children: a Pediatric Oncology Group study. Int J Radiat Oncol Biol Phys 27:197–206
7. Garton GR, Schomberg PJ, Scheithauer BW, Shaw EG, Ilstrup DM, Blackwell CR, Laws ER Jr, Earle JD (1990) Medullo-blastoma—prognostic factors and outcome of treatment: review of the Mayo Clinic experience. Mayo Clinic Proc 65:1077–1086
8. Gjerris F (1976) Clinical aspects and long-term prognosis of intracranial tumours in infancy and childhood. Dev Med Child Neurol 18:145–159
9. Gurney JG, Smith MA, Bunin GR (2000) CNS and miscellaneous intracranial and intraspinal neoplasms. SEER Pediatric Mono-graph. National Cancer Institute, 2000, pp 51–63. Available online at:http://seer.cancer.gov/publications/childhood/cns.pdf, 10. Halperin EC, Friedman HS (1996) Is there a correlation between
duration of presenting symptoms and stage of medulloblastoma at the time of diagnosis? Cancer 78:874–880
11. Halperin EC, Watson DM, George SL (2001) Duration of symptoms prior to diagnosis is related inversely to presenting disease stage in children with medulloblastoma. Cancer 91:1444– 1450
12. Kopelson G, Linggood RM, Kleinman GM (1983) Medulloblastoma. The identification of prognostic subgroups and implications for multimodality management. Cancer 51:312–319
13. Mehta V, Chapman A, McNeely PD, Walling S, Howes MJ (2002) Latency between symptom onset and diagnosis of pediatric brain tumors: an Eastern Canadian geographic study. Neurosurgery 51:365–372
14. Pollack IF (1994) Brain tumors in children. N Engl J Med 331:1500–1507
15. Pollack IF (1999) Pediatric brain tumors. Semin Surg Oncol 16:73–90
16. Pollock BH, Krischer JP, Vietti TJ (1991) Interval between symptom onset and diagnosis of pediatric solid tumors. J Pediatr 119:725–732
17. Pollack IF, Gerszten PC, Martinez AJ, Lo KH, Shultz B, Albright AL, Janosky J, Deutsch M (1995) Intracranial ependymomas of childhood: long-term outcome and prognostic factors. Neurosurgery 37:655–666
18. Reulecke BC, Erker CG, Fiedler BJ, Niederstadt TU, Kurlemann G (2008) Brain tumors in children: initial symptoms and their influence on the time span between symptom onset and diagnosis. J Child Neurol 23:178–183
19. Saha V, Love S, Eden T, Micallef-Eynaud P, MacKinlay G (1993) Determinants of symptom interval in childhood cancer. Arch Dis Child 68:771–774
20. Strother DR, Pollack IF, Fisher PG, Hunter JV, Woo SY, Pomeroy SL, Rorke LB (2002) Tumors of the central nervous system. In: Pizzo PA, Poplack DG (eds) Principles and practice of pediatric oncology, 4th edn. Lippincott-Raven, Philadelphia, pp 751–824
21. Tait DM, Thornton-Jones H, Bloom HJ, Lemerle J, Morris-Jones P (1990) Adjuvant chemotherapy for medulloblastoma: the first multi-centre control trial of the International Society of Paediatric Oncology (SIOP I). Eur J Cancer 26:464– 469
22. Wilne SH, Ferris RC, Nathwani A, Kennedy CR (2006) The presenting features of brain tumours: a review of 200 cases. Arch Dis Child 91:502–506
23. Wilne S, Collier J, Kennedy C, Koller K, Grundy R, Walker D (2007) Presentation of childhood CNS tumours: a systematic review and meta-analysis. Lancet Oncol 8:685–695
24. Wisoff JH, Boyett JM, Berger MS, Brant C, Li H, Yates AJ, McGuire-Cullen P, Turski PA, Sutton LN, Allen JC, Packer RJ, Finlay JL (1998) Current neurosurgical management and the impact of the extent of resection in the treatment of
malignant gliomas of childhood: a report of the Children’s Cancer Group trial no. CCG-945. J Neurosurg 89:52– 59
25. Zeltzer PM, Boyett JM, Finlay JL, Albright AL, Rorke LB, Milstein JM, Allen JC, Stevens KR, Stanley P, Li H, Wisoff JH, Geyer JR, McGuire-Cullen P, Stehbens JA, Shurin SB, Packer RJ (1999) Metastasis stage, adjuvant treatment, and residual tumor are prognostic factors for medulloblastoma in children: conclusions from the Children’s Cancer Group 921 randomized phase III study. J Clin Oncol 17:832–845
![Table 2 Prediagnostic symptomatic interval (PSI), parental delay and doctor ’ s delay (median and interquartile range [IQR]) in relation to age at diagnosis, gender, histology, tumour location and year of diagnosis](https://thumb-eu.123doks.com/thumbv2/123doknet/14864508.636754/3.892.88.818.583.1038/prediagnostic-symptomatic-interval-parental-interquartile-diagnosis-histology-diagnosis.webp)

![Table 3 Survival probabilities (proportion in percentage and 95% confidence interval [CI]) according to PSI and doctor’s delay χ 2 =log-rank statistic, 3 degrees of freedom 10-year OS 10-year PFSAll tumours(n=315)χ2=16.4,P<0.001χ2=9.0, P=0.029- PSI <](https://thumb-eu.123doks.com/thumbv2/123doknet/14864508.636754/6.892.264.812.84.622/survival-probabilities-proportion-percentage-confidence-interval-according-statistic.webp)