RESEARCH ARTICLE
Evidence for the Necessity to Systematically Assess
Micronutrient Status Prior to Bariatric Surgery
Barbara Ernst&Martin Thurnheer&
Sebastian M. Schmid&Bernd Schultes
Received: 26 February 2008 / Accepted: 16 April 2008 / Published online: 20 May 2008 # Springer Science + Business Media, LLC 2008
Abstract
Background Bariatric surgery has been proven the most effective treatment of morbid obesity, but micronutrient deficiency following bariatric surgery is a major concern. Increasing evidence points to a generally poor micronutri-ent status in obese subjects.
Methods We assessed micronutrient status in 232 morbidly
obese subjects (BMI≥35 kg/m2) prior to bariatric surgery.
Serum albumin, calcium, phosphate, magnesium, ferritin, hemoglobin, zinc, folate, vitamin B12, 25-OH vitamin D3, and intact parathormone (iPTH) were determined. In a sub-sample of 89 subjects, we additionally assessed copper, selenium, vitamin B1, B3, B6, A, and E levels.
Results Deficiencies were found in 12.5% of the subjects for albumin, 8.0% for phosphate, 4.7% for magnesium, 6.9% for ferritin, 6.9% for hemoglobin, 24.6% for zinc, 3.4% for folate, and 18.1% for vitamin B12. In addition, 25.4%
showed a severe 25-OH vitamin D3 deficiency, which was
accompanied by a secondary hyperparathyroidism in 36.6% cases. Prevalence of albumin deficiency ( p<0.007) and of anemia ( p<0.003; in women only) significantly increased with BMI. Of note, 48.7% of the subjects showed at least one of the most prevalent deficiencies, i.e., vitamin B12,
zinc and severe 25-OH vitamin D3deficiency. In the
sub-sample, 32.6% showed a selenium, 5.6% a vitamin B3, 2.2% a vitamin B6, and 2.2% a vitamin E deficiency. Copper, vitamin B1, and vitamin A deficiency was found in none of the subjects.
Conclusion Data indicate a high prevalence of micronutri-ent deficiencies in morbidly obese subjects. Based on these results, we strongly recommend a systematic assessment of the micronutrient status in all candidates for bariatric surgery.
Keywords Morbid obesity . Micronutrient deficiencies . Preoperative assessment
Introduction
Bariatric surgery has been proven the most effective treatment of morbid obesity leading not only to a
long-term weight reduction [1, 2] but also to a significant
improvement of health-related quality of life [3] and a
reduction of overall mortality [4,5]. However,
micronutri-ent deficiency after bariatric procedures is a major concern
[6, 7], which may prevent a physician recommending
morbid obese patients for this effective treatment.
Positive energy balance deriving from excessive food intake in relation to energy expenditure is the pathophys-iological basis of obesity in most cases, but the quality of
ingested foods might be poor [8]. Here, the question arises
as to whether in obese subjects micronutrient supply from consumed foods is sufficient to cover their organism’s demands. Surprisingly, a quite low number of studies, most
of which are summarized in Table1, have been carried out
to address this question. Data from the NHANES III including 3,831 obese subjects indicated a higher likelihood
The authors have no commercial interest to disclose. The study was financially supported by a grant from Johnson & Johnson. The funder had no role in the study design, analysis and publication of the data. B. Ernst
:
M. Thurnheer:
B. Schultes (*)Interdisciplinary Obesity Center, Kantonsspital St. Gallen, CH-9400 Rorschach, Switzerland
e-mail: [email protected] S. M. Schmid
:
B. SchultesDepartment of Internal Medicine I, University of Luebeck, 23538 Luebeck, Germany
T able 1 Published studies providing data on at least two nutritional components, including more than 50 obese subjects without previous bariatric sur gery Reference Study population Deficiencies (%) No. patients Sex BMI kg/m 2 Country Albumin Ferritin Hemoglobin Zinc Selenium V itamin B1 Folate V itamin B12 V itamin A V itamin E 25-OH-D 3 Kimmons et al. [ 9 ] 16191 (obese: 3831) Premenopausal: 1320 ≥ 30 USA –– – – 6.1 – 31.6 17.0 1.7 25.8 19.0 Postmenopausal: 1267 –– – – 3.8 – 14.3 15.6 1.2 26.8 18.3 m: 1244 –– – – 2.8 – 25.2 14.2 0.4 21.2 7.2 Madan et al. [ 29 ] 100 – ≥ 35 USA – 6.0 – 28.0 58.0 – 2.0 5.0 7.0 – 40.0 Skroubis et al. [ 30 ] Morbidly obese: 79 (BMI < 5 0 kg/m 2 ) m: 15, f: 64 45.6 ± 4.9 (mean ± SD) Greece 0 8.3 –– – – – 16.4 –– – super obese: 95 (BMI > 5 0 kg/m 2 ) m: 24, f: 71 57.2 ± 6.1 (mean ± SD) – 3.2 –– – – – 6.5 –– – Brolin et al. [ 31 ] 56 Female weight: 89 –189 kg USA –– 21.4 –– – 14.3 8.9 –– – Flancbaum et al. [ 32 ] 379 m: 59, f: 320 51.8 ± 10.6 (mean ± SD) USA 0 8.4 22.0 –– 29.0 – 0 –– 68.1 Kimmons et al. [ 9 ] cut-off values: ≤ 1.05 μ mol/l for vitamin A; ≤ 36 nmol/l for 25-OH vitamin D3; ≤ 220.6 pmol/l for vitamin B12 ; < 6.8 nmol/l for serum folate; < 1.3 μ mol/l for selenium. Madan et al. [ 33 ] did not provide cut-of f values. Skroubis et al. [ 34 ] cut-of f values: < 147.6 pmol/l for vitamin B12 ; < 16.4 pmol/l for ferritin. Brolin et al. [ 35 ] cut-of f values: < 154.9 pmol/l for vitamin B12 ; < 9.1 nmol/l for folate. Flancbaum et al. [ 32 ] did not provide cut-of f values.
of deficiencies in multiple micronutrient components in
subjects with a BMI above 30 kg/m2 as compared with
normal-weight subjects [9]. However, data from that study
do not clarify the question whether the likelihood of micronutrient deficiencies increases with the severity of obesity, i.e., with increasing BMI classes. Also, the majority of studies focusing on morbid obesity (BMI≥
35 kg/m2) only assessed a limited number of micronutrient
components prior to bariatric procedures. For instance, concentrations of vitamin B3, B6, and copper, deficiencies of which have in part been attributed to bariatric operations
[10–22], have not yet been systematically studied in
candidates for bariatric surgery prior to the operation. From the clinical point of view, knowing the prevalence of micronutrient deficiencies in morbidly obese patients appears to be of utmost importance. Otherwise, deficiencies detected after bariatric surgery cannot unequivocally be attributed to the surgical intervention. Here, we report results of a comprehensive micronutrient assessment in 232
morbidly obese subjects (BMI≥35 kg/m2) who were
evaluated for bariatric surgery in our Interdisciplinary Obesity Center.
Methods
In this prospective study, we assessed a comprehensive
micronutrient status in all patients with a BMI of 35 kg/m2
or higher who were referred by their general practitioner or by themselves to our Interdisciplinary Obesity Center for evaluation for bariatric surgery between November 2005 and December 2007. Patients who had undergone a bariatric procedure, e.g., gastric banding, prior to the pre-sent assessment were excluded from the study. Also, patients with overt renal function impairment (serum
creatinine concentration >120μmol/l for men, >100 μmol/l
for women) were excluded from the study, since impaired renal function is well known to significantly affect vitamin D metabolism and thereby, PTH levels and calcium homeo-stasis. All the patients underwent an extensive endocrino-logical examination in order to detect endocrine disorders potentially responsible for their obesity, e.g., untreated hypothyroidism. However, such an endocrine disorder was detected in none of the subjects. The final sample included 232 patients. Informed consent was obtained from all the patients.
Height and weight were measured with patients wearing light clothing but no shoes. BMI was defined as weight (kg)
divided by height squared (m2). In all the patients, blood
samples were drawn in the morning (8:00–11:00) after an
overnight fast. Micronutrient deficiency was defined as
follows: serum albumin <536.0 μmol/l, serum calcium
<2.0 mmol/l, serum phosphate <0.8 mmol/l, serum
magne-sium <0.7 mmol/l, serum ferritin <18.0 pmol/l, hemoglobin <8.7 mmol/l for men and <7.5 mmol/l for women, serum
zinc <11.0 μmol/l, serum copper <13.0 μmol/l, serum
selenium <0.9 μmol/l, serum vitamin B1 <933.0 nmol/l,
serum vitamin B3 <65.0 μmol/l, serum vitamin B6 <33.2
nmol/l, serum folate <4.5 nmol/l, serum vitamin B12<133.0
pmol/l, serum vitamin A <0.7 μmol/l, serum vitamin E
<12.0μmol/l, serum 25-OH vitamin D3<76.0 nmol/l (mild
deficiency), <50.0 nmol/l (moderate deficiency), and <25.0 nmol/l (severe deficiency). Serum iPTH >6.5 pmol/l indi-cated hyperparathyroidism.
Serum copper, selenium, vitamin B1, B3, B6, A, and E were only assessed in a sub-sample of 89 patients. In all
patients with vitamin B12 deficiency, antibodies against
parietal cells were measured to exclude atrophic gastritis. However, increased antibody titers could not be detected in any of the subjects tested.
Data were analyzed by using SPSS 12.1 for Windows (SPSS, Chicago, IL, USA). To assess the influence of the degree of obesity, the subjects were grouped according to
their BMI in four groups, i.e., BMI 35– < 40 kg/m2, BMI
40– < 45 kg/m2, BMI 45– < 50 kg/m2and BMI>50 kg/m2.
Unless otherwise indicated, data are reported as mean±SD. Variables were compared between different BMI groups by
χ2
test for discrete variables and ANOVA for continuous
variables. For pairwise comparisons, Student’s t test or χ2
test was used. Associations between micronutrient levels
and BMI were evaluated by Pearson’s correlation
coeffi-cient. A p value < 0.05 was considered significant.
Results
The clinical characteristics of the study population are
presented in Table2. There were no significant differences
in age and height across the four different BMI groups. Interestingly, the number of evaluated men was higher in
the BMI>40 kg/m2 groups than in the BMI 35–40 kg/m2
group (all p<0.05 for pairwise comparisons).
Table3provides data on micronutrients measured in the
entire study population. Overall, below cut-off levels, i.e., deficiencies, were found in 12.5% of the subjects for albumin, 8.0% for phosphate, 4.7% for magnesium, 6.9% for ferritin, 6.9% for hemoglobin (<8.7 mmol/l in men and <7.5 mmol/l in women), 24.6% for zinc, 3.4% for folate, 18.1% for vitamin B12, and 89.7% for 25-OH vitamin D3 (<76 nmol/l). In addition, 61.2% of the patients not only showed a mild but a moderate (<50 nmol/l) and 25.4% even
a severe (<25 nmol/l) 25-OH vitamin D3 deficiency.
According to the high prevalence of 25-OH vitamin D3 deficiency, 36.6% of the patients showed a secondary hyperparathyroidism with iPTH levels above 6.5 pmol/l. A primary hyperparathyroidism could be excluded in all the
patients since none of them showed an increased serum calcium level.
Analyzing data separately for BMI categories revealed a significant difference in the prevalence of albumin defi-ciency ( p=0.007) and hemoglobin defidefi-ciency ( p=0.003; in women) between groups with higher rates of deficiencies with increasing BMI.
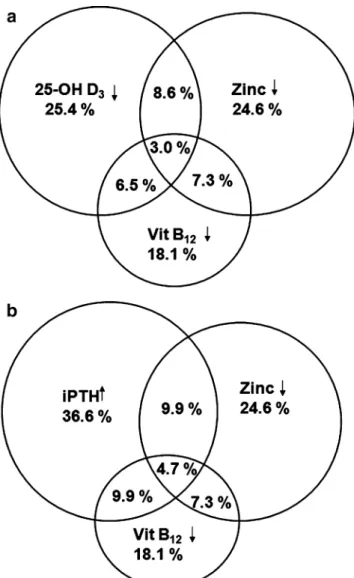
Figure 1 illustrates the distribution of the three most
prevalent deficiencies, i.e., 25-OH vitamin D3(<25 nmol/l),
vitamin B12, and zinc deficiencies. Subnormal serum values of at least one parameter were found in 48.7% of the
patients (Fig. 1a). When elevated iPTH levels instead of
25-OH vitamin D3(<25 nmol/l) were used as an indicator
of 25-OH vitamin D3 deficiency, the number of patients
Table 2 Clinical characteristics of the study population
Total (n=232) BMI (kg/m2) P (trend)
35– < 40 (n=47) 40– < 45 (n=87) 45– < 50 (n=56) >50 (n=42) Women (%) 71.1 85.1 67.8* 67.9* 66.7* 0.131 Age (y) 40.5±11.6 40.0±11.3 38.9±11.3 42.0±11.3 42.1±12.8 0.344 Height (cm) 166.2±8.7 166.0±7.3 166.6±8.8 166.3±9.2 165.7±9.3 0.952 Weight (kg) 124.3±20.7 104.5±9.1 117.5±13.1 131.6±14.8 150.9±18.1 <0.001 BMI (kg/m2) 44.9±6.2 37.9±1.4 42.2±1.4 47.5±1.5 54.9±4.6 <0.001
Data are the mean±SD, or percentage. P values derive fromχ2 test or ANOVA as appropriate. *P<0.05 vs. BMI group 35– < 40 by χ2
test.
Table 3 Absolute values and rates of prevalence of deficiency in micronutrients
Total (n=232) BMI P (trend)
35– < 40 (n=47) 40– < 45 (n=87) 45– < 50 (n=56) > 50 (n=42) Absolute values
Albumin (μmol/l) 612.9±65.2 637.6±66.7 626.0±66.7 597.0±46.4 581.0±66.7 <0.001
Total calcium (mmol/l) 2.3±0.1 2.3±0.1 2.3±0.1 2.2±0.1 2.2±0.1 0.045
Phosphate (mmol/l)a 1.0±0.2 1.0±0.2 1.0±0.2 1.0±0.2 1.0±0.2 0.993 Magnesium (mmol/l)b 0.9±0.1 0.9±0.9 0.9±0.1 0.9±0.2 0.8±0.1 0.708 Ferritin (pmol/l) 165.2±163.8 132.5±122.0 171.1±169.4 200.5±193.4 142.4±143.1 0.145 Hemoglobin (mmol/l) 8.9±0.9 8.9±0.8 9.1±0.7 8.8±0.9 8.7± 1.1 0.123 Zinc (μmol/l) 12.2±1.8 12.3±1.6 12.4±1.9 12.2±1.6 11.9±1.8 0.458 Folate (nmol/l) 13.1±8.4 11.3±4.8 13.6±8.6 14.7±11.3 12.0±6.8 0.170 Vitamin B12(pmol/l) 202.2±81.9 192.6±73.1 206.5±78.4 218.0±94.4 182.5±78.1 0.144 25-OH-D3 (nmol/l) 47.0±36.4 50.3±28.2 51.1±49.3 44.5±24.5 38.2±23.1 0.241 IPTH (pmol/l) 6.2±2.9 5.4±2.1 5.9±2.5 6.7±3.9 6.9±2.8 0.046 Deficiencies (%) Albumin <536.0μmol/l 12.5 8.5 9.2 8.9 28.6 0.007 Phosphate <0.8 mmol/la 8.0 12.8 7.2 5.5 7.7 0.573 Magnesium <0.7 mmol/lb 4.7 4.5 0 10.0 7.5 0.052 Ferritin <18.0 pmol/l 6.9 10.6 4.6 5.4 9.5 0.494 Hemoglobin <8.7 mmol/lc 10.1 15.4 3.0 17.4 10.0 0.313 Hemoglobin <7.5 mmol/ld 5.9 2.0 1.4 8.0 18.8 0.003 Zinc <11.0μmol/l 24.6 25.5 23.0 17.9 35.7 0.229 Folate <4.5 nmol/l 3.4 0 3.4 5.4 4.8 0.474 Vitamin B12<133.0 pmol/l 18.1 17.0 16.1 16.1 26.2 0.516 25-OH-D <76.0 nmol/l 89.7 85.1 89.7 89.3 95.2 0.481 25-OH-D <50.0 nmol/l 61.2 53.2 58.6 60.7 76.2 0.139 25-OH-D <25.0 nmol/l 25.4 23.4 20.7 26.8 35.7 0.317 IPTH>6.5 pmol/l 36.6 25.5 36.8 42.9 40.5 0.296
Data are the mean±SD, or percentage. P values derive fromχ2 test or ANOVA as appropriate. aMeasured in 224 patients. b Measured in 213 patients. c For men. d For women.
showing at least one alteration in the three parameters was
even higher reaching 56.9% (Fig. 1b). There was no
significant difference in these prevalences across the four BMI groups ( p=0.390 for the analysis including 25-OH
vitamin D3and p=0.801 for analysis including iPTH).
Looking at absolute values, there was a clear-cut de-crease in albumin levels with increasing BMI ( p<0.001). Total calcium levels were also reduced in the higher as compared to the lower BMI groups ( p=0.045), but this difference between groups disappeared when calcium levels were corrected for albumin levels ( p=0.113). Also, ferritin,
hemoglobin, vitamin B12, and 25-OH vitamin D3 levels
appeared to decrease with increasing BMI but differences across BMI groups did not reach significance (all p > 0.14). However, iPTH levels clearly increase with BMI ( p = 0.046) and correlation analysis confirmed the positive association between iPTH levels and BMI ( r = 0.191; p = 0.004).
Comparison of data between men and women (Table4)
revealed that, as expected, men were significantly taller and heavier than women (both p<0.001), but age and BMI was similar in both sexes (both p>0.34). Women displayed significant lower albumin ( P=0.001), ferritin ( p<0.001), hemoglobin ( p<0.001), and zinc ( p=0.003) concentrations than men. Also, prevalence of ferritin deficiency was higher in women than in men ( p<0.038).
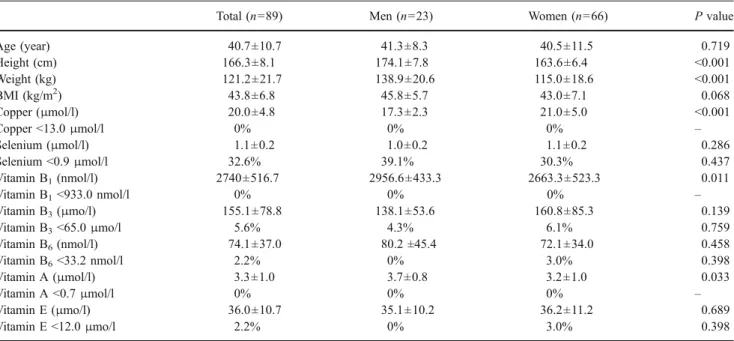
Table 5 provides data on serum copper, selenium,
vitamin B1, vitamin B3, vitamin B6, vitamin A, and vitamin E levels measured in a subgroup of 89 subjects. Here, 32.6% of the subjects showed a selenium deficiency, 5.6%
a vitamin B3deficiency, 2.2% a vitamin B6deficiency, and
2.2% a vitamin E deficiency, while below cut-off levels were not found for copper, vitamin B1, and vitamin A in
any of the subjects. Mean values for vitamin B1( p=0.011)
and vitamin A (p =0.033) were significantly lower in women than in men, while that of copper were significantly higher in women ( p<0.001).
Discussion
Present data indicate a high prevalence (>10%) of albumin,
zinc, selenium, vitamin B12, and 25-OH vitamin D3
defi-ciency as well as elevated iPTH levels in morbidly obese
patients (BMI≥35 kg/m2
). In addition, moderate rates of de-ficiencies (prevalence 5 to 10%) were found for phosphate, ferritin, hemoglobin, and vitamin B3, and low prevalence rates (<5%) of deficiencies were found for magnesium, vitamin B6, folate, and vitamin E levels. None of our patients showed deficiencies in serum levels of copper, vitamin B1, and vitamin A. Rates of albumin deficiency and anemia (in women only) increased with BMI as did absolute iPTH levels. However, even a substantial number of the patients
within the lowest BMI group (35–40 kg/m2
) displayed a micronutrient deficiency that should not be neglected.
Beside its obvious clinical significance in regard of the management of bariatric candidates, the present finding of a high prevalence rate of deficiency in distinct micronutrient components may also provide broader implications. Here, it is tempting to speculate that at least some of the found micronutrient deficiencies contribute to the well-known health impairing effects of obesity. For instance, vitamin D deficiency has been found to be associated with an increased risk for diabetes, cardiovascular diseases, and
several types of cancer [23, 24]. Also, zinc deficiency is
currently suggested to critically promote acute and chronic
liver diseases [25] as well as the development of several
types of cancer [26, 27]. To sum up, the high rate of
micronutrient deficiencies found here strongly calls for further investigations assessing its potential contribution to the genesis of diseases being associated with obesity.
Fig. 1 Relationship between zinc, vitamin B12, and 25-OH vitamin
D3deficiency (a) and between zinc deficiency, vitamin B12deficiency,
Table 4 Comparison of absolute values of and deficiencies in micronutrients between men and women
Men (n=67) Women (n=165) P value
Age (year) 41.4±11.4 40.1±11.7 0.436 Height (cm) 174.6±7.3 162.8±6.7 <0.001 Weight (kg) 138.8±19.6 118.5±18.2 <0.001 BMI (kg/m2) 45.5±5.3 44.7±6.5 0.342 Albumin (μmol/l) 634.7±66.7 604.2±62.3 0.001 Albumin <536.0μmol/l 6.0% 25.0% 0.055 Phosphate (mmol/l)a 1.0±0.2 1.0±0.2 0.666 Phosphate <0.8 mmol/la 10.8% 6.9% 0.336 Magnesium (mmol/l)b 0.9±0.2 0.9±0.1 0.152 Magnesium <0.7 mmol/lb 4.9% 4.6% 0.922 Ferritin (pmol/l) 310.5±204.0 106.2±94.4 <0.001 Ferritin <18.0 pmol/l 1.5% 9.1% 0.038 Hemoglobin (mmol/l) 9.6±0.9 8.6± 0.7 <0.001
Hemoglobin <8.7 mmol/l, <7.5 mmol/lc 10.1 5.9 0.140
Zinc (μmol/l) 12.8±2.0 12.0±1.7 0.003 Zinc <11.0μmol/l 20.9% 26.1% 0.408 Folate (nmol/l) 12.9±7.0 13.1±9.1 0.893 Folate <4.5 nmol/l 4.5% 3.0% 0.584 Vitamin B12(pmol/l) 212.8±81.1 197.8±82.1 0.205 Vitamin B12<133.0 pmol/l 14.9% 19.4% 0.423 25-OH-D3(nmol/l) 44.3±25.2 48.1±40.1 0.391 25-OH-D3<76.0 nmol/l 88.1% 90.3% 0.611 25-OH-D3<50.0 nmol/l 62.7% 60.6% 0.768 25-OH-D3<25.0 nmol/l 28.4% 24.2% 0.514 iPTH (pmol/l) 6.1±2.3 6.3±3.2 0.514 iPTH>6.5 pmol/l 35.8% 37.0% 0.869
Data are the mean±SD, or percentage. P values derive fromχ2 or unpaired Student’s t test as appropriate.
a
Measured in 224 patients.
bMeasured in 213 patients.
cHemoglobin <8.7 mmol/l for men and <7.5 mmol/l for women.
Table 5 Absolute values and prevalence of deficiency in micronutrients measured only in a sub-sample of the study population
Total (n=89) Men (n=23) Women (n=66) P value
Age (year) 40.7±10.7 41.3±8.3 40.5±11.5 0.719 Height (cm) 166.3±8.1 174.1±7.8 163.6±6.4 <0.001 Weight (kg) 121.2±21.7 138.9±20.6 115.0±18.6 <0.001 BMI (kg/m2) 43.8±6.8 45.8±5.7 43.0±7.1 0.068 Copper (μmol/l) 20.0±4.8 17.3±2.3 21.0±5.0 <0.001 Copper <13.0μmol/l 0% 0% 0% – Selenium (μmol/l) 1.1±0.2 1.0±0.2 1.1±0.2 0.286 Selenium <0.9μmol/l 32.6% 39.1% 30.3% 0.437 Vitamin B1(nmol/l) 2740±516.7 2956.6±433.3 2663.3±523.3 0.011 Vitamin B1<933.0 nmol/l 0% 0% 0% – Vitamin B3(μmo/l) 155.1±78.8 138.1±53.6 160.8±85.3 0.139 Vitamin B3<65.0μmo/l 5.6% 4.3% 6.1% 0.759 Vitamin B6(nmol/l) 74.1±37.0 80.2 ±45.4 72.1±34.0 0.458 Vitamin B6<33.2 nmol/l 2.2% 0% 3.0% 0.398 Vitamin A (μmol/l) 3.3±1.0 3.7±0.8 3.2±1.0 0.033 Vitamin A <0.7μmol/l 0% 0% 0% – Vitamin E (μmo/l) 36.0±10.7 35.1±10.2 36.2±11.2 0.689 Vitamin E <12.0μmo/l 2.2% 0% 3.0% 0.398
Several limitations of our study need to be pointed out. First, our study population was recruited from patients referred to our Interdisciplinary Obesity Center for obesity treatment. Therefore, results obtained here should not be generalized to a population-based level. Second, deficiency in micronutrient components may depend on cultural and geographical factors, and thus, our findings cannot be generalized to other cultures and geographical regions. For
instance, vitamin D3 production within the skin largely
depends on the amount of sunlight exposure, making
vitamin D3 deficiency more likely to occur in countries
with rare sunshine or cultural limitations to expose large areas of uncovered skin to the sun. Also, the high number of selenium deficiencies found in our study most likely results from the fact that in the region of the Alps, soils
were washed out during the glacial period [28]. Lastly,
since we did not systematically assess micronutrient intake in the present study, it remains unclear whether the observed micronutrient deficiencies result from an inade-quate intake by nutritional habits or other factors that have not been assessed here.
In conclusion, the present results clearly point to a rather high prevalence of micronutrient deficiencies in morbidly obese patients seeking obesity treatment. Although the clinical significance of most of these deficiencies remains to be established, based on the present data, we strongly recommend performing a systematically assessment of micronutrient status including at a minimum the determi-nation of albumin, phosphate, ferritin, zinc, selenium,
vitamin B12, 25-OH vitamin D3, iPTH, and vitamin B3in
candidates for bariatric surgery. Without such an assess-ment, it will be impossible to straightforwardly attribute micronutrient deficiencies that are detected after the operation to the bariatric procedure per se. Also, it can be assumed that starting a supplementation in regard of detected deficiencies prior to the bariatric operations yields beneficial effects.
References
1. Buchwald H, Avidor Y, Braunwald E, et al. Bariatric surgery: a systematic review and meta-analysis. JAMA. 2004;292:1724–37. 2. Maggard MA, Shugarman LR, Suttorp M, et al. Meta-analysis: surgical treatment of obesity. Ann Intern Med. 2005;142:547–59. 3. Karlsson J, Taft C, Ryden A, Sjostrom L, Sullivan M. Ten-year trends in health-related quality of life after surgical and conven-tional treatment for severe obesity: the SOS intervention study. Int J Obes (Lond). 2007;31:1248–61.
4. Sjostrom L, Narbro K, Sjostrom CD, et al. Effects of bariatric surgery on mortality in Swedish obese subjects. N Engl J Med. 2007;357:741–52.
5. Adams TD, Gress RE, Smith SC, et al. Long-term mortality after gastric bypass surgery. N Engl J Med. 2007;357:753–61.
6. Fujioka K. Follow-up of nutritional and metabolic problems after bariatric surgery. Diabetes Care. 2005;28:481–4.
7. Malinowski SS. Nutritional and metabolic complications of bariatric surgery. Am J Med Sci. 2006;331:219–25.
8. Westerterp-Plantenga MS, Wijckmans-Duijsens NE, Verboeket-van de Venne WP, de GK, Verboeket-van het Hof KH, Weststrate JA. Energy intake and body weight effects of six months reduced or full fat diets, as a function of dietary restraint. Int J Obes Relat Metab Disord. 1998;22:14–22.
9. Kimmons JE, Blanck HM, Tohill BC, Zhang J, Khan LK. Associations between body mass index and the prevalence of low micronutrient levels among US adults. MedGenMed. 2006;8:59.
10. Juhasz-Pocsine K, Rudnicki SA, Archer RL, Harik SI. Neurologic complications of gastric bypass surgery for morbid obesity. Neurology. 2007;68:1843–50.
11. Angstadt JD, Bodziner RA. Peripheral polyneuropathy from thiamine deficiency following laparoscopic Roux-en-Y gastric bypass. Obes Surg. 2005;15:890–2.
12. Chaves LC, Faintuch J, Kahwage S, Alencar FA. A cluster of polyneuropathy and Wernicke-Korsakoff syndrome in a bariatric unit. Obes Surg. 2002;12:328–34.
13. Bloomberg RD, Fleishman A, Nalle JE, Herron DM, Kini S. Nutritional deficiencies following bariatric surgery: what have we learned? Obes Surg. 2005;15:145–54.
14. Boylan LM, Sugerman HJ, Driskell JA. Vitamin E, vitamin B-6, vitamin B-12, and folate status of gastric bypass surgery patients. J Am Diet Assoc. 1988;88:579–85.
15. Turkki PR, Ingerman L, Schroeder LA, Chung RS, Chen M, Dearlove J. Plasma pyridoxal phosphate as indicator of vitamin B6 status in morbidly obese women after gastric restriction surgery. Nutrition. 1989;5:229–35.
16. Malinowski SS. Nutritional and metabolic complications of bariatric surgery. Am J Med Sci. 2006;331:219–25.
17. Rogers EL, Douglass W, Russell RM, Bushman L, Hubbard TB, Iber FL. Deficiency of fat soluble vitamins after jejunoileal bypass surgery for morbid obesity. Am J Clin Nutr. 1980;33:1208–14. 18. Primavera A, Brusa G, Novello P, et al. Wernicke-Korsakoff
encephalopathy following biliopancreatic diversion. Obes Surg. 1993;3:175–7.
19. Nautiyal A, Singh S, Alaimo DJ. Wernicke encephalopathy–an emerging trend after bariatric surgery. Am J Med. 2004;117: 804–5.
20. Loh Y, Watson WD, Verma A, Chang ST, Stocker DJ, Labutta RJ. Acute Wernicke’s encephalopathy following bariatric surgery: clinical course and MRI correlation. Obes Surg. 2004;14:129–32. 21. Escalona A, Perez G, Leon F, et al. Wernicke’s encephalopathy
after Roux-en-Y gastric bypass. Obes Surg. 2004;14:1135–7. 22. Madan AK, Orth WS, Tichansky DS, Ternovits CA. Vitamin and
trace mineral levels after laparoscopic gastric bypass. Obes Surg. 2006;16:603–6.
23. Holick MF. Vitamin D deficiency. N Engl J Med. 2007;357:266–81. 24. Bischoff-Ferrari HA, Giovannucci E, Willett WC, Dietrich T, wson-Hughes B. Estimation of optimal serum concentrations of 25-hydroxyvitamin D for multiple health outcomes. Am J Clin Nutr. 2006;84:18–28.
25. Stamoulis I, Kouraklis G, Theocharis S. Zinc and the liver: an active interaction. Dig Dis Sci. 2007;52:1595–612.
26. Chakravarty PK, Ghosh A, Chowdhury JR. Zinc in human malignancies. Neoplasma. 1986;33:85–90.
27. Guy NC, Garewal H, Holubec H, et al. A novel dietary-related model of esophagitis and Barrett’s esophagus, a premalignant lesion. Nutr Cancer. 2007;59:217–27.
28. Sager M. Vertical mobility of selenium, arsenic and sulfur in model soil columns. Die Bodenkultur. 2008;53:83–103.
29. Madan AK, Orth WS, Tichansky DS, Ternovits CA. Vitamin and trace mineral levels after laparoscopic gastric bypass. Obes Surg. 2006;16:603–6.
30. Skroubis G, Sakellaropoulos G, Pouggouras K, Mead N, Nikiforidis G, Kalfarentzos F. Comparison of nutritional deficien-cies after Roux-en-Y gastric bypass and after biliopancreatic diversion with Roux-en-Y gastric bypass. Obes Surg. 2002; 12:551–8.
31. Brolin RE, Bradley LJ, Taliwal RV. Unsuspected cirrhosis discovered during elective obesity operations. Arch Surg. 1998;133:84–8.
32. Flancbaum L, Belsley S, Drake V, Colarusso T, Tayler E. Preoperative nutritional status of patients undergoing Roux-en-Y
gastric bypass for morbid obesity. J Gastrointest Surg. 2006;10: 1033–7.
33. Madan AK, Orth WS, Tichansky DS, Ternovits CA. Vitamin and trace mineral levels after laparoscopic gastric bypass. Obes Surg. 2006;16:603–6.
34. Skroubis G, Sakellaropoulos G, Pouggouras K, Mead N, Nikiforidis G, Kalfarentzos F. Comparison of nutritional deficien-cies after Roux-en-Y gastric bypass and after biliopancreatic diversion with Roux-en-Y gastric bypass. Obes Surg. 2002; 12:551–8.
35. Brolin RE, Bradley LJ, Taliwal RV. Unsuspected cirrhosis discovered during elective obesity operations. Arch Surg. 1998;133:84–8.