Business Intelligence in Chile, Recommendations to
Develop Local Applications
By
Sebastian Robles
MASSACHUSETTS INSTMJTE OF TECHNOLOGYMAR 0
8
2012
LIBRARIES
Submitted to the System Design and Management Program
ARCIVES
in partial fulfillment of the requirements for the degree ofMaster of Science in Engineering and Management at the
MASSACHUSETTS INSTITUTE OF TECHNOLOGY February 2010
@ 2010 Massachusetts Institute of Technology. All rights reserved.
Signature of Author
Sebastian Robles System Design and Management Program
February 2010
Certified by_
Michael A. Cusumano Thesis Supervisor MIT Sloan School of Management
// -
\ n
L
n h
Accepted by
Patrick Hale Director System Design and Management Program
Business Intelligence in Chile, Recommendations to
Develop Local Applications
By
Sebastian Robles
Submitted to the System Design and Management Program In Partial Fulfillment of the Requirements for the Degree of
Master of Science in Engineering Management
at the
Massachusetts Institute of Technology
Abstract
The volume of information generated from enterprise applications is growing exponentially, and the cost of storage is decreasing rapidly. In addition, cloud-based applications, mobile devices and social networks are becoming relevant sources of unstructured data that provide essential information for strategic decisions making. Therefore, with time, enterprise databases will become more valuable for business but also much harder to integrate, process and analyze.
Business Intelligence software was instrumental in helping organizations to analyze information and provide reports to support business decision-making. Accordingly, BI applications evolved as enterprise information grew, hardware-processing capacities developed, and storage cost is being reduced significantly. In this paper, we will analyze the current BI world market and compare it with the Chilean market, in order to come up with business plan recommendations for local developers and systems integrators interested in capitalizing the opportunities generated by the global BI software market consolidation.
Thesis Supervisor: Michael A. Cusumano
Acknowledgements
I would first like to thank my wife for her support during my years at MIT. Without
her this thesis would have never being possible. Thanks to her I was able to focus in my work while enjoying our stay in Boston.
Second I would like to thank my thesis supervisor, Professor Michael A.
Cusumano, for supervising my thesis work and providing support while following my ideas. It has been an honor to work with him and will remain as one of my greatest experiences of my study here at MIT.
Finally I would like to thank Pat Hale, Chris Bates and Bill Foley for their grate job at the System Design and Management program.
Table of Contents
Introduction
Background... 9
Research Objective and Motivation...10
Chapter 1
Business Intelligence W orld Market... 12
1.1 Market Overview...13
1.1.1 Market Share... 18
1.1.2 Market Leaders' Strengths and Weaknesses... ... 19
1.1.3 Business Intelligence Ecosystem...23
1.1.4 Vision and Ability to Execute... 27
1.2 Use of Bl...28
1.2.2 Use by Business Units... 31
1.2.3 Use of BI Tools...32
Chapter 2
Business Intelligence in Chile... 35
2.1. Market Overview...35
2.2. Use of BI... 37
2.2.1. Use by Business Units...39
2.2.2. Use by Industry...40
Chapter 3
Business Plan Recommendations to
Develop BI Software in Chile...45
3.1 Target Market...45
3.1.1 Size ... 45
3.1.2 Growth...47
3.2 Technology...48
3.2.1 P roduct... 48
3.2.2 Bl into the Cloud...49
3 .3 T actics... 50
3 .3 .1 M arket...50
3.3.2 Customer Segmentation...51
3.3.3 Sales and Marketing... 52
3 .3 .4 P ricing ... ... 55
3 .3.5 Integration...56
Chapter 4
Conclusions...57
Introduction
Background
Emerging vendors have capitalized recent changes in the BI ecosystem, showing higher innovation capacity than traditional BI vendors. On the other hand, mega vendors followed a frenetic merger and acquisitions strategy for the last three years instead of focusing on developing newer and more innovative BI capabilities from the inside.
Just like in the world BI software market, the Chilean market had consolidated into a few mega vendors. Accordingly, changes in customer interfaces, vendor culture, sales strategies, support quality and everything that comes along with mergers and acquisitions have had a considerable impact on customer satisfaction. In addition, small and medium business customers faced a market with fewer vendors who were prepared to understand their needs and provide the relationship and support required to implement, operate and maintain B software in their organizations.
All these rapidly increasing market shifts created an important opportunity for
local developers and systems integrators for capitalizing on these changes. Indeed, higher interest from corporations in customized BI applications and open source integrations should be expected, boosted by the economic downturn and internal mega vendor adjustments.
Research Objective and Motivation
The objective of this thesis is to make recommendations to Chilean software firms interested in developing BI software. Suggestions will target market and territory, product strategy and strategic alliances. The local market is small and very competitive, and could transform in an excellent laboratory for software development that later can be replicated in the nearby and global markets.
We will start by exploring the global market, including an overview, analyzing the level of penetration of BI software by business unit and by tools, followed by
identifying the strengths and weaknesses of the large player. Then, we will mirror this information with the Chilean market, in order to identify the best recommendations to start a new business of BI development in Chile.
As part of our recommendations, we will identify the best territory in which to start the business, the market size and how much of it could be addressed, followed
by the recommended product strategy, that includes the software capabilities and
the BI layer that is better to start from, together with suggested strategic alliances to accelerate the time-to-market of the software.
Chapter 1
Business Intelligence World Market
While the whole software market is facing challenging economic times and a market that declined compared with the previous year, Business Intelligence (BI) software did not share the same destiny, showing double-digit growth in 2009.
According to Gartner's annual survey of CIO technology priorities, BI remained
among the top five priorities in 2009 (and it was number one in each of the previous four years). BI software provides the transparency and decision support that is helping senior management to improve business performance. We could
say that BI is one of the most relevant business technologies of the decade.
During the last three years, large BI vendors aggressively made strategic acquisitions that capitalized market opportunities and acquired software with newer and more innovative capabilities. BI vendors based their recent innovation strategy on company acquisitions rather than in in-house innovation. As result of this strategy, their customers faced continuous vendor organizational changes that are now negatively impacting their satisfaction.
3.1 Market Overview
A relevant BI market consolidation began in 2007, concentrating the market in a
few large vendors. In 2009, the top five vendors held 75%' of an $8 billion market2. In the image below, we can observe the most important mergers and acquisitions between 2006 and 2008.
Market Consolidation Roadmap
3L/V '1
Despite the economic downturn, Gartner forecast for B the fastest growth in the software market. In tough economic times, BI had become a key business enabler, helping corporations to reduce cost and risk, and increase their incomes.
1 Gartner, Market Share: Business Intelligence, Analytics and Performance Management
Software, Worldwide, 2008
2 Forrester, BI Software and Emerging Trends, 2010
However, the recession, together with the commoditization of Core BI and market consolidation, are expected to reduce BI platform revenue growth4. Accordingly,
in the image below, we can observe numbers from IDC that show continuous growth since 1993.
Worldwide Business Intelligence Tools Revenue and Growth,
1993-2009 9 - 35 8 3 7 N 20 1 15 2 0 0 1993 1994 1995 1996 1997 1998 1999 2000 2001 2002 2003 2004 2005 2006 2007 2008 2009
mRevenue
($B) -+-G0rovth (%)Note: Any differences to historical figures are due to corrections made after receipt of additional market intelligence.
Source: IDC, June 2010
In order to drill down into Bl software and its market growth we will use as a reference the Forrester Research BI framework5 that covers five layers of BI
software, including Core BI, business performance solutions, predictive analytics/data mining, text analytics and complex event processing:
4 Gartner: Forecast: Enterprise Software Markets, Worldwide, 2008-2013, 4Q09
- Core BI
Provides generalized reporting and ad hoc query and analysis. In addition to these, Core BI players now typically provide online analytical processing (OLAP), analytic dashboards, and interactive visualization features such as drilldown, portal and Microsoft Office integration, and alerts. Thus, Core BI today combines reporting and analytics.
- Business Performance Solutions
Adds specific business metrics, often for vertical industries. In combination with Core BI features, business performance solutions provides tools and templates to help users make strategic decisions supported by scorecards, metrics, KPIs, what-if modeling, and budgeting.
Use models and statistical analysis for scenarios. These solutions extend Core BI features and historic business analytics with modeling, statistical analysis, clustering/set analysis, scoring, and simulation. These products are still largely for highly sophisticated users, who employ them to identify meaningful patterns among variables in complex structured data sets.
-Text Analytics
Extend the scope of BI to unstructured textual data for richer analysis. Core BI does not typically encompass natural language processing, semantic analysis, or entity analysis, but these techniques can identify useful patterns in unstructured and semi-structured formats, especially when combined with powerful search capabilities.
* Complex Event Processing (CEP)
Uses near-real-time data for operational BI or activity monitoring. These products use event stream processing via low-latency
middleware. So far confined primarily to the financial community, such analytics hold the promise of more actionable results, moving beyond
predicting the past to reacting in the present.
From all BI layers, business performance mining, text analytics and complex event forecasted growth. Commoditized Core BI layers that are generating new business generate higher margins.
$15,000 $12,000 $9,000 Total BI revenues by product segment (US$ millions) $6,000 RW $3,000 $0 2008 2009 2010 2011 Complex event $62 $84 $108 processing Text analytics $231 $296 $393 $499
Predictive analytics/ data mining $561 $698 $900 $1,098
Business performance $1,699 $2,099 $2,676 $3,226 solutions
Core BI $4,411 $4,811 $5,421 $5,688
(numbers have been rounded)
solutions, predictive analytics/data processing software show higher is serving as a platform for the new opportunities for vendors that can
Complex event processing Text analytics 2012 2013 $138 $177 $632 $792 $1,328 $1,579 $3,838 $4,466 $5,891 $5,989 2014 $223 $978 $1,843 $5,073 $5,990
Note: Forecast starts in 2009.
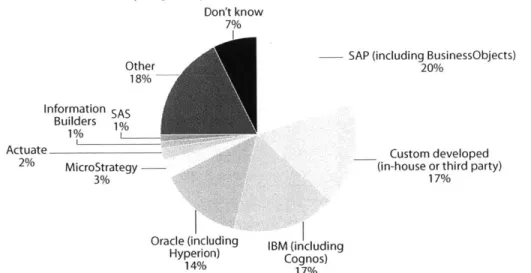
1.1.1.Market Share
IT executives and software decision-makers from United States and Europe6 name as their companies' primary providers for business intelligence software
SAP with 20%, followed by IBM with 17% and Oracle with 14%. Indeed, the
three largest BI mega vendors started a consolidation race that began in 2007, and current market share values are the result of a frenetic wave of mergers and acquisitions that had not stopped yet.
Figure 4 Few Megavendors Are Named As Primary BI Providers
"Who is your primary vendor for business intelligence software?"
Don't know
7%
--- SAP (including BusinessObjects)
Other 20%
18%
Information SAS Builders 1%
1%
Actuate Custom developed
2% MicroStrategy (in-house or third party)
3% 17%
Oracle (including IBM (including Hyperion) Cognos)
14% 17%
Base: 495 North American and European software decision-makers responsible for packaged applications Source: Enterprise And SMB Software Survey, North America And Europe, Q4 2009
1.1.2 Market Leaders' Strengths and Weaknesses
Every year, Gartner researches7 the BI Industry and provides useful insights to every corporation evaluation of BI Software and to vendors developing BI applications. In this section, we will summarize the largest players' strengths and weaknesses that could be found as part of this research.
IBM
Strengths
IBM Cognos 8 remains much better integrated than most competing offerings. Research from Gartner estimated customers need only three administration staff per thousand users on average and almost 75% consider IBM a BI standard in their organization.
In April 2009, IBM Global Business Services (GBS) announced the introduction of its Business Analytics and Optimization (BAO) consulting practice with 4,000 consultants focused on BI and performance management. They launched a new
midmarket offering, acquired SPSS, announced a new content analytics offering for text/unstructured data, an expanded set of deployment options and a cloud-based offering.
Weaknesses
8.5% of the IBM Cognos customers surveyed said they plan to discontinue using
the products in the next five years, versus 1.5% of customers using SAP Business Objects and 3.1% of customers using Oracle Business Intelligence Enterprise Edition. IBM does not have business applications and does not share the same operational BI vision or capabilities of Oracle and SAP.
IBM Cognos support is rated among the lowest of the vendors in the Gartner Magic Quadrant, and an increased incidence of unreliable/"buggy" software, affecting its Ability to Execute rating. It should be noted that 2009 was a transition period for IBM, as it changed over Cognos customer support and account management.
Consistent with previous Magic Quadrants, 32% of customers surveyed reported poor performance as the single most frequently reported problem with IBM Cognos 8 - more than for any other vendor included in the Magic Quadrant.
Oracle
Strengths
Oracle has established the Oracle BI Enterprise Edition (OBIEE) platform successfully in the market, becoming a "BI standard" in most of their customers that are showing high interest in implementing their Oracle solutions across the enterprise.
Oracle products are perceived as high quality and it has significantly improved its support scores in public surveys. Customers also have a very positive perception of its vision and success.
Weaknesses
Much effort is being put into integrating the Oracle BI platform with the wide variety of Oracle business applications and other middleware technologies.
While this will benefit the Oracle installed base of customers, Oracle lags behind the competition in introducing new and innovative solutions, such as the ability to integrate interactive visualization, search and collaboration as part of the BI platform offering.
Lack of "data quality" was the number one reason given by customers to expand deployments of OBIEE. This could, in part, be because OBIEE is often used for data federation to query directly against enterprise data sources without the benefit of the data quality processes that occur in a data warehouse.
SAP
Strengths
SAP is continuing the Business Objects established strategy of providing
leading-edge capabilities, many of which complement its BI platform, in the areas of collaboration and decision support; text analytics; in-memory analytics; OnDemand BI (SaaS); search coupled with BI; data integration with lineage and impact analysis; and data quality.
127 countries with 5,250 channel partners, 1,350 value-added resellers globally
and 850 OEMs. The combination of SAP and Business Objects has formed the largest installed base in the market. Gartner estimates this installed base to be more than 46,000 customers.
Weaknesses
For the third year in a row, customer survey data shows that customer support ratings for SAP are lower than for any other vendor in our customer survey. Overall customer experience scores that include support, sales experience and software are at the lowest levels. These results are not unusual in the aftermath of an acquisition.
1.1.3 Ecosystem
The large vendors and small players we can observe in the ecosystem are:
Core BI
Core BI is table stakes for the large players that increasingly add features from the following list, upping the competitive ante. Some representative
vendors are Actuate, IBM (Cognos), Information Builders, Microsoft,
MicroStrategy, Oracle (Hyperion), Panorama Software, QlikTech, SAP
(Business Objects), SAS, and TIBCO Spotfire.
Business Performance Solutions
Leading firms include SAS; some of the core BI vendors previously mentioned; and others, including Clarity Systems, Infor, Lawson Software, and Longview Solutions.
Predictive Analytics and Data Mining
Angoss Software, InforSense, KXEN, SPSS (with Clementine), and other vendors are innovating in this sector. In addition, open source code bases, such as the R statistical library, have gained a foothold here. Core BI
vendors such as IBM, Information Builders, Microsoft, MicroStrategy, Oracle,
SAP, SAS, and TIBCO Spotfire also have some advanced capabilities in this
segment.
Text Analytics
Acquisitions by Microsoft (FAST), SAP/Business Objects (Inxight Software), and SAS (Teragram), in addition to offerings from IBM (SPSS) and other vendors such as Attensity, Attivio, Autonomy, Endeca Technologies, and Thomson Reuters (ClearForest) demonstrate strong vendor interest in this sector.
Complex Event Processing
Representative firms include Aleri, Altosoft, Coral8, SENACTIVE,
StreamBase Systems, TIBCO Software, and Vitria Technology. Similar to text analytics, complex event processing solutions can be leveraged in any of the layers of the model for real-time reporting, analytics, unification, pervasiveness, and smart BI at the very second of any event.
1.1.4 Vision and Ability to Execute
If we take a look at Gartner Magic Quadrant, we can observe the same patterns
of mega vendor leadership mentioned before. However, emerging vendors like
SAS and Information Builders show high levels of vision and ability to execute
becoming members of the exclusive group of market leaders in the upper right corner. The survey also confirms that Information Builders is chosen more often than any other vendor for its data access and integration capabilities and that SAS's approach to BI continues to focus on the more advanced technologies, such as forecasting, predictive modeling and optimization, and embedding them
challengers leaders
e~racle
microsoft
a IBM
OlikTech SASa MicroStrategy
Tibco Software (Spotfire) jSAP
XTh~a Information Builders
*Board International
earcplan
Targit Panorama Software 0Actuate
niche players visionaries
- - r nCpleteness ViLsr"
As of Januan 2010
Source: Gartner (January 2010)
1.2 Use of BI
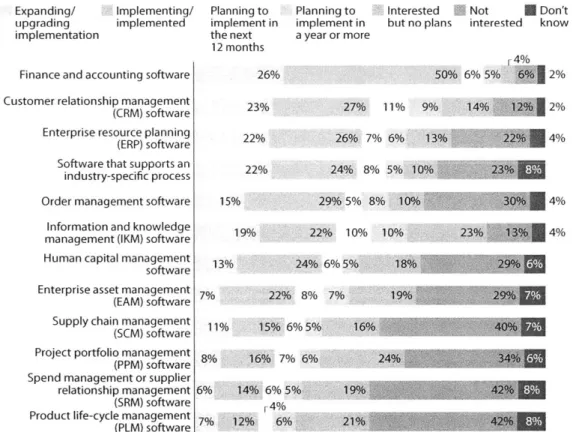
Data from Forrester Research" estimates that eighty-four percent of companies in North America and Europe show a strong interest in Information Knowledge
(IKM) software, which includes collaboration management, content management and business intelligence software among others. Surveys rank IKM sixth in
current adoption rates among all business applications, with 31% of all companies that had already implemented IKM solutions. In addition to the above, companies rank IKM software third in level of interest, just behind finance and accounting and customer relationship management (CRM) software.
Figure 2 IKM Ranks Sixth In Implementation But Third In Interest Among Business Apps Software
"What are your firm's plans to adopt the following business applications?"
Expanding/ upgrading implementation
Implementing/ implemented
Finance and accounting software Customer relationship management (CRM) software Enterprise resource planning (ERP) software Software that supports an
industry-specific process Order management software Information and knowledge management (IKM) software Human capital management software Enterprise asset management 17%
(EAM) software
Supply chain management
(SCM) software Planning to implement in the next 12 months 26% 23% 22% 22% 15% Planning to implement in a year or more
Interested Not Don't but no plans interested know
r4% 50% 6% 5% 12% 27% 11% 9% 14%, 2% 26% 7% 6% 13% 4% 24% 8% 5% 10% 28 29*5% 8% 10% 4% 19% 22% 10% 10% 23% 4% 13% 11%
Project portfolio management 8%(PPM) softwareI Spend management or supplier
relationship management (SRM) software Product life-cycle management
(PLM) software 24% 6%5% ' J1M4 ' 22% 8% 7% 15% 6%5% 16% 7% 6%
A
16%:M 24%s MR M* 1496%5% 19% 7% 12% 6% '21%-U.'-..-Base: 928 North American and European software decision-makers responsible for packaged applications (percentages may not total 100 because of rounding)
Source: Enterprise And SMB Software Survey, North America And Europe, Q4 2009
Specifically for BI software, 49% percent of all companies in North America and Europe are planning a project for 2010. A drilldown into the survey data reveals that 54% of all companies have already implemented BI software, and another
25% are planning to implement it. If we consider the 24% of existing
implementations that will be expanded or upgraded, 49% of all companies were planning a BI project for 2010.
BI has the highest project forecast percentage among all business application software, followed by CRM at 43%, finance and accounting at 37%, and enterprise resource planning (ERP) and industry specific software, both at 35%. Indeed, companies have a huge interest in adopting BI technologies, especially during an economic downturn, and this brings along important business opportunities for BI vendors.
"What are your firm's plans to adopt the following information and knowledge management software technologies?"
Expanding/ Implementing/ Planning to Planning to ' Interested |-| Not U Don't upgrading implemented implement implement but no plans interested know
implementation in the next in a year or
12 months more
3%
Collaboration software 31% 37% 7% 14% 8W 1%
Content management software 26%/6 29% 9% 17% 144% 1%
Business intelligence software 24% 30% 9% 16% 140 2% Information access software 19% 12 11% 10% 4% Learning management software 15% 9% 8% 7 304%
Base: 921 North American and European software decision-makers responsible for packaged applications (percentages may not total 100 because of rounding)
Source: Enterprise And SMB Software Survey, North America And Europe, Q4 2009
56749 Source: Forrester Research, Inc.
1.2.1 Use by Business Units
On the same survey9 performed by Forrester, Business Performance Solutions have the highest adoption in the finance department, and the levels of interest in other business units like sales, production, procurement, and sustainability, are all at a similar level.
"What are your firm's plans to adopt the following business performance solutions?"
Expanding/ Implementing/ Planning to Planning to Interested Not U Don't upgrading implemented implement implement but no plans interested know implementation in the next in a year or
12 months more
Financial performance management 17% 31% 11% 10% 8%
Sales performance management 13% 23% 10% 8% 16%
Production performance management 12% 21% 9% 8% 19%X Sourcing, procurement, and 8% 19% 10% 7% 20%
trading performance management ~ 1%7
Supply chain performance management 10% 17% 9% 8% 18% 1
Sustainability performance management 5% 14% 9% 8% 3 2 %
Base: 649 North American and European software decision-makers responsible for packaged applications (percentages may not total 100 because of rounding)
Source: Enterprise And SMB Software Survey, North America And Europe, Q4 2009
56749 Source: Forrester Research, Inc.
1.2.2 Use of BI Tools
Of those companies using BI solutions, surveys0 estimate that 62% are using BI
reporting solutions, and about half of these are still expanding and upgrading their reporting applications. Data visualization and dashboard solutions are currently implemented by 39% of all companies. While 46% of enterprises have already implemented analytics solutions, only 30% of small and medium-size businesses (SMBs) have done so, and this provides an excellent growth opportunity for BI vendors in this market. The next big growth area predicted by
Forrester in BI applications, however, will be in the category of business performance solutions, expected to grow from a $2 billion market in 2009 to $5
billion by 2014.
"What are your firm's plans to adopt the following business intelligence technologies?"
Expanding/ Implementing/ Planning to Planning to Interested 0ilNot Don't upgrading implemented implement implement but no plans interested know implementation in the next in a year or
12 months more
Reporting tools 31% 31% 12% 9% 610% 2% Data visualization, dashboards 17% 22% 18% 13% 19% 3%
Specialized database engines 18% 15% 9% 8% 21%
Business performance solutions 16% 11% 10% 11% 27% 8% Decision support solutions 15% 11% 10% 10% 286
Data quality management 15% 10% 11% 10% 28%
Advanced analytics 9% 11% 10% 10% 29 Complex event processing 8% 5% 6% 6% 28%
Text analytics 9%3%7% 6% 28%
r%
In-process analytics 3% 29% L2% L 4%
Base: 853 North American and European software decision-makers responsible for packaged applications (percentages may not total 100 because of rounding)
Source: Enterprise And SMB Software Survey, North America And Europe, Q4 2009
56749 Source: Forrester Research, Inc.
Business Performance Solutions software integrates data from various sources to key performance indicators to provide strategic decision-making support. While 27% of companies have already implemented business performance solutions, an additional 49% is planning to implement or is interested in this technology.
Additional research" from Gartner found that the most used tools are reporting, Adhoc Query and Dashboards. Accordingly, those three tools also received the top four highest rated scores.
Figure 1. Overall Rating of BI Platform Capabilities in Meeting Needs
Rating Percent 80 70 60 50 40 30 20 10 -0
Score * % using Extensively
Rating is equal to mean of means score across vendors for each capability. The percentage axis reflects the mean percentage of respondents claiming extensive use across vendors.
Chart represents customer perception and not Gartner's opinion.
The chart may feature vendors that (in Gartner's opinion) do not deliver the functional capability described. BI = business intelligence, OLAP = online analytical processing.
N=897
Source: Gartner (February 2010)
Chapter 2
Business Intelligence in Chile
The size of the Business Intelligence market in Chile is a very small portion of the global market. Nevertheless, we can observe the presence of all the large players in the global Business Intelligence industry that, together with open source solutions, distributors and consultants have built a market as competitive as any other large market, including the United States.
2.1 Market Overview
There is no public data regarding the size of the BI or software market in Chile; however, the Chamber of Commerce of Santiago estimates a market of 3.4 billions for software, hardware and related services in 2009.
Large vendors dominate the local market, and there is no presence of local developers. Data 12 from CETIUC shows that the most utilized business
intelligence solution is SQL Server, which is used by 55.9% of large corporations present in the country. Second and third, respectively, we find Business Objects (acquired by SAP) with 32.2% and Hyperion (acquired by Oracle) with 28.8% of
large companies using their solutions.
If SAP and Oracle are able to leverage the Business Objects and Hyperion
market share, they have a great opportunity to cross-sell their portfolio if they are able to maintain or increase their customer's satisfaction. Due to the major acquisitions that will inevitably impact local customers, it is hard predicting their loyalty.
Which of the following BI software are used or are expected to be to be
used in your firm?
SAS Oracle BI Suite .
Teradata
Open Source Micro Strategy
SAP Analytics s sIn Use
Cognos InProject for 2009
SPSS Hyperion Business Objects SQL Server 0.0% 10.0% 20.0% 30.0% 40.0% 50.0% 60.0% Source: CETIUC
When asked which vendor they would like to work with in the future, large corporations forecast very low usage growth, which could also be interpreted as indifference about deciding their future Business Intelligence vendors.
2.2 Use of BI
Business Intelligence market penetration is as high as we can observe in other countries like the United States (49% estimated for 2010 by Forrester). Sources from IDC'3 estimate that, in 2008, 44% of companies based in Chile used BI to administrate their business, and 30% of them developed their own applications in-house or through outsourcing.
Adoption of Business Intelligence in Chile during 2008
Q Internal Development 19%
External Development 11% Package Software 12% Outsourcing 2% Does not have 56%
Source: IDC
If we look at the behavior of the larger companies in the country, sources from
CETIUC14 estimate that, in 2008, 69% of them had implemented an initiative of BI.
The same source estimates a 76.9% of BI usage for companies with revenues over $330 million and 80% for companies with revenues between $130 million and $330 million.
Is your firm actually using or have they used in the past any type of
Business Intelligence Solution?
U Does not use BI 3 1% Use BI 69%
Source: CETIUC
2.2.1 Use by Business Units
On the same report from CETUC'5, if we look into the usage of BI inside larger
companies, we can observe that business and support units have different levels of utilization. Marketing and sales is the business unit that benefits the most from BI, with an usage of 71.2%, and an expected usage of 83.3% for 2009, followed
by administration and finance and production and operations with usages of
54.2% and 49.2% respectively. The emerging trend is the usage of BI for customer service with 72.9% of companies planning to use it for those purposes in 2009.
Areas of Application of Business Intelligence: In which business unit has
your firm used or is expecting to use Business Intelligence software?
Research and Development a
Human Resources y
Logistics
Customer Service
In Project for 2009 Manufacture and Operations
Administration and Finance
Sales and Marketing
0.0% 20.0% 40.0% 60.0% 80.0%100.0%
Source: CETIUC
2.2.2 Use by Industry
the business unit that uses BI the most in almost every company; nevertheless, other business and support units show different levels of utilization depending on the business they are immersed in. On the graphic below'6, it is possible to observe the usage for Chilean companies grouped in three types of industries: Information Services, Distribution Services and Production.
Application of Business Intelligence by Industry: In which business unit has your firm used or is expecting to use Business Intelligence software?
Human Resources Logistics Manufacture Research and Development Distribution Administration and S FacInformation Services Customer Service Manufacture and Operations Sales and Marketing
0.0% 20.0% 40.0% 60.0% 80.0%
Source: CETIUC
If we observe companies that belong to the information services group, we can
16 CETIUC: Reporte Anual de Business Intelligence, 2008
find high levels of BI usage in marketing and sales, and a higher use in research and development as compared to other industries.
Companies that belong to the distribution services industry also have a high use of BI for marketing and sales but differentiate from the others by having a high usage for operations. In the production industry, the highest levels of utilization are observed in administration and finance, followed by marketing and sales .
2.2.3 Use of BI Tools
Business Intelligence solutions provide a wide variety of tools and applications with different levels of implementation complexities and business return. If we
take a look at the level of implementation of each tool, we could conclude that higher levels of utilization are observed on those tools that have a higher ratio of complexity versus business return. The higher the business impact and the lower the complexity, the higher the usage that we can observe.
The research from CETIUC17 shows a very high use of query and reporting, with
88.1% for 2008 and an expected 98.3% for 2009. Second comes data
warehouse, with a usage of 78% in 2008 and an expected usage of 93.3% for
2009. Third comes OLAP, with a usage of 76.3% in 2008, and an expected
83.1% for 2009.
Which of the following business support tools are currently used or in
project at your firm?
Data Mining Statistical Analysis KPI, Dashboards OLAP A In Used In Project for 2009 Data Warehouse Query & Reporting 0.0% 20.0% 40.0% 60.0% 80.0% 100.0% 120.0% Source: CETIUC
data mining. Nevertheless, it also shows the highest level of expected growth, with a predicted 28.8% for 2009.
Chapter 3
Business Plan Recommendations for Business
Intelligence Software in Chile
3.1 Target Market
3.1.1 Size
Forrester forecasts18 the Business Performance Software World Market in $3.226
billion followed by an accelerated growth for the coming years. Core BI commoditization reduces its market growth but its forecasted market size is still an impressive $5.668 billion.
For the Chilean done with global
Market, we do not have precise data, but estimations can be market information.
Facts
o Santiago Chamber of Commerce estimates a local market of $3.4 billion for software, hardware and related services.
o Global spending'9 in enterprise software represents approximately
15.3% of the spending in software, hardware and related services
(as shown in figure below).
o Global BI software market20 size is $8 billion out of $366 billion of the total software market, representing approximately 2.2%.
Global business spending on IT products and services (US$ billions, 2009) Applications $151 Custom-built applications $75 Middleware
A
$117 OS Servers $22 .$51 PCs $51 $160 Software $366 IT services $268 $23 Telecom s $92 Storage $42 Peripherals $61 Other $22 Computer equipment $335 Comm. equipment 87 $324 Outsourcing $169 ervices 5 BI software market $8 billionSource: Forrester Research, Inc.
19 Forrester: The State of Business Intelligence Software and Emerging
Trends:201 0
20 Forrester: The State of Business Intelligence Software and Emerging Trends:2010
Assumptions
If we use the global trend as a reference for the local market:
o Chilean business software market is 15.3% of the spending in software, hardware and related services
o Chilean BI software market is 2.2% of the total enterprise software market
Chilean Market Size:
The Chilean software market size could be estimated at $550 million dollars, with the BI Software market at approximately $12.11 million dollars.
3.1.2 Growth
IDC forecasts2' the advanced analytics software market in Latin America to grow
12% in 2010. The Core BI software market is also expected to grow in 2010 at a more moderate but still impressive 8%. Despite the slowdown seen in the
applications market in 2009, the predictive and analysis tools market will continue their growth trend over the coming years.
3.2 Technology
3.2.1 Product
As mentioned in the previous chapters, there are different types of business Intelligence software with diverse capabilities that tackle a variety of business needs. There are different BI layers, and the best strategy would be focusing on one while entering the market. Considering market size and growth, the best layer to start a new product for would be business performance.
It is also true that each day, more companies are using electronic invoicing. Government is also pushing to accelerate the adoption of digital invoicing technologies by giving benefits to early adopters. A small or medium company can use electronic invoice software without the need of having an ERP, creating a valuable source of information that can feed a business performance solution at
Indeed, BI software that can include capabilities of e-facture would enable a very low cost business performance solution that can provide valuable business performance information for small and medium businesses. Something that would usually require having an ERP now would be possible by having low cost software,
3.2.2 BI into the Cloud
Cloud computing is an incremental innovation rather than a disruptive, a term that covers different technologies that used to be named separately and were consolidated prior to the creation of the "cloud computing" tag.
Technologies of distributed or grid computing; distributed and virtualized storage; virtualized servers and desktops; application services; web applications used to
reach customers through the internet; software as a service-all these technologies and business models together, after being subjected to important incremental innovations that significantly reduced costs and risks and increased performance, is what we know today as the "cloud."
While 21% of all companies are already using software as a service (SaaS)22
only customer relationship management (CRM) and human capital management (HCM) have made their way into the cloud. Business Intelligence does not have the same adoption rate. Nevertheless, 41% of all companies are strongly interested in moving BI into the cloud.
The benefits that are driving customers to cloud computing are ease of implementation, costs and mobility. However, the top concerns that are impeding the adoption are security and integration challenges. BI applications need to consolidate all kinds of data from many different sources, and the biggest challenges come from there.
A cloud-based BI solution would facilitate customer acquisition by simplifying the
implementation process and obtaining economies of scale. BI vendors are moving aggressively into the cloud and customers are willing to adopt this type of technology. Regardless of the currently low deployment rates, it has already
become a strategic technology to reach a wide customer territory, simply through implementations and competitive costs.
3.3 Tactics
Focusing only in Chile is a high-risk bet, due to the small market and high
competitiveness observed. Nevertheless, the business needs of Chilean
companies are the same that can be observed in the global market and local software developments could be replicated in other countries using Chile as a business platform. Starting in Chile would require smaller investments and implicate fewer risks to the owners as compared to a company located in the United States or Europe.
The recommended growth strategy for Chilean BI software developers would be growing in phases. Testing a small market and then replicating to larger ones. A good roadmap would be starting first in the Chilean market, then the South Cone, then Latin America and, finally, expanding to global markets.
3.3.2 Customer Segmentation
Small and medium business (SMB) represents a land of opportunities. In this segment, large players cannot deliver high levels of service, specific customizations and competitive pricing at the same time. Especially now, when the impact of BI market consolidation has affected customer satisfaction, and
smaller vendors that are able to deliver a higher level of service, quality products and affordable costs have a competitive advantage that can be capitalized.
If the venture is successful in the early stages, it would be easy to expand to
other customer segments and start doing business with larger corporations as the company and the sales force grows. Enterprise business has lower margins than SMB, but it also has higher revenues that would help obtain higher economies of scale.
3.3.3 Sales and Marketing
Depending on the growth phase, there are different strategies that could be used.
Phase 1
Market entry: Target innovator customers
- Enter the market working with one or two innovator SMB customers that are willing to work with a company new in the industry.
- It is recommended to start working with customers that are currently are not using ERP's. The solution for these customers will be of higher value
than for those that currently have Enterprise Resource Planning software that is creating relevant data for the business.
- Networking and background of the founding team would be essential in acquiring the first customers and should be considered while building the core team.
- Include cloud-computing capabilities. Users should be able to access the private/public cloud to use the application. Customers will benefit by a faster implementation, nonexistent maintenance costs, no need for a high
initial investment, and ubiquitous access.
Google enterprise market place should be considered as the source of the backend required to provide cloud services. Partnering with Google would accelerate time-to-market and reduce maintenance costs. It can become a great partner for this venture and provide the entire infrastructure required to start cloud-based software from day one, without huge initial investments and
maintenance costs.
Phase 2
- After a few customers (2-4) have been serviced through Phase 1, look for new customers where exactly the same product can be implemented.
- In this phase, economies of scale are the key. As long as the software previously developed can be used with new customers without the need of redoing everything, development costs will go down and margins will go
up.
- After a total of four or six customers have been served, the company should start marketing the product aggressively.
Phase 3
Growth: Early majority
- With a packaged cloud-based solution, start marketing the product aggressively by word of mouth, obtaining presence in the media and partnering with local telecommunications providers.
- Create a sales strategy to cover the market, identify business leads and follow business opportunities. An inside sales representative should be
contacting potential customers and identifying business opportunities to grow the business funnel. An account manager partnering with the inside sales representative should follow those leads that move forward on the funnel until deals are closed.
- An engineering team should be able to manage a relation with the customers and provide software support.
- Facilitate customer adoption with demos and trials. Customers who are willing to pay to implement a trial are very likely to buy the product unless they are not satisfied.
3.3.4 Pricing
A model of software as a service through cloud computing would be a great
pricing strategy. A monthly fee would be easier to obtain approval on at almost every corporation as compared to a large upfront investment that carries higher risks and maintenance costs.
Business performance solutions also require consulting services that should become one of the largest sources of gross margins. Accordingly, gross margins
should not be expected to come exclusively from software. The usual license/service ratio observed in the market is 33% license and 66% services
(customization, implementation and support).
3.3.5 Integration
It is essential for the success of new Bi software to integrate with electronic invoicing solutions. As mentioned in the initial section of this chapter, it would be ideal to have electronic invoicing capabilities on the same solutions. Small businesses in Chile that adopt this solution will obtain enormous value when they are able to obtain real-time key performance indicators accessible from anywhere through the web, without the need of having sophisticated enterprise software.
Chapter 4
Conclusions
- Market consolidation had an important impact on customer satisfaction and SMB companies will be the ones suffering the most if the same market dynamics continue. They create lower individual revenues for vendors as compared to higher corporations and, as a result of this, fewer resources are assigned per company for customer support and account management.
- Cloud-based software is the best product strategy to enter the SMB
market. Implementation is much faster and maintenance costs are lower. Many SMB companies do not have enough resources to maintain hardware and software and most likely will prefer a cloud-based solution. In addition, higher economies of scale are obtained as many users could share infrastructure.
- Software as a service model comes together with public cloud computing. Customers that prefer a public cloud-based solution will also prefer to pay
a monthly fee as they use the application. It also reduces vendor dependency and facilitates contract renewals without business interruption.
- There is a higher use of customized Business Intelligence software in Chile than in the world market. While 17% of the world market prefers to develop customized software in-house or through third parties during 2009,
30% of Chilean companies made the same decision.
- Sales strategy should consider a top-down approach to customers. The main beneficiaries inside the target accounts will be decision makers and senior management, rather than the IT department, who will have different needs.
- Business performance management software should be the niche of a new BI company entering the market. The size of the market is not as big as the Core BI market, but is still an important source of revenue increasing with rapid growth. It facilitates a consultative approach to senior management and decision makers.
- Finance, sales and product performance should be part of the business performance software. These business groups are most likely to adopt
business performance solutions or improve the current ones in Chile and in the world market.
- Due to the high risk of entering a market led by large players, the financing strategy should consider the minimum possible investment. Partnering with a local software developer that currently develops code for customers and does not sell packetized software is a potential business partner that could facilitate a low investment entry. The creation of a new company in a joint venture should be explored.
Bibliography
"
Michael A Cusumano, "The Business of Software: What Every Manager, Programmer,and Entrepreneur Must Know to Thrive and Survive in Good Times and Bad", Free
Press, New York, 2004
" Geoffrey A. Moore, "Crossing the Chasm: Marketing and Selling High-Tech Products to
Mainstream Customers", 1991, revised 1999.
- Gartner, "Market Share: Business Intelligence, Analytics and Performance
Management Software, Worldwide", 2008
" Forrester Research, BI Software and Emerging Trends, 2010
- Gartner, "Forecast: Enterprise Software Markets, Worldwide, 2008-2013", 2009
- Forrester Research, "Market Overview: The Business Intelligence Software Market",
2010
- Forrester Research, "The State of Business Intelligence Software and Emerging
Trends", 2010
* Gartner, "Magic Quadrant for Business Intelligence Platforms", 2010
Gartner, "BI Platforms User Survey: Customers Rate heir BI Platform Functionality",
2010
SCETI UC, "Reporte Anual de Business Intelligence", 2008
Forrester Research, "BI in the Cloud? Yes, and on the Ground, Too", 2010
IDC, "Top 10 predictions: Latin America Predictions", 2010