Bus Rapid Transit: Impacts on Travel Behavior in Bogotn
by
GermAn Camilo Lleras
B.S. Civil Engineering
Universidad de los Andes
Bogota, Colombia (1997)
Submitted to the Department of Urban Studies and Planning
in partial fulfillment of the requirements for the degrees of
Master in City Planning
and
Master of Science in Transportation
at the
MASSACHUSETTS INSTITUTE OF TECHNOLOGY
February 2003
ROTCH
MASSACHUSETTS INSTITUTE OF TECHNOLOGYMAY 0 7 2003
LIBRARIES
C Massachusetts Institute of Technology. All Rights Reserved
Department of Urban Studies and Planning
December 2002
Certified by
Accepted by
Accepted by
Professor Ralph U'akenheimer
epartment of Urban Studies and Planning
Thesis Supervisor
Cynthia Barnhart
Professor of Civil and Environmental Engineering
Co-Director, Center for Transportation and Logistics
Professor Dennis Frenchman
Chair, MCP Committee
Department of Urban Studies and Planning
Author
Bus Rapid Transit: Impacts on Travel Behavior in Bogoti by
Germin Camilo Lleras B.S. Civil Engineering Universidad de los Andes Bogota, Colombia (1997)
Submitted to the Department of Urban Studies and Planning
on January 15,2003 in Partial Fulfillment of the Requirements for the Degrees of Master in City Planning and Master of Science in Transportation.
ABSTRACT
In the year 2000, the government of Bogoti, the capital of Colombia, undertook a major transformation of its public transport system. A Bus Rapid Transit (BRT) system named Transmilenio was implemented modifying the organizational scheme of service delivery, raising the level of service, and ultimately affecting travel behavior. This thesis studies the changes in travel behavior resulting from the introduction of the new mode and some of the impacts whereby induced. In particular it studies the competition between the traditional buses operating in mixed traffic and the BRT.
The main result is that traveling conditions have improved substantially which is reflected in the reduction of the burden associated with traveling. This is demonstrated by the lower value of time found for BRT in comparison to the existing mode. This thesis studies the consequences of these changes in terms of the future growth of the system and the fare for public transportation. In addition, it looks at the extent to which the new mode has modified the fundamental drivers of travel behavior in the city.
Thesis Supervisor: Ralph Gakenheimer Title: Professor of Urban Planning
AKNOWLEDGMENTS
I offer my gratitude to my thesis supervisor, Professor Ralph Gakenheimer and thesis reader, Dr. Andreas Schafer for their valuable advice in the development of this work and throughout my time at MIT. I would also like to thank Professor Moshe Ben-Akiva and Professor Nigel Wilson, for their time and input on my research. I also offer my thanks to the faculty and staff of the Department of Urban Studies and Planning and the Center for Transportation and Logistics for enriching my experience at MIT with invaluable insights and ideas. In particular, I like to thank Professor Karen Polenske, Professor Alice Amsden, Dr. Joseph Coughlin, and Fred Salvucci.
Thank you my friends and colleagues from DUSP and CTL for sharing a special friendship and for taking the time to discuss some of the issues included in this thesis; especially I like to thank Apiwat Ratanawaraha for his unconditional help.
In Bogota I would like to thank the staff of the Planning Department at Transmilenio, in particular Raul Roa for his valuable suggestions and efforts in the data collection.
I offer my special thanks to my family for their absolute support and to Maria Cristina for her endless patience and care.
Lastly, I would like to thank Tren Urbano, the Alliance for Global Sustainability, the Fulbright Commission, and Colfuturo for their financial support throughout my time at MIT.
Table of Contents
List of Figures...6
List of Tables ... 7
1 Introduction...9
2 The H istorical Context of Public Transportation in Bogotd... 14
2.1 Public vs. Private delivery of the service: competition on and off the road (1884 -1951) 14 2.2 The public sector from competitor to regulator (1951 - 2000)...17
2.2.1 U rbanization...17
2.2.2 Firm Evolution ... 19
2.2.3 The Role of the G overnm ent ... 24
2.3 Transm ilenio ... 27
2.4 Conclusion ... 30
3 A nalytical Fram ew ork...31
3.1 Structural Equation M odeling (SEM ) ... 32
3.2 Review of possible causes of travel behavior ... 36
3.3 D iscrete Choice M odeling ... ... ... 37
3.3.1 Discrete Choice Models as tools to analyze the competition between modes... 41
3.3.2 V alue of Tim e ... 42
3.4 Conclusion ... 43
4 The travel behavior in Bogoti... ... 45
4.1 G eneral overview and a priori hypotheses ... 46
4.2 M odel Specification ... 49
4.3 M odel Estim ation and Results ... 53
4.4 A nalysis of Results... 59
4.4.1 Endogenous E ffects... ... ... 59
4.4.2 Exogenous E ffects... 60
4.5 Conclusion ... 61
5 The Competition between Transmilenio and the Traditional System ... 63
5.1 M arket Segm ent 1...68
5.1.1 Sub-Market 1: By Area of Influence... 72
5.1.2 Sub M arket 2: B y W ealth... 76
5.1.3 Sub Market 3: By Opportunity Cost of the Trip ... 80
5.2 M arket Segm ent 2 ... 85
5.3 C o n clu sio n ... 87
6 Conclusions: Impacts on travel behavior and its consequences ... 88
6.1 Summary of Main Findings and Research Questions ... 88
6.2 What are the determinants of the choice between the two public transportation modes? 89 6.3 To what extent has Transmilenio modified travel behavior?... 91
6.4 Are benefits and changes in travel behavior uniformly distributed among all public transp ortation u sers? ... 92
6.5 What are the challenges and opportunities that the new institutional arrangement will face given the changes in travel behavior?...94
6.5.1 The Growth of the BRT network... 95
6.5.2 The public transportation fare... 97
6.6 G eneral conclusions ... 99
List of Figures
Figure 2-1 Annual passenger trips by company type...16
Figure 2-2 Organizational structure of transportation firms in Bogoti...19
Figure 2-3 Distribution of Buses and Routes per firm "afiliadora ... 23
Figure 3-1 Schematic description of the analytical approach ... 32
Figure 4-1 Public Transportation Network as 1995 ... 49
Figure 4-2 Path Diagram of Structural Equation Model for Bogoti ... 50
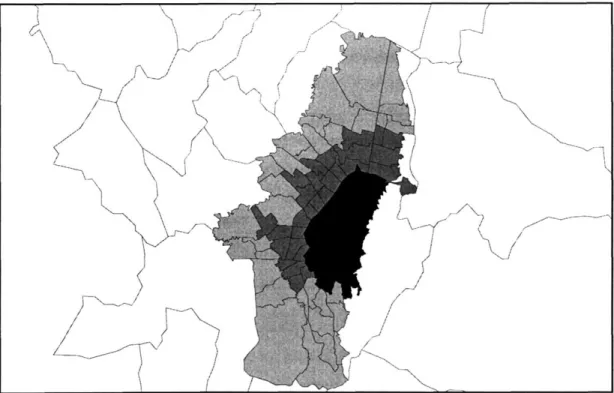
Figure 4-3 Geographic location of market segments...53
Figure 5-1 Travel time comparison by mode for Market Segment 1 ... 66
Figure 5-2 Travel time comparison by mode for Market Segment 2...67
List of Tables
Table 2-1 Population and Area Growth in Bogoti between 1951 and 1998...17
Table 2-2 Growth of Public Transportation Fleet...22
Table 2-3 Cost of construction of Transmilenio - First Phase...29
Table 4-1 Modal share of daily total trips in Bogota' in 1995 ... 46
Table 4-2 Mean trip travel time in Bogotd in 1995 by mode... 47
Table 4-3 Trip rates by mode in BogotA in 1995...47
T able 4-4 M arket segm ents...51
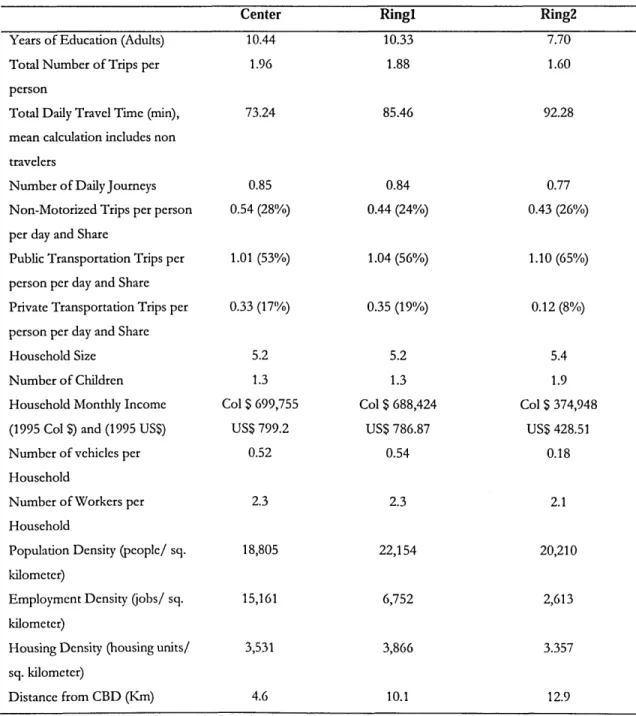
Table 4-5 Description of market segmentation by distance to CBD (Mean values) ... 52
Table 4-6 G oodness of Fit m easures ... 54
Table 4-7 Squared Multiple Correlations for Endogenous Variables...54
Table 4-8 Coefficients for Public Transportation Trips...55
Table 4-9 Coefficients for Private Transportation Trips ... 56
Table 4-10 Total Effects for Public Transportation Trips...57
Table 4-11 Total Effects for Private Transportation Trips ... 58
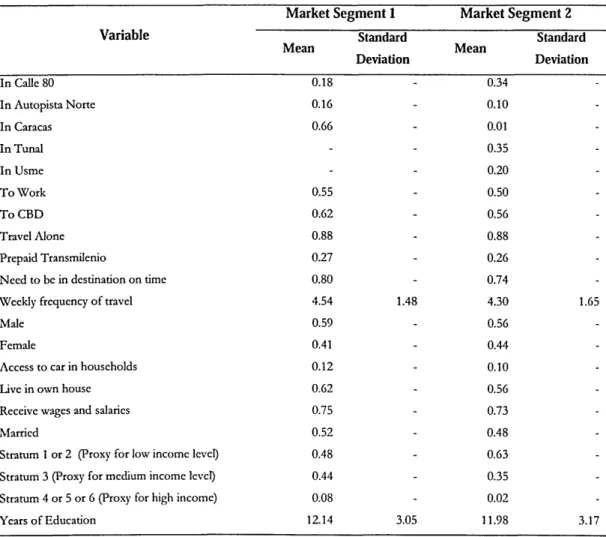
Table 5-1 Main Characteristics of Travelers by Market Segments ... 64
Table 5-2 Attributes of Transmilenio by Market Segment ... 65
Table 5-3 Attributes of Traditional System by Market Segment...65
Table 5-4 Estimation Results for the Pooled Model on Market Segment 1 ... 68
Table 5-5 Trade-Offs Between Different Attributes for the Two Modes...69
T able 5-6 P oint E lasticities ... 70
T able 5-7 Point E lasticities (Continued)... 71
Table 5-8 Characteristics of Travelers in Market Segment 1 by Area of Influence ... 73
Table 5-9 Attributes of Transmilenio by Proximity to Specific Corridor in Market Segment 1 by A rea o f In fluence ... 73
Table 5-10 Attributes of Traditional System by Proximity to Specific Corridor in Market Segm ent 1 by A rea of Influence ... 74
Table 5-11 Estimation Results Market Segment 1 by Area of Influence...75
Table 5-12 Trade-Offs Between Different Attributes for the Two Modes in Market Segment 1 by A rea o f In fluence...75
Table 5-13 Characteristics of Travelers in Market Segment 1 by Level of Wealth ... 77
Table 5-15 Attributes of Traditional System by Market Segment by Level of Wealth...78 Table 5-16 Estimation results by wealth on Market Segment 1 by Level of Wealth ... 79
Table 5-17 Trade-Offs Between Different Attributes for the Two Modes in Market Segment
1 by Level of W ealth... 80
Table 5-18 Characteristics of Travelers in Market Segment 1 by Opportunity Cost of the T rip ... 8 1
Table 5-19 Attributes of Transmilenio in Market Segment 1 by Opportunity Cost of the Trip
... 8 2
Table 5-20 Attributes of Traditional System in Market Segment 1 by Opportunity Cost of th e T rip ... 8 2
Table 5-21 Estimation results for model in Market Segment 1 by Opportunity Cost of the T rip ... 8 3
Table 5-22 Trade-Offs Between Different Attributes for the Two Modes in Market Segment
1 by O pportunity Cost of the Trip... 84 Table 5-23 Estimation results on Market Segment 2... 86
Table 5-24 Trade-Offs Between Different Attributes for the Two Modes in Market Segment 2 ... 8 6
1 Introduction
After 50 years regulating the public transportation system, the government of Bogoti carried out an ambitious plan modifying the organizational scheme of service delivery, raising the level of service, and ultimately affecting travel behavior. A new Bus Rapid Transit (BRT) network known as "Transmilenio" was implemented in three of the main city
corridors. The Transportation Research Board's Transit Cooperative Research Program TCRP A-23 defines this technology as:
"BRT is a flexible, rubber tired rapid transit mode that combines stations, vehicles, services, running way, and ITS elements into an integrated system with a strong positive image and identity. BRT applications are designed to be appropriate to the market they serve and their physical surroundings and can be incrementally implemented in a variety of
environments. In brief, BRT is a permanently integrated system of facilities, services, and amenities that can collectively improve the speed, reliability, and identity of bus transit. In many respects, BRT is a rubber-tired light rail transit (LRT), but with greater operating flexibility and potentially lower capital and operating costs."
In addition to the operational characteristics, the implementation of BRT in Bogots runs under privately contracted operations. The contracts do not include provisions for
operational subsidies and the system's revenue is meant to cover all the operational costs. The new system competes with the existing service operated by privately owned and operated buses in mixed traffic. The two systems compete along three specific corridors, while in the remaining areas of the city; the buses operating in mixed traffic are the only public transport alternative. These new arrangement in the supply of public transport (e.g., infrastructure, operational and organizational) imply several transformations, among them:
" Behavioral: Transmilenio now captures an important share of the transit market and presumably attracts some car users. It offers a higher level of reliability, information, and security in comparison to the old system.
* Economical: from a passenger-trip to a service-based revenue stream; from a business where the city government had no direct profits to one where it shares part of the revenue; from a production system where productivity was hardly an issue at the firm management level to one where it is paramount to its survival.
* Political: from a weak and unaccountable public agency to one highly regarded by the citizens, accountable to public scrutiny and government controls; from a dispersed, weak, and unaccountable private sector to a more cohesive and productive
transportation industry; from a rival relation between the government and the private sector to one where trust, cooperation and collaboration are key.
Thus far, no study known to the author has analyzed in detail the relationships emerging from the changes in the supply of public transportation in Bogotd. Although it may be too early to be conclusive about the effects of the BRT, the majority of the studies have looked at its major impacts. For instance Hidalgo (2002) quantified some of the impacts at the aggregate level; he showed that pollution levels (SOx, NOx, an PMIO) measured in the vicinity of the main transit corridor have dropped, accidents and crime rates have declined, and travel time, for those using the new system, has been reduced by 32% while 83% of users declared that the main reason why the use the new system is time savings. He also emphasized that accessibility, consistency, and affordability are all important attributes. Montezuma (2002) looked at the system from an even wider perspective analyzing the transformations in the politics of the city, and how these changes have affected the mobility of the population. However, no study has looked in detail at the changes in travel behavior and how these might affect the future development of the system and the competing relationships between the public transportation modes. An ideal setting to conduct such a study would be a before-and-after evaluation that could link the transformations to changes in travel behavior. Unfortunately, a clear picture of both situations is not available and therefore I propose the analysis of the existing pieces of data to understand first, how travel behavior has changed and second, what are the implications of these modifications.
The introduction of the new transportation mode has consequences for automobile and transit users; while the former see how a neglected alternative (public transportation) raises its level of service and could become a viable possibility; the latter experience an increase and improvement of their options. Hence, Transmilenio entails a shift from a position of captivity to one of choice inasmuch as it constitutes, to a certain extent, a new alternative for all users.2 This study, however, will exclusively look at the behavior of transit riders; the response of automobile drivers is out of the scope because of lack of data and the difficulties to isolate the effect of other significant factors.3
In particular I will examine, to what extent Transmilenio has improved the conditions of public transportation travelers by comparing several behavior indicators. Underlying such examination is the question of whether Transmilenio constitutes for the travelers a new transportation mode vis-i-vis the incumbent. The main benefit is represented by savings in travel time. In fact, these have been seen as the ultimate goal and reason of the
transformation; as presented in Transmilenio (2000) these savings are instrumental in shrinking the gap between auto users and the majority of the population that use public transportation. In addition time savings free up time for productive activities like sharing time with family and friends, working, or studying. Savings in travel time constitutes the main gain but a further investigation of the way travelers value travel time provides
additional and relevant insights that are worth studying. In this regard this thesis is meant to answer the following specific research questions:
1. What are the determinants of the choice between the two public transportation
modes?
2. To what extent has Transmilenio modified travel behavior?
3. Are benefits and changes in travel behavior uniformly distributed among all public
transportation users?
4. What are the challenges and opportunities that the new institutional arrangement will face given the new travel behavior?
2 Although existent and accessible, public transport was not an actual option for automobile drivers; in fact
public transportation hardly attracted any non-captive riders.
3 The installation of car restraining measures like "pico y placa" since 1998 modified the utilization of the private automobile irrespective of the introduction of the new mode.
Although pertinent for Bogoti and the development of its public transportation in the near future, this research is also relevant for cities looking at this experience as a way to solve different issues related to public transportation. Several cities in the developing world share many of the characteristics of Bogota; in particular the captivity of public transportation riders, the high inequality between car users and transit users, and the incumbent character of small operators. The success of Transmilenio in addressing those issues has renewed the interest for Bus Rapid Transit, initially driven by the well-known case of Curitiba, Brazil and the lesser-known experience of other Brazilian cities and Quito in Ecuador. Transmilenio however, has surpassed the existing BRT systems in terms of its high capacity, thus questioning some of the figures typically calculated for bus systems and challenging more expensive alternatives like light and heavy rail systems (World Bank, 2002, Kuhn, 2002, Leriverend, 2002,) Despite the differences in the economic and political circumstances between cities in the developed world and Bogoti, academics and policy makers in the US and Europe have also considered this technology for future expansions of their respective transit systems (Federal Transit Administration 4, Jarzab et. al 2002, Polzin and Baltes, 2002,
Carey G. 2002). Furthermore BRT systems have entered the sustainable transport discourse as an alternative to the growing motorization occurring in developing countries
(Gakenheimer, 1999) and dominating the transportation panorama in most of the developed world.
This thesis is organized in five chapters:
a) The first chapter presents a history of public transportation in Bogoti starting with the description of the first formal public transportation service and ending with the current circumstances in the city. The chapter is descriptive in nature and its goals are to
introduce the historical context where the changes are taken place and to identify the key actors in the transportation sector.
b) The second chapter provides the analytical framework for the study; it describes the
general methodological approach and presents the techniques used to study travel
behavior, namely: Structural Equations Modeling and Discrete Choice Models. It is meant to serve as a guide for understanding the following chapters rather than a comprehensive presentation of the techniques. In the text, there are references to relevant works in the respective topics.
c) The third chapter explores the fundamentals of travel behavior using Structural Equations Modeling and data from the1995 Household Survey conducted for the Transportation Master Plan for the City (ICA, 1996). Its objective is twofold; first, to uncover the main forces acting on the travelers; and second, to explore how the changes brought about by Transmilenio could have operated under such circumstances.
d) The fourth chapter analyzes the current situation from the standpoint of the public
transportation rider vis-A-vis the competition between the two public transportation modes (i.e., the old traditional system and the new BRT). The objective is to understand how the introduction of Transmilenio has changed travel behavior and the new tensions emerging between the competing modes. The methodological approach for this analysis is Discrete Choice Modeling and the data come from a revealed preference survey conducted by de Department of Transportation Planning of Transmilenio S.A. in May of 2002.
e) The fifth chapter concludes the analysis with the main consequences emerging from the findings of the previous chapters. It summarizes the main findings and provides answers to the research questions aforementioned. In addition if provides policy
2 The Historical Context of Public Transportation in Bogotai
2.1 Public vs. Private delivery of the service: competition on and off the
road (1884
-
1951)
In 1884, the first public transportation service was delivered in Bogoti connecting over a 5 km horsecar line the old colonial center to the wealthiest north suburbs (Mejia,
1998) '. The service was contracted out to the American firm "The Bogoti Railway
Company "and given the right to operate the cars and collect the revenue after a fixed annual payment to the city. The operator defined fares and frequencies, and decided vehicle
characteristics, stops, and schedules. The government, on the other hand, was responsible for paving the roads and installing the fixed guideways. The first service extension came eight years later in 1892 when a second line connecting the city center with the main railway station was built.
The prosperity of the business, the fact that the government was receiving a meager fraction of the revenues while paying for the infrastructure, and the pressure from the community after years of bad service; all these factors invigorated by the conflict between the U.S. and Colombia over Panama, resulted in the nationalization of the American company in 1910 (Mejia, 1998, Castafieda, 1995). This year marked the start of the first public transportation company in Bogoti; for this purpose, the City Council was given the direction of the company and consequently routes, frequencies, line extensions and vehicle acquisition were decided in politicized meetings. In the same year, the first electrically powered streetcar started operations and by 1920 the trolley lines covered 27.1 kilometers.
By 1922 the whole network was electrified resulting in better frequencies and schedule
adherence while keeping the fare at the same level. The annual ridership increased from 8 million riders in 1921 to 12 million in 1922 (Castafieda, 1995). Simultaneously, the first buses were appearing along with an increasing number of automobiles; between 1922 and
1927 the former increased by 371% and the latter by 115% (Castafieda, 1995).
s Since 1870 omnibus services between BogotA and the neighboring towns of Chapinero and Facatativa were provided, however those services can be categorized as inter city rather than "urban" services.
The increase in the number of buses has been associated with the growing number of "blue-collar" neighborhoods unserved by the trolley lines (Jimenez, 1985). The buses were initially organized in informal routes but by 1925 private entrepreneurs started asking for formal permissions. Although the City Council first denied these petitions claiming that the city revenue would be threatened, it eventually granted approval and the buses started running undermining the monopolistic position held by the trolley for 15 years. Responding to the competition, the City started a public bus company as a branch of the existing agency. The government not only competed with a new service, but through new regulation
imposing fines to those buses circulating close, or on the same streets as the public services. Notwithstanding the government response, the private service grew resulting in a net drop of the trolley's market share in favor of the bus (in 1927 the trolley moved 80% of the daily trips but by 1939 only 50% (Castafieda, 1995)). On the road, the competition was in favor of the private buses because of the driver's profit oriented practices (driver's and owner's revenue depended on the number of passengers). On the other hand, the drivers of the public agency buses were securing a salary regardless of the number of passengers
transported. Neither the public agency nor the private buses delivered a good service; the former suffered the effects of the competition and struggled to cope with higher production costs and lower revenues and the private buses were not interested in the level of service (they have a monopolistic position in may areas of the city), but arguably only in increasing their revenues while maintaining low costs. Castafieda (1995) reports many claims
denouncing the bad level of service provided by the two modes.
Notwithstanding the private sector market competence on the road, the government still dominated most of the market through regulation and enforcement. Responding to that situation, representatives of the private operators eventually got elected to the City Council and presumably legislated in their favor. Tangible results emerged from this new situation; additional routes were authorized, roads were constructed on the outskirts of the city and the tax imposed on passenger trips, the only source of government income from the privately operated buses, was reduced (Castafieda, 1995). The presence of transportation sector representatives continued to be relevant in the city council until the end of the 1990s when the decentralization and democratization process over-rode their existing cientelistic behaviors, as suggested by Donovan (2002) in regards to public vendors similarly organized to public transport providers.
The 1940s saw the decline of the trolley and the public bus company. The turning point came in 1948 after the general chaos known as "El Bogotazo", when the mob, incited by the assassination of a popular political leader destroyed trolley lines, cars, and buses owned by the city. Three years later, in 1951 the trolley service disappeared and gave birth to an all-bus public agency with 124 buses operating in 10 routes. The publicly served network had to compete with 643 buses organized in 16 routes (Castafieda, 1995). The Public Agency operated large buses (55 seats) while the private strategy did it with smaller and faster
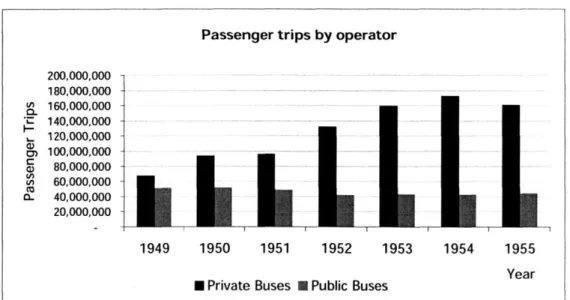
vehicles of less than 35 seats. These smaller vehicles responded efficiently to the market desires, mainly to the needs of middle-class workers to commute faster to their jobs. In addition, small vehicles were cheaper and easier to acquire by a growing number of bus owners. This new picture of the transportation system is represented by the development of market share during the first five years of the 1950s as shown in Figure 2-1.
Figure 2-1 Annual passenger trips by company type
Passenger trips by operator
200,000,000 180,000,000 U 160,000,000 0. * 140,000,000 L 120,000,000 100,000,000 80,000,000 60,000,000 -0- 40,000,000 20,000,000 -1949 1950 1951 1952 1953 1954 1955 Year
E Private Buses N Public Buses
Source: Data taken from Castafieda W. (1995) Transporte P blico Regulaci6n y Estado en Bogoti 1882-1980. CEAM, Universidad Nacional de Colombia, IDCT, Bogoti.
2.2 The public sector from competitor to regulator (1951
-
2000)
The first years of the 1950s were a clear picture of the development of the public transportation market after the trolley company was terminated and the competition between the public and private buses began. By the 1980s, the market share of the public
company was roughly 1% (Mohan, 1994) and in 1992 the public company eventually went out of business. By contrast, the private provision of public transportation grew rapidly and strongly. In this section I will describe some of the factors explaining this process and why several attempts by the city to regain power and reform the sector failed.
2.2.1 Urbanization
The urbanization process spurred by a growing population demanding housing and transportation services is the first factor explaining the growth of public transportation in the city. Table 2-1 registers the population, city area, and the corresponding annual growth rates for selected years from 1951 to 1998.
Table 2-1 Population and Area Growth in Bogoti between 1951 and 1998
Area Annual Equivalent Growth Rate
(Hectares) Population Area
1951 (i) 658,236 NA -1958 (ii) 1,130,000 8,084 7.98% -1964 (i) 1,730,000 14,615 7.36 % 10.37 % 1973(i) 2,877,000 30,423 5.81 % 8.49 % 1978(i) 3,500,000 30,866 4.00 % 0.30 % 1985(ii) 3,937,014 31,052 1.70 % 0.08 % 1993 (iii) 4,922,825 NA 2.84 % 1998 (iv) 6,319,396 NA 5.11 %
(i) Mohan R. (1994), Understanding the Developing Metropolis, Lessons from the City Study of Bogoti and Cali, Colombia. World Bank, Oxford University Press, New York.
(ii) Montezuma (1996), El transporte Urbano de Pasajeros en Santafe de Bogota, una compleja estructura donde la responsabilidad final es asumida por los propietarios y por los conductores, in Montezuma R., Merlin P., Lablec J.C., Villalante M. (eds) El Transporte Urbano: Un desafio para el Pr6ximo Milenio. CEJA, BogotA.
(iii) Departamento Administrativo Nacional de Estadisticas, Censo 1993 (iv) Departamento Administrativo de Planeaci6n Distrital, Projected 1998.
Between 1951 and 1998 the population experienced almost a ten-fold increase. This growth developed in phases; the rapid population growth of the 1950s and 1960s is usually associated with migrants from the countryside escaping from the violence in rural areas. During the same decades the road network was extended and affordable housing projects were developed. The 1980s were characterized by lower growth rates but the 1990s
experienced considerably higher growth rates. From the mid 1990s to date, a migration phenomenon similar to the one of the 1950s is occurring as the violence has risen again in the countryside displacing a large number of people to urban areas.
Some authors (Montezuma, 1996) suggest that during the first 30 years of the second half of the century, the housing and the transportation sectors grew hand-in-hand, in
particular concerning irregular housing developments. Those settlements were often served
by public transportation before they could access other services like water, electricity, or
sanitation. Transportation was delivered by small operators presumably associated with the developers; not surprisingly several neighborhoods in the city bear the name of
transportation companies. The outcome of the urbanization process generated a demand for a larger bus network and defined the geography of the trips; from the poor and middle-class neighborhoods located at the outskirts of the city where cheaper land was available or where squatting occurred, to the center where the jobs and services were concentrated. The higher income levels although moved northwards remain close to the Center Business District.
Arguably, the exclusive provision of public transportation by the government would not have sufficed to cope with the demand growth of the second half of the 20" century. Experiences from cities in other developing countries show that formally, through contracts, or informally, the private sector has replaced the state as the main provider of public
transportation (Gwilliam 1997). The first section of this chapter showed that the government did not provide adequate service over the first half thereby creating the opportunity for private initiatives responding to the unmet demands. The next section describes how these opportunities were materialized by a growing industry.
2.2.2 Firm Evolution
Although legally constituted as firms, the providers of public transportation from its inception lacked many characteristics of what is conventionally consider a transportation
company. That is, firms were not controlling, either by direct production or contracted services, the unified ownership, operation, and maintenance of equipment, facilities and services (Salvucci et. al, 1997). The resulting structure emerged from the firm's origins; some authors, like Castaiieda (1995), argue that the cooperative structure promoted in the mid
1930s, lowered capital investments through shared vehicle ownership and tax benefits. This entry scheme defined the firm as an intermediary between the government and the bus owners, and not as a transportation firm insofar as the firms only functioned to gain approval for the operation of the vehicles and routes but not to produce transportation output. This structure produced a business structure as depicted in Figure 2-2. 6
Figure 2-2 Organizational structure of transportation firms in Bogotdi
6 The model used to describe organizational schemes in public transport is taken from VAN DE VELDE D.M. (1999) Organisational forms and entrepreneurship in public transport Part 1: classifying organisational froms. Transport Policy 6
(1999) pp. 147-157. The shaded boxes are activities that are carried out jointly by at least two parties. The vertical text is the
process through this joint procces is carried out.
Actors
Firms
Vehicle
Drivers
Three actors comprise the prevailing organizational structure; the "afiliadoras" the bus owners, and the bus drivers. In the first level, the "afiliadorag', are intermediaries between the government and the bus owners. Its chief role is the affiliation of vehicles and their function is to gain governmental approval for routes and guarantee a level of service delivered by a fixed number of vehicles. Notwithstanding the agreement, no contract
between the government and the firms is involved. To maximize its profit, "afilidoras" had to affiliate bus-owners into the company and assure the approval for as many routes as
possible. The affiliation usually involves purchasing one of the fixed number of slots approved by the authority
("cupos")
(1995 US$ 2,300 to 4,600), an affiliation fee (1995 US$100 to 600), and a monthly fee (1995 US$ 35 to 50)7, and entailed authorization tooperate on a certain route. Hence, the firms constantly sought for routes and vehicles; in addition, the longer the route, the greater the number of vehicles that could be requested to the authority. As an example, Sagaris (2001) recently interviewed the director of one the largest firms in the city and reported that the firm was a 40 years old family business running 1200 buses, 100 owned by the family and the remaining 1100 by affiliates.
In the second level, the bus owners, maximizes its profits by minimizing the variable cost and maximizing their revenue by means of passenger trips served. The common
strategy in this tier is to cut on vehicle maintenance and labor costs. Typically, all the revenue is collected by the owner and later shared with the driver. At the end of the month, the
corresponding affiliation fees are paid to the upper level.
The third level, the drivers, is comprised by an undetermined number of individuals with the daily responsibility of delivering the service. Their income comes directly from the production of transportation output through one of many documented types of agreement between owners and drivers (Montezuma 1996, Lanzetta de Pardo et. al, 1988, Mohan, 1994) whereby to maximize the drivers' profit they have to maximize the number of passenger trips served. Historically, there has been an unlimited supply of labor for drivers hindering the possibility of developing a stronger group and leveraging their position in the business.
7 All numbers are from Montezuma R., (1996) El transporte Urbano de Pasajeros en Santafe de Bogoti, una
compleja estructura donde la responsabilidad final es asumida por los propicatarios y por los conductores, in Montezuma R., Merlin P., Lablec J.C., Villalante M. (eds) El Transporte Urbano: Un desafio para el Pr6ximo Milenio. CEJA, Bogota.
On the other hand, almost all drivers want to evolve into bus owners, in fact one could argue that the ladder is clearly established and many drivers have succeeded in becoming the chiefs of the "afiliadoras" while owning several buses. In the late 1980's Lanzetta de Pardo et. al (1988) described the socio economic characteristics of drivers and found that those owning a vehicle have spent several years as paid operators. More recently, Montezuma
(1996) encountered the same kind of ownership path in the mid 1990s; he calculated an
average of nine years of savings from wages as a driver to be able to purchase a vehicle. Both studies, in different points in time, identified some of the most common practices carried out by the actors in the business. Small owner-operators choose not to affiliate to social security, avoid declaring earnings to city officials, and circumvent regulations in order to maximize profits. Typically, workers find ways to increase their low wages by under-the-table practices such as modifying the number of passengers transported by shift. Nevertheless, the transportation industry has generated a large number of jobs especially for low skilled labor. Montezuma (1996) and Mohan (1994) reported that despite the harsh working conditions, driver's wages were higher than the minimum wage.
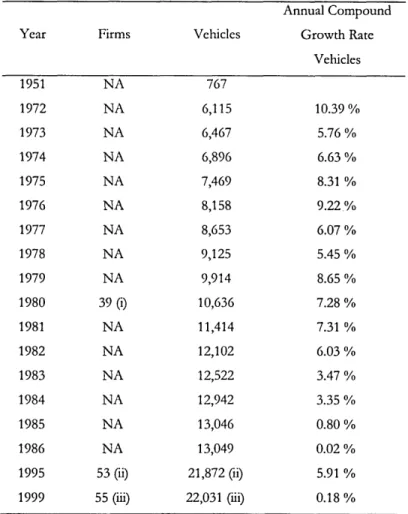
The abovementioned conditions created the incentives for people to enter the business, and partially explain the growth in the size of the sector. The direct result is a dispersed market with many firms (55), vehicles (22,000), vehicle owners (23,000), and drivers. The data on the number of buses and routes in the city is not very reliable and the official records are poorly kept. Table 2-2 shows the growth of the sector from 1951 to the year 1999.
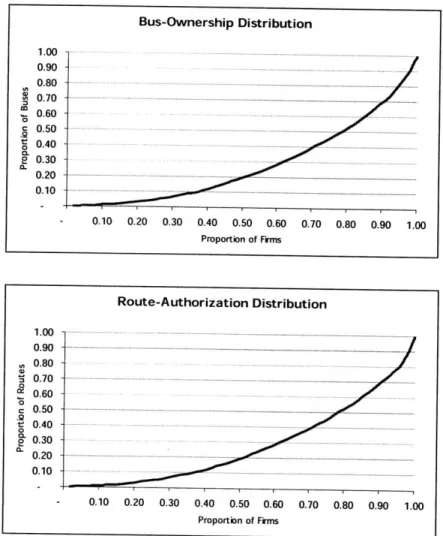
To study the degree of dispersion within the industry, Gini coefficients were calculated to evaluate bus-ownership and route-authorization distribution among the firms as of 1999. For bus-ownership the Gini coefficient was 0.437 and the ratio of the biggest (8.93%) to the smallest (0.04/) firm was 207. Notwithstanding this seemingly high value, the sector enjoys a fairly good distribution of vehicles among firms. In the case of
route-authorization, the Gini coefficient was 0.441 and the ratio of the biggest (10.02%) to the smallest (0.16%) was 63. It is not surprising to found that the two biggest firms by number of vehicles coincide with the two biggest firms by number of routes. The two distributions are very similar; in fact the two measures of concentration are highly correlated (0.899).
Table 2-2 Growth of Public Transportation Fleet.
Annual Compound
Year Firms Vehicles Growth Rate
Vehicles 1951 NA 767 1972 NA 6,115 10.39% 1973 NA 6,467 5.76 % 1974 NA 6,896 6.63 % 1975 NA 7,469 8.31 % 1976 NA 8,158 9.22% 1977 NA 8,653 6.07 % 1978 NA 9,125 5.45% 1979 NA 9,914 8.65% 1980 39 (i) 10,636 7.28 % 1981 NA 11,414 7.31 % 1982 NA 12,102 6.03% 1983 NA 12,522 3.47 % 1984 NA 12,942 3.35% 1985 NA 13,046 0.80 % 1986 NA 13,049 0.02 % 1995 53 (ii) 21,872 (ii) 5.91 % 1999 55 (iii) 22,031 (iii) 0.18 %
Source: Castauieda W. (1995) Transporte Pdblico Regulaci6n y Estado en Bogoti 1882-1980. CEAM, Universidad Nacional de Colombia, IDCT, Bogoti. Except:
(i) Mohan R. (1994), Understanding the Developing Metropolis, Lessons from the City Study of Bogoti and Cali, Colombia. World Bank, Oxford University Press, New York.
(ii) Montezuma R., (1996) El transporte Urbano de Pasajeros en Santafe de Bogota, una compleja estructura donde la responsabilidad final es asumida por los propieatarios y por los conductores, in Montezuma R., Merlin P., Lablec J.C., Villalante M. (eds) El Transporte Urbano: Un desafio para el Pr6ximo Milenio. CEJA, Bogoti.
Figure 2-3 Distribution of Buses and Routes per firm "aliliadora"
Bus-Ownership Distribution 1.00 -0.90 -0.80 S~
0.70 .. .... .... .. ... 070 0.50 0. 2 0.30 0.20 .. . 0.10 -- - --- . - 0.10 0.20 0.30 0.40 0.50 0.60 0.70 0.80 0.90 1.00 Proportion of FirmsThe large and dispersed sector influenced the level of service in contradictory ways. On the one hand, coverage and frequency were good attributes of the service but travel time, reliability, security, and comfort were attributes where the system failed to provide a good service. In addition, it produced congestion, unsafe conditions on the roads, and pollution due to the low maintenance of the engines and elevated age of the vehicles.
Thus far, only the service being delivered under legal conditions has been described, in addition, a number of vehicles deliver service in several areas of the city without any
affiliation to authorized firms or approval from the government. The number of this type of vehicles often referred as illegal, informal, or "pirates", is only speculative; according to a
23
-
union of small public transportation providers the number is 20,000 vehicles. 'Although their influence is relevant for some areas of the city they will remain out of the scope of this thesis due to lack of reliable information or documentation. However, their existence is significant inasmuch as it shows that even with a very large number of buses and routes, some demands are still unmet.
2.2.3 The Role of the Government
The third factor is the role of the government vis-i-vis the demands resulting from rapid urbanization and a strong but rather scattered transportation industry. After 1951 the city's involvement in transportation started to shift from regulator/competitor to exclusively regulator. The shift was completed by 1992 when the publicly owned company stopped operations after many years of a service that capture less than 1% of the market. During those 40 years, the government sought to improve the service by regulating firm structure, setting standards for the operation of vehicles, and later by creating barriers for entry of new firms and new vehicles Those efforts were mostly futile, the main reason being the character of the firms; these were never strong entities and the atomization of the sector hampered the success of the government attempts to gain control. By the early stages of formation of the industry, the two most frequently mentioned obstacles to improve the service, namely, the lack of transportation firms and the semi-formality of the business were already identified (Castafieda, 1995). Yet fifty years later, those two factors are still seen as the main obstacle faced by the government to improve level of service.
The first attempt to modify the business structure during the second half of the century came with the enactment of the Law 15 of 1959. Earlier, that same year the operators arguing that the farebox recovery did not cover their operational costs asked for an increase, a measure that was heavily opposed by the population. In response, the
government opted for an operational subsidy through the enactment of the law giving power to the national government to intervene in local matters concerning the provision of public transportation. The law allowed the national government to define the organizational structure of the firms, minimum capital investments, and strict regulation concerning wages
and benefits. Notwithstanding these objectives, the law's only tangible result was the
creation of the subsidy because the requirements and standards of service never materialized.
A flat monthly subsidy was paid by the national government to the firms, which in turn
distributed among their affiliates.
Some authors (Pach6n, 1981, Mohan 1994) describing the situation in the late 1970s and early 1980s, argued that the subsidy had a net positive effect because the city enjoyed a high level of transportation at low social and private costs and allowed the poor to have better access to transportation. Another relevant effect of the subsidy was to foster investments in newer vehicles by paying higher subsidies to the owners of the newer vehicles. They also analyzed the effect of the subsidy over the real service provided, encountering that it was not significant, by contrast others (Acevedo, 1988) found that the subsidy indeed created the incentives for reducing the service, therefore cutting costs while maintaining a fixed revenue through the subsidy. The main argument is that neither the firms nor the government had effective controls for monitoring bus operations. Whatever the case, Castafieda (1995) points out that by 1983, the subsidy became a major burden to the national finance and consequently started to be dismantlement by creating a level of service known as "Transporte Sin Subsidio", buses operating without the subsidy but with the same
fare as the subsided vehicles. Yet, these buses did not comprise the first service operating without subsidies; earlier in 1975 the government authorized a new level of service called
"buseta "charging a fare 2.5 times the bus fare. The service was intended to serve a segment
of the market with higher incomes by offering buses of lower capacity (28 seats) and assuring that a seat was always available (i.e. standees were not allowed). These minibuses turned out to be very profitable and thereby this level of service witnessed an extraordinary growth during the 1970s. Later in the 1980s and the 1990s the government created new level of services with differentiated fares and by 1998 the supply of transportation was comprised
by approximately 10 different vehicle and service types, from minibuses of 13 seats to large
buses that could carry 100 passengers. This strategy, although adequate in terms of price segmentation, exacerbated the atomization of the sector by including yet another factor of division; that is the vehicle-service type.
The other dimension where the role of the government can be analyzed is in the planning process for a mass transportation system. The first attempt dates back to 1947, in total there have been more than 10 plans to implement a heavy rail solution to the
transportation demand, the last one being carried out in 1997. Ardila (2001) argues that the main reasons for the failure of those plans were the lack of political and financial realism, lack of organizational capacity to carry on the plan, and the failure to understand that implementation was the driver of the plan.
Despite the failure to provide a rail-based solution, the city, inspired by the experience of Curitiba and other Brazilian cities, developed between 1988 and 1992 an exclusive bus lane on its main transit corridor "Avenida Troncal Caracas" (Acevedo, 1996, Ardila 2001). Only the existing larger buses operated in this corridor while smaller buses were relocated to parallel roads. In total, the busway extended for 16 kilometers and accommodated more than 200 bus routes (Rodriguez and Ardila, 2002). This trunk corridor became the core of the transportation system recording passenger flows per hour per direction of 36,000 in the year
1999 (Steer Davies Gleave, 1999, Ardila and Rodriguez, 2000) and offering a considerably high speed of 24 km/hr (15 mph) in comparison to the city average of 9km/hr (5.6 mph)
(Rodriguez and Ardila, 2002). Nonetheless, the service was regarded as poor and the corridor became one of the most hated, unsafe, polluted, and congested venues of the city.
A previous work by Ardila and Rodriguez (2000) studies the duality between high passenger
throughput and poor service. Negative impacts over the vicinity of the corridor were strong; real estate prices plummeted, crime rates were high, and the surroundings were in an overall decline.
It is often argued by some of the Brazilian and Colombian engineers that participated in the planning process of the "Troncal Caracas" that it did not reach all its goals because the homework was never fully finished. The plans for the construction of terminals and the development of a feeder network never came to completion. In addition, adherence to the operational scheme never materialized because the monetary incentives of the business were not modified; still the driver's revenue came from the number of passenger-trip served creating the incentive to pick up passengers wherever they were demanded and not where it was established by the designs9. Rodriguez and Ardila (2002) reinforcing this opinion, state that the inadequate institutional arrangement determined by large the operation of the vehicles in the trunk corridor and thereby the level of service. From 1992 to 1998, plans to
9 Between 1999 and 2002, the author conducted interviews with engineers and planners that took part of the design of Troncal Caracas.
improve and expand the busway system failed due to the same reasons that Ardila (2002) argued in regards to the heavy rail plans. Notwithstanding its negative connotations, the first exclusive bus lane experience was worth in at least two ways; first, it prioritized road space for the buses producing higher speeds and passenger throughputs; and second, it provided knowledge about the drawbacks and backlashes of a poorly managed busway.
By the end of the 1990s the public transportation system reached a situation
characterized by a weak government in transportation matters, a disperse industry with serious financial issues, and a large number of captive riders subject to a poor level of service. Under these circumstances, Enrique Pefialosa started his tenure as Bogoti's Mayor having amongst his goals a total revamp of the mobility policy with Transmilenio as its flagship. Transmilenio was the cornerstone of a policy that conveyed to the population that a mobility strategy based on the private automobile was not sustainable. The policy aimed at building a consensus around the need for the recuperation of public spaces, a restrain to the private automobile utilization, the improvement of parks, construction of bicycle paths, and the redistribution of road space such as to prioritize public and non-motorized modes of transportation.
2.3 Transmilenio
Transmilenio is a Bus Rapid Transit network that builds on the experiences of other busways in Latin America (e.g., Curitiba, Sao Paulo, Quito) although designed to manage substantially higher passenger flows. Curitiba busway's highest peak-hour, peak-direction, demand is approximately 11,000 (Levinson et. al, 2002) while Transmilenio is designed for
35,000 passengers per hour per direction (Steer Davies Gleave, 1999) and is currently
managing demands of around 25,000 (Levinson et. al, 2002). The ultimate objective of the new system is to raise the level of service of transit as an instrument to improve the sustainability and productivity of the city. The underlying reason is that time savings for transit users (the majority of the population), reduce the levels of inequality between those that own vehicles and those who do not, in addition it frees up time for productive activities like studies, work, or family time (Transmilenio, 2000).
Its creation entailed a new transit agency, the construction of new infrastructure, and the development of a business structure whereby the existing providers of public
transportation could still operate but under a different organizational scheme. The new public agency, called Transmilenio S.A., is now in charge of planning and administering the
system. The new construction was publicly financed and consisted of exclusive bus lanes, bus stations, bus terminals, and bus depots. The main change however, occurred in the
economic incentives of the business; while in the past, the operator's revenue came directly from the number of passengers transported; now it comes from a fixed cost per kilometer subject to constraints dictated by level of service premises. The providers are selected after a tendering process that evaluates their experience, financial capabilities, and price offer. Currently most of the providers correspond to consortiums formed by the "afiliadoras". The revenue is shared between the agency, the transportation providers, a contractor that takes
care of the fare collection system, a fiduciary that makes sure that the revenue is properly distributed, and other contractors that maintain and clean the facilities. The system is operational on its first phase consisting of: 10
* 39 Kilometers of Exclusive Bus Lanes
* 57 Stations * 4 Bus Terminals * 4 Bus Depots * 470 Trunk Vehicles * 12 Trunk Routes * 241 Feeder Vehicles * 39 Feeder Buses
As argued by Rodriguez and Ardila (2002), two characteristics of the system implementation makes it very attractive as a model to replicate, first its piecewise
development allows operations to start even when the whole system is not fully completed; and, second its low cost in comparison to mass transportation solutions based on rail, makes it affordable for many cities. Construction costs are summarized in Table 2-3.
Table 2-3 Cost of construction of Transmilenio - First Phase
Element Total Cost Cost per Kilometer of
(2000 US$ Millions) Exclusive Bus Lane (2000 US$ Millions) Trunk Corridors 94.7 2.5 Bus Stations 29.2 0.8 Bus Terminals 14.9 0.4 Access to Stations 16.1 0.4 Bus Depots 15.2 0.4
Operations Control Center 4.3 0.1
Others 25.7 0.7
Total 198.8 5.3
Source: El Sistema de Transporte Masivo de Bogoti. Subgerencia General de Transmilenio. Presented at the First International Seminar on Urban Transportation and Transmilenio, November 14, 2001.
After almost two years of operation the system carries on average 770,000 passenger-trips per weekday, of those approximately 400,000 make use of the integrated feeder-trunk system." The remaining demand for public transport (approximately 8 million daily trips) is still being served by the traditional system with buses operating in mixed traffic. This system did not experience any transformation on its business or operational practices as a result of Transmilenio. The changes however, came in two ways: First, the route network was modified, as Transmilenio's exclusive bus lanes required the relocation and/or cancellation of some routes. Second, the demand for the old system dropped and hence its revenue per vehicle. Despite the requirement for Transmilenio providers to purchase and scrap buses
from the traditional system, no substantial reduction of the fleet has been realized; this process is occurring but a very slow pace. The abundant supply of transportation in other corridors unserved by the BRT has caused congestion. There is no official measurement of these changes, but the union of small providers of public transportation argues that in parallel corridors there has been an increase in the travel time of around 10%."
" http://transmilenio.gov.co/Transmilcnio.htm Accessed on November 25th 2002
2.4 Conclusion
In Bogoti, the development of the urban transportation over the 2 0th century resulted in
a wide public transportation network serving a large, but mostly captive, demand. By the
1980s, researchers like Mohan (1994) showed that the provision of public transport was
efficient insofar as it offered a good service while keeping the social and private costs low. However, he pointed out that congestion was already affecting the level of service. Fifteen years later the situation was quite different; the number of vehicles experienced a two-fold increase and the congestion spread over the main corridors. In the year 2000, Transmilenio a new Bus Rapid Transit system, transformed the provision of public transportation creating a new organizational structure. It rests on a transformation of the operational scheme, and productivity of the system resulting in a better level of service for the riders. The improved service is meant to reduce the levels of inequalities in access and use of modes of
transportation and to free time that can be put into productive activities.
This new operational and organizational scheme coexists with the traditional mode operating in mixed traffic, and still capturing approximately 90% of the daily demand. Competition and cooperation between the two systems is likely to determine the way public transportation will develop in the near future. Moreover, when many of the "afiliadoras" (e.g., previous transportation providers) have evolved into the providers of Transmilenio; that is, many of these firms maintain economic interests in both sectors.
This chapter has described the three main actors in the public transportation system, namely the riders, the private providers of the service, and the government. The context provided so far is instrumental in understanding the findings of following chapters. They look at how the relationships between the actors have changed as a result of the
transformation of the status quo via raising the level of service and modifying the fundamentals of service provision.
3 Analytical Framework
The objective of this study is to analyze the consequences of the changes in travel behavior resulting from the introduction of a new public transportation mode
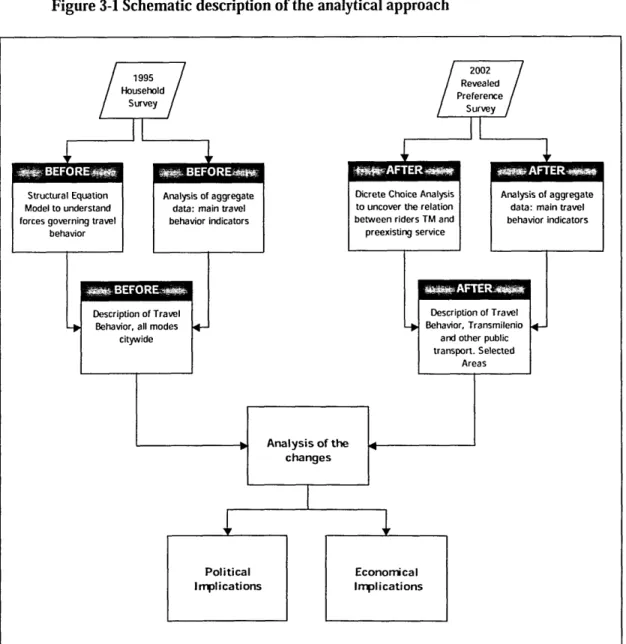
(Transmilenio) in a city in the developing world (Bogoti). The analytical approach can be seen as a three-step process whereby I first analyze the prevailing travel patterns before the transformations, then I study a partial picture of the current conditions quantifying some of the changes, and describing the competition between the existing public transportation modes; and finally, using travel behavior indicators I present the main consequences of the process of change and issue policy recommendations when appropriate. Figure 3-1 presents the approach adopted in this thesis.
The two data sets used for the purpose of studying the before and after situations differ in their sample size, objectives, and methods, and therefore the comparison is not
straightforward, only a few indicators can be directly compared. Instead I will use each survey for different purposes and try to link the main findings as a way to understand the changes. The first data set, the1995 Household Survey conducted for the Transportation Master Plan for the City (ICA, 1996) will be used to understand the main forces underlying travel behavior in the city. This understanding is key to evaluate the possible changes in travel behavior as a new and better transportation system comes into place. However the analysis will result in new hypothesis rather than in proven facts. Some of those hypotheses will be tested, at least indirectly, through a look at the current situation. The "after" situation is described by a second data set, a revealed preference survey conducted by Transmilenio
S.A. in May of 2002. The analysis of the after situation will look at the competition between
the two public transportation modes; the incumbent traditional service delivery as described in the historical context, and the new mode described in the second to last section of the same chapter. In particular I will use the concept of value of time as a way to understand the changes and test the hypotheses proposed as a result of the first analysis.
In consequence, this chapter presents a summary of the two methodologies used in this thesis namely, Structural Equation Modeling and Discrete Choice Analysis; presents a literature review on the underlying forces of travel behavior and discusses general issues in regards to the subjective value of travel time.
Figure 3-1 Schematic description of the analytical approach
L7 7~ :141
Dicrete Choice Analysis
Description of Travel Behavior, all modes
citywide
Political Economical
Implications Implications
3.1 Structural Equation Modeling (SEM)
Travel behavior can be measured by a variety of indicators, which in turn may be caused
by many variables. Thus, a study of the governing forces underlying travel behavior requires
a method that can handle a variety of variables and relationships. Structural Equation Modeling (SEM) is a viable method because it is able to capture the multiple relationships and variables, some of them non-observable or latent in their nature. SEM is a confirmatory
method guided by a priori hypothesis about the structures to be modeled (Kaplan, 2000, Mueller, 1996, Bollen, 1989). SEM as a methodological framework to study different transportation aspects has been used for about twenty-five years (Golob, 2001). The technique has been used in several areas like cross-sectional data analysis (Simma and Axhausen, 2001), longitudinal data analysis (Mokhtarian and Meenakshisundaram 1999) activity-based studies (Golob and McNally, 1994), and extended discrete choice models (Morikawa et. al (1996), Ben-Akiva et.al (1997), Morikawa and Sasaki (1998)).
In its more general case, it consists of a measurement model relating the observable to the latent variables and a structural model that relates the latent variables. Latent variables represent concepts of interest to researchers that are unobservable even in the population. Some of these concepts are typically ill defined, for example in the transportation field, concepts like mobility and accessibility could fit this description. The observable variables that serve as their indicators (i.e., trips, travel time, etc.) and their causes (income, population density, etc.) are typically measured in different ways, through a large number of variables across time and space, or are measured with error due to the sampling procedures or the data collection instruments. Nonetheless, the measurable (manifest) variables (x) can be used to make inferences about a set of latent variables
E.
The objective of latent variable models is to infer how the manifest variables (x) depend upon the latent variables ( ). It assumes that there is a distribution of x conditional onE,
CD (x().
If the density function of is h( ), thenthe marginal distribution of x is
f(x)
=
f$(x|()h()d
(3-1)
where the function f (x) is observable from the sample, however, in order to infer how x depend upon y there is need for assumptions about the form of f (x). The main assumption being "conditional independence" states that the manifest variables are independent of one another, given the values of the latent variables. This means that any observed
interdependence between the manifest variables is due solely to their common dependence on the latent variables ruling out possible causality relationships among them. Factor
Analysis is one known method of this kind; in fact, it is a specific case of structural equations modeling (Everitt, 1984, Bollen, 1989, Wansbeek and Meijer (2000), Kaplan (2000)).


![Impact des opiacés sur les neurones dopaminergiques [= Impact of opiates on dopaminergic neurons]](data:image/gif;base64,R0lGODlhAQABAIAAAP///wAAACH5BAEAAAAALAAAAAABAAEAAAICRAEAOw==)