READ THESE TERMS AND CONDITIONS CAREFULLY BEFORE USING THIS WEBSITE.
https://nrc-publications.canada.ca/eng/copyright
Vous avez des questions? Nous pouvons vous aider. Pour communiquer directement avec un auteur, consultez la première page de la revue dans laquelle son article a été publié afin de trouver ses coordonnées. Si vous n’arrivez pas à les repérer, communiquez avec nous à [email protected].
Questions? Contact the NRC Publications Archive team at
[email protected]. If you wish to email the authors directly, please see the first page of the publication for their contact information.
NRC Publications Archive
Archives des publications du CNRC
This publication could be one of several versions: author’s original, accepted manuscript or the publisher’s version. / La version de cette publication peut être l’une des suivantes : la version prépublication de l’auteur, la version acceptée du manuscrit ou la version de l’éditeur.
Access and use of this website and the material on it are subject to the Terms and Conditions set forth at
Hazard analysis of a multi-occupancy building using FIERAsystem Bénichou, N.; Hadjisophocleous, G. V.; Torvi, D. A.; Vollhoffer, S. R.; Reid, I.
https://publications-cnrc.canada.ca/fra/droits
L’accès à ce site Web et l’utilisation de son contenu sont assujettis aux conditions présentées dans le site LISEZ CES CONDITIONS ATTENTIVEMENT AVANT D’UTILISER CE SITE WEB.
NRC Publications Record / Notice d'Archives des publications de CNRC:
https://nrc-publications.canada.ca/eng/view/object/?id=6d68e4d6-bada-4697-b771-5667fec5758c https://publications-cnrc.canada.ca/fra/voir/objet/?id=6d68e4d6-bada-4697-b771-5667fec5758c
Hazard analysis of a multi-occupancy building using FIERAsystem
Bénichou, N.; Hadjisophocleous, G.V.; Torvi, D.A.; Volhoffer, S.R.; Reid, I.
A version of this paper is published in / Une version de ce document se trouve dans: 4th International Conference on Performance-Based Codes & Fire Safety Design
Methods, Melbourne, Australia, March 20-22, 2002, pp. 310-321
www.nrc.ca/irc/ircpubs
Hazard Analysis of a Multi-Occupancy Building using FIERAsystem
N. Benichou1, G. V. Hadjisophocleous2, D. A. Torvi3, S. R. Vollhoffer4 and I. Reid1
1
National Research Council of Canada, Ottawa, Canada 2
Carleton University, Ottawa, Canada 3
University of Saskatchewan, Saskatoon, Canada 4
Department of National Defence, Ottawa, Canada
INTRODUCTION
With the move to performance/objective-based codes, design tools are needed to demonstrate that proposed designs meet the code’s objectives and requirements. One such tool is FIERAsystem (FIre
Evaluation and Risk Assessment system), a computer model that has been developed to evaluate fire protection systems in light industrial buildings. FIERAsystem uses time-dependent deterministic and probabilistic models to evaluate the impact of selected fire scenarios on life, property and business interruption. FIERAsystem has been designed as a tool that can be used to evaluate performance-based fire protection engineering designs. It is intended for use by a wide variety of individuals, including fire protection engineers, building officials, fire service personnel and researchers.
To demonstrate the utility of FIERAsystem, case studies were recently performed to evaluate fire protection systems in Canadian Department of National Defence (DND) facilities. This paper presents the procedure used in FIERAsystem to perform a hazard analysis and describes a case study of hazard analysis done for an aircraft hangar. In addition, the paper provides a brief description of the framework for FIERAsystem and its main models.
FRAMEWORK OF FIERAsystem MODEL
The FIERAsystem model allows the user to perform a number of fire protection engineering calculations in order to evaluate fire protection systems in industrial buildings. At startup, FIERAsystem provides several calculation options, which allow the user to use standard engineering correlations, run individual sub-models, conduct a hazard analysis, or conduct a risk analysis. The standard engineering correlations model is a collection of relatively simple equations and models that can be used to quickly perform simple fire protection engineering calculations. The main FIERAsystem sub-models are based on accepted fire protection engineering practice and include fire development, fire detection, smoke production and movement, building element failure, suppression effectiveness, fire department response and effectiveness, occupant response and evacuation, life hazard, expected number of deaths, economics, and downtime. Since the emphasis in this paper is hazard analysis, only those sub-models relating to hazard analysis will be described. Detailed information on the other sub-models can be found in [1], [2] and [3]. Risk analysis consists of performing hazard analysis of a number of fire scenarios, and then calculating the risk using the probability of scenarios considered. In addition, FIERAsystem can be used to evaluate whether a fire protection system for a building will satisfy specific fire safety objectives. This can be done using individual sub-models or through a hazard analysis [3].
FIERAsystem provides flexibility in performing fire protection engineering calculations. The system model has been designed so that calculations can be performed to evaluate a single component of the fire protection system by running only the required sub-model. For example, the detection system can be evaluated using the detection sub-model. A complete hazard or risk analysis can also be conducted using the sub-models supplied with FIERAsystem. Alternatively, this hazard or risk analysis can be performed using a combination of some of the FIERAsystem sub-models and information from datafiles that provide information that replace sub-model outputs. Recognizing that in many cases, fire protection engineers must still rely on empirical data, where models have not yet been developed, these datafiles can include fire test data. Datafiles containing results from other computer fire models can also be used. This flexibility allows FIERAsystem to be used by designers of different types of buildings, since modifications can be made to individual sub-models, without having to change the rest of the system model.
HAZARD ANALYSIS
Hazard analysis involves the life hazard and expected number of deaths sub-models using results from the other sub-models. In the following sections, these two sub-models are explained along with the procedure to carry out hazard analysis. Details of the other sub-models can be found in [1], [2] and [3].
Life Hazard Sub-Model
The FIERAsystem life hazard sub-model [4] calculates the time-dependent probability of death for occupants in a compartment due to the effects of being exposed to both high heat fluxes and hot and/or toxic gases. The life hazard sub-model uses input from other FIERAsystem sub-models that describe the heat fluxes (fire development and smoke movement sub-models) in the compartment, and the temperature and chemical composition of hot gases (smoke movement sub-model).
The time-dependent probability of death from exposure to high thermal radiation heat fluxes at a given location in the compartment, is calculated using the sum of the heat fluxes from the fire (calculated by fire development models) and from the hot smoke layer (calculated by the smoke movement sub-model). The revised vulnerability model of Tsao and Perry [5] is used to calculate the probability of death from the heat flux data.
For calculating the probability of death due to breathing toxic gases, the FIERAsystem life hazard sub-model only considers the toxic effects of CO and CO2, because, in most practical fire situations, the effects of CO are the most important [6]. CO2 will affect the rate of breathing and hence will affect the intake of CO. The default height for these calculations is 1.5 m. While it can be argued that all individuals can crawl under a smoke layer of this height, this height was chosen so as to be conservative. The user can also specify other heights for this calculation, depending on the occupancy.
The FIERAsystem life hazard sub-model also considers the probability of death due to breathing or being exposed to hot gases. This probability is based on data from the literature for human tolerance times in experimental exposures to dry and humid air at elevated temperatures. A probability of 1.0 is
said to represent the point where a person would become incapacitated by the exposure to the hot gases because of heat stroke, skin burns and/or respiratory tract burns.
The total probability of death at a given location in the compartment is calculated using the union of the individual probabilities of death from being exposed to high thermal radiation heat fluxes, and breathing hot or toxic gases. In order to calculate the total probability of death in any compartment using the FIERAsystem life hazard sub-model, the compartment is first divided into a number of rings from the fire. The total probability of death is used to calculate the total probability of death within each of the rings. The total probability of death for the compartment is then calculated using a weighted sum of the probabilities of death in each of the rings.
Expected Number of Deaths Sub-Model
The FIERAsystem expected number of deaths sub-model calculates the number of occupants expected to die in each compartment with time. This calculation is based on the residual population in each compartment computed by the evacuation sub-model and the probability of death in that compartment computed by the life hazard sub-model. At each time step, the expected number of deaths is computed by multiplying the probability of death at that time with the residual live population at that time. The expected number of deaths for a scenario is:
∑
= n i i deaths ENDWhere n is the number of compartments and deathsi is the expected number of deaths in each compartment.
Hazard Analysis Procedure
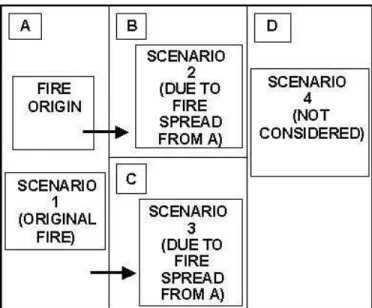
Hazard analysis calculates the consequences of a specific fire scenario beginning in a specific compartment in the building. In FIERAsystem, the results of hazard analysis are the expected number of deaths and the expected cost of property damage. The steps involved in hazard analysis for a multi-compartment building (e.g., Figure 1) are shown in Table 1 along with the sub-models involved and their outputs. The user first specifies the compartment of fire origin and the fire scenarios that would occur in each compartment. In order to make hazard analysis calculations manageable, FIERAsystem only considers fire spread to adjacent compartments. For example, in Figure 1, where the compartment of fire origin is Compartment A, only fire spread to Compartments B and C would be considered. Fire spread to Compartment D would be ignored. The fire development sub-models then calculate quantities that characterize fires, such as heat release rates, temperatures, and heat fluxes, as functions of time. In addition, this would involve simulating Scenarios 1, 2 and 3 in Compartments A, B and C. The process then continues as per Table 1 with the end result for each scenario being the expected number of deaths and the expected fire losses.
Figure 1. Example of Fire Spread in a Multi-Compartment Building
Table 1. Procedure for FIERAsystem Hazard Analysis
Step Sub-model Output(s)
1 Project definition • building and occupant characteristics
2 Fire development • heat release rates, temperatures and heat fluxes 3 Fire detection • detector activation time, sprinkler activation time, and
times to fire cues 4 Suppression effectiveness
(sprinkler operation) •
modified heat release rates, modified temperatures and modified heat fluxes
5 Fire department response • fire department response time
6 Occupant response • probability of occupants commencing evacuation
• time and probability of fire department notification 7 Fire department effectiveness
(fire department operations)
• modified heat release rates, modified temperatures and modified heat fluxes
8 Building element failure • time to failure of building elements in compartment of fire origin
9 Smoke movement • hot gas layer temperatures and height, and concentrations of CO and CO2
10 Fire spread • time of fire spread to adjacent compartments
• heat release rates, temperatures and heat fluxes in adjacent compartments
12 Occupant evacuation • residual population with time 13 Life hazard • probability of death with time 14 Expected number of deaths • expected number of deaths 15 Economic • expected property losses
CASE STUDY - HAZARD ANALYSIS OF AN AIRCRAFT HANGAR
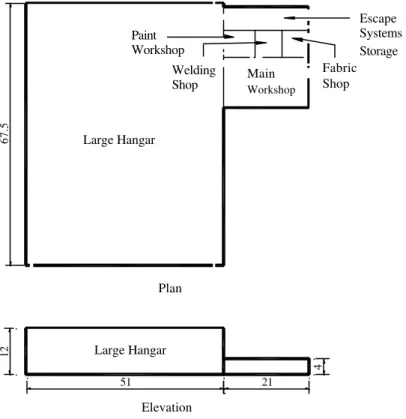
To demonstrate the use of FIERAsystem, a hazard analysis of an aircraft hangar of the Canadian Department of National Defence was performed. Hangar 7, also known as the Aerospace Engineering Test Establishment, is located on the Canadian Forces Base (CFB) Cold Lake, Alberta. This study included an analysis of fire and smoke spread in the building, and the evacuation of occupants. Hangar 7 includes two hangars and two office areas. The office areas have two levels. The presence of fire and barrier walls allows the hangar to be modelled using only a portion of the building. Figure 2 shows the floor plan and elevation of the compartments being modelled. The area modelled consists of five compartments on the ground level office area (escape systems storage room, welding shop, fabric shop, main workshop and paint workshop) and the large hangar. The office compartments have a total floor area of 572 m2 and the large hangar has a floor area of 3443 m2. The large hangar has a dome-shaped roof, and is modelled using an equivalent roof height. The equivalent roof height is calculated by equating the volume of the dome-shaped roof compartment to the volume of a flat roof compartment. Using the same floor area, the equivalent roof height is calculated. All internal doors are assumed open and all external doors are assumed closed. The doors are standard size except for the 3 m wide by 2.75 m high roller doors. There is a wet-pipe sprinkler system installed throughout the building, but there are no smoke detectors. The building is of concrete construction.
Large Hangar Main Workshop Paint Workshop Shop Fabric Welding Shop Escape Systems Storage 67.5 12 Large Hangar
All dimensions are in metres. Elevation
Plan
4
51 21
One possible location for a fire is the paint workshop, where there is a fuel source of approximately 300 L of paint supplies, of which the main chemical is kerosene. The paint workshop dimensions are 8.1 m long, 6.7 m wide, and 4.0 m high. From the paint workshop, one door leads to the main workshop. Another standard door and a roller door lead to the large hangar.
Fire Scenarios
Two potential pool fire scenarios were chosen as design fires for the paint workshop. The first fire occurs when the paint fuel is limited to spilling within a dyke diameter of 2.7 m. This fire is estimated to reach a maximum heat release rate of 10 MW. The second fire occurs when the paint fuel is limited to spilling within a dyke diameter of 4.0 m. This fire is estimated to reach a maximum heat release rate of 20 MW. Detailed results will only be shown in this paper for the 20 MW fire. Results for the 10 MW fire will be briefly discussed later in the paper. For the purpose of this case study, the fires are evaluated using the hazard analysis outlined in Table 1.
Fire Development
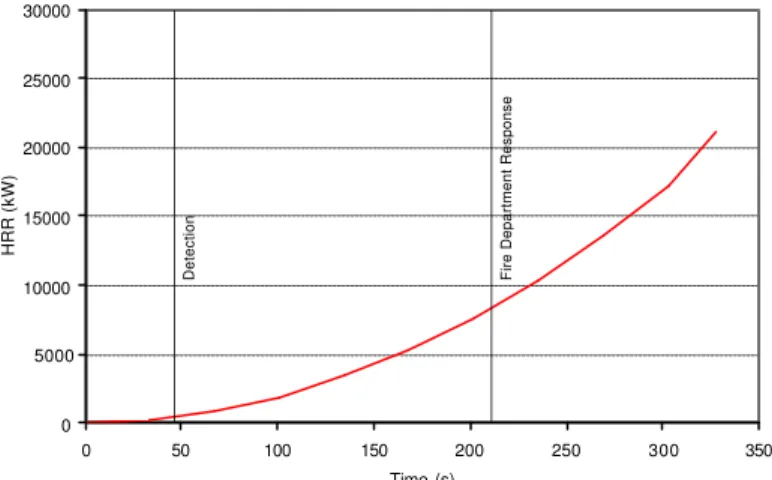
Figure 3 shows the heat release rate curve for the paint workshop, predicted by the fire development sub-model. The fire is estimated to reach flashover at 221 s, and the maximum heat release rate of 20 MW at 330 s, when the fire runs out of fuel.
0 5000 10000 15000 20000 25000 30000 0 50 100 150 200 250 300 350 Time (s) HRR (kW)
Detection Fire Department Response
Figure 3. Predicted Heat Release Curve for the 20 MW Fire in the Paint Workshop
Detection and Suppression
The fire is assumed to be located in the middle of the paint workshop and centered between four sprinklers. There are no heat or smoke detectors in the paint workshop. The sprinklers act as detectors and are assumed to have an RTI of 80 m1/2s1/2, and an activation temperature of 85°C. The sprinklers in the paint workshop are calculated to activate at 46 s. Although the sprinklers activate, they are assumed to have no effect on a fire of this magnitude, because of the nature of the fuel.
There is a series of sprinklers located along the dome-shaped roof in the large hangar. Activation times are calculated by combining the time at which the smoke interface (as defined by the smoke movement sub-model) falls below the roller door and the time for the sprinkler to activate, as calculated by the detection sub-model. This activation time is based on the heat release rate in the compartment of fire origin and an assumed fire area equivalent to the door width by 0.5 m. The height of the sprinklers is defined by the arc length along the dome, continuing down to the floor. The lowest sprinkler is considered to be located at 9.4 m along the wall, and the highest at 31.9 m along the wall. The lowest sprinkler in the hangar is predicted to activate at 108 s, and the highest is predicted to activate at 300 s.
Fire Department Response and Effectiveness
The fire department is notified by an automatic alarm that sounds with the activation of the sprinklers. The fire department is located on the military base, 1 km away from Hangar 7. The fire department is predicted to intervene within 10 minutes of being notified. The fire department response sub-model calculates the dispatch, preparation, and travel time to be 10 s, 46 s, and 109 s, respectively. When these times are added to the notification time of 46 s, determined by the sprinkler activation, it is predicted that the fire department will respond in 211 s. The effect of the fire department effectiveness is not considered as the predicted intervention time (646 s) is longer than the times at which flashover and the peak heat release rate are reached (221 and 330 s, respectively). In addition, the fire in the compartment of fire origin starts to decay after 330 s because it consumed all the fuel.
Occupant Response
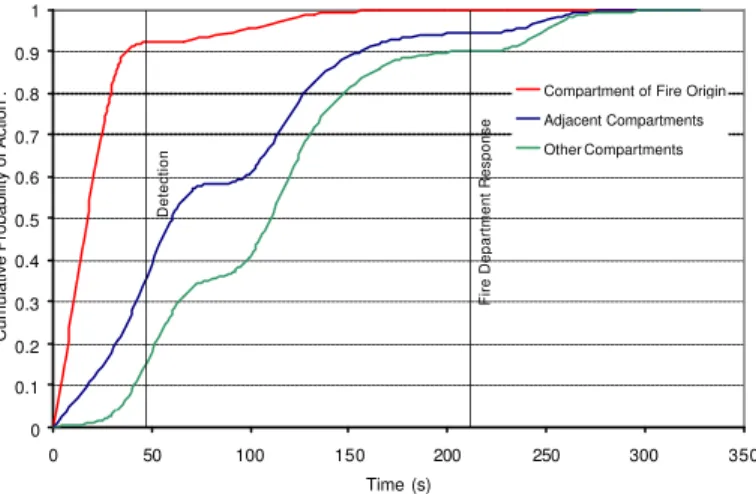
As shown in Figure 4, all occupants in the compartment of fire origin are predicted to take action in approximately 135 s, and all occupants in the remaining compartments are predicted to take action in approximately 260 s. The time the fire department would be notified by an occupant is compared with the time that the fire department is notified due to the activation of the sprinkler. Notification by an occupant is predicted to occur at 67 s. As it was calculated earlier that the fire department is automatically notified when the sprinkler system activates at 46 s, the notification time calculated by the occupant response sub-model is not used in these calculations.
0 0.1 0.2 0.3 0.4 0.5 0.6 0.7 0.8 0.9 1 0 50 100 150 200 250 300 350 Time (s)
Cumulative Probability of Action .
Compartment of Fire Origin Adjacent Compartments Other Compartments
Detection
Fire Department Response
Building Element Failure
Using the time and temperature data calculated by the fire development sub-model, the 150 mm thick concrete walls of the paint workshop are predicted to fail after 155 minutes. The failure time is based on the absence of fire department action because the fire runs out of fuel and starts to decay after 330 s.
Smoke Movement Sub-Model
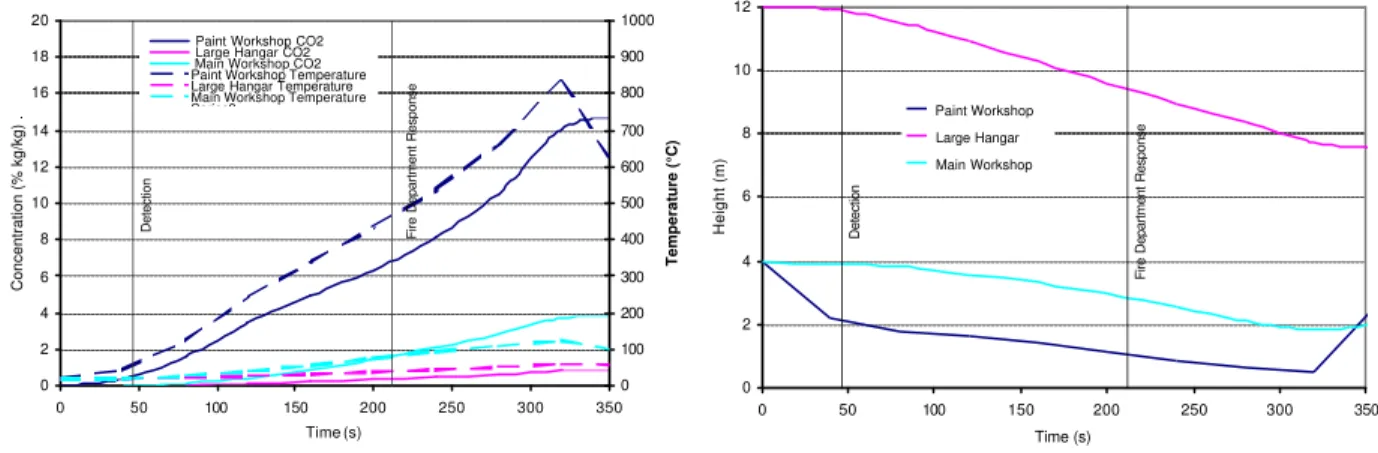
The smoke movement sub-model is run using the six compartments described above. The ventilation system is assumed closed which represents the worst case scenario. Figure 5 shows the temperature and depth of the hot layer, and CO2 production with time predicted by the smoke movement sub-model for the paint workshop, large hangar and the main workshop. Since kerosene is assumed as the fuel source, the smoke movement sub-model predicts no CO production. Predictions of CO2 concentrations in the paint workshop indicate a gradual increase, reaching 15% after 330 s. CO2 concentrations in the large hangar and the main workshop reach much lower concentrations of about 1% and 4%, respectively. In the paint workshop, the temperature increases rapidly for 320 s up to about 830°C. Temperatures in the large hangar, and the main workshop are much lower because of the larger room volumes. The hot gas layer in the paint workshop descends from 4.0 m (the ceiling), at ambient temperature, to 0.5 m above the floor at 320 s. The hot gas layer falls to a height of 1.5 m above the floor at about 130 s, which is assumed to represent untenable conditions for occupants in the paint workshop. The hot gas layers in the large hangar and the main workshop do not drop below a height of 1.5 m above the floor.
0 2 4 6 8 10 12 14 16 18 20 0 50 100 150 200 250 300 350 Time (s) Concentration (% kg/kg) . 0 100 200 300 400 500 600 700 800 900 1000 Temperature (°C)
Paint Workshop CO2 Large Hangar CO2 Main Workshop CO2 Paint Workshop Temperature Large Hangar Temperature Main Workshop Temperature Series3
Detection Fire Department Response
0 2 4 6 8 10 12 0 50 100 150 200 250 300 350 Time (s) Height (m) Paint Workshop Large Hangar Main Workshop Detection
Fire Department Response
Figure 5. Predicted build-up of smoke and heat in different compartments
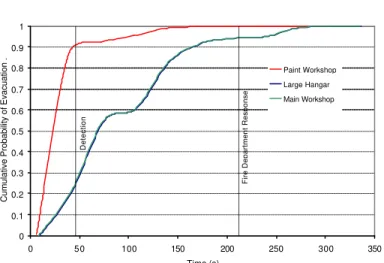
Occupant Evacuation
The occupant load for each compartment is selected based on the National Building Code of Canada [7], which defines the maximum number of persons per unit area. The total number of occupants in the modelled portion of the building is 169. Table 2 shows distribution of this occupant load and the exit distance for each compartment. The occupant evacuation sub-model assumes that all occupants can
exit the building with the same travel speed, because the majority of occupants are trained military personnel.
As shown in Figure 6, it is predicted that all of the occupants in the compartment of fire origin will evacuate in approximately 140 s. All the other occupants are predicted to evacuate the building within approximately 275 s.
Table 2. Occupant Distribution and Travel Distances
Compartment Number of Occupants Exit Distance (m)
Escape Systems Storage 2 15
Welding Shop 9 11 Fabric Shop 10 23 Paint Workshop 11 22 Main Workshop 61 30 Large Hangar 76 34 0 0.1 0.2 0.3 0.4 0.5 0.6 0.7 0.8 0.9 1 0 50 100 150 200 250 300 350 Time (s)
Cumulative Probability of Evacuation .
Paint Workshop Large Hangar Main Workshop
Detection
Fire Department Response
Figure 6. Predicted Occupant Evacuation
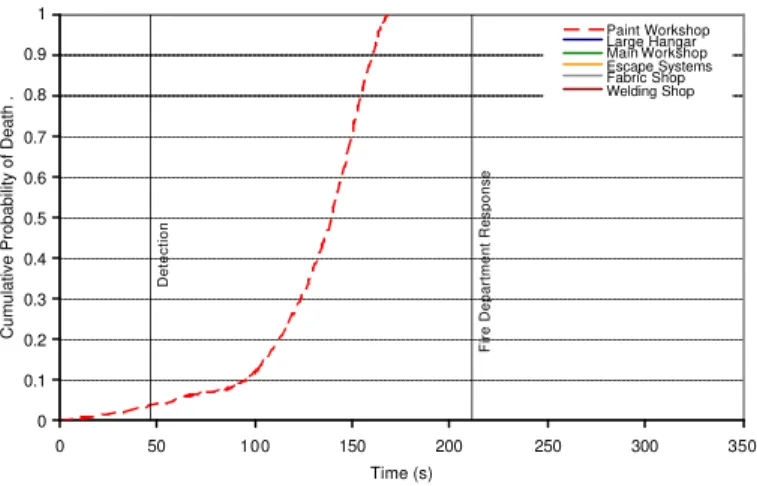
Life Hazard
Figure 7 shows the results of the life hazard sub-model. The expected probability of death for occupants in the compartment of fire origin reaches 100% at 168 s, and the predicted probability of death for all other occupants is 0%.
0 0.1 0.2 0.3 0.4 0.5 0.6 0.7 0.8 0.9 1 0 50 100 150 200 250 300 350 Time (s)
Cumulative Probability of Death .
Paint Workshop Large Hangar Main Workshop Escape Systems Fabric Shop Welding Shop Detection
Fire Department Response
Figure 7. Predicted life hazard
Expected Number of Deaths
As shown in Figure 8, the expected number of deaths sub-model predicts that all occupants will safely evacuate the building.
0 10 20 30 40 50 60 70 80 0 50 100 150 200 250 300 350 Time (s) Number of Occupants
Attempting to Evacuate (Paint Workshop) Number of Deaths (Paint Workshop) Attempting to Evacuate (Main Workshop) Number of Deaths (Main Workshop) Attempting to Evacuate (Fabric Shop) Number of Deaths (Fabric Shop) Attempting to Evacuate (Large Hangar) Number of Deaths (Large Hangar)
Figure 8. Predicted Residual Population
Economics and Downtime
The economic and downtime sub-models were not run for Hangar 7, as the information necessary for these sub-models was not available.
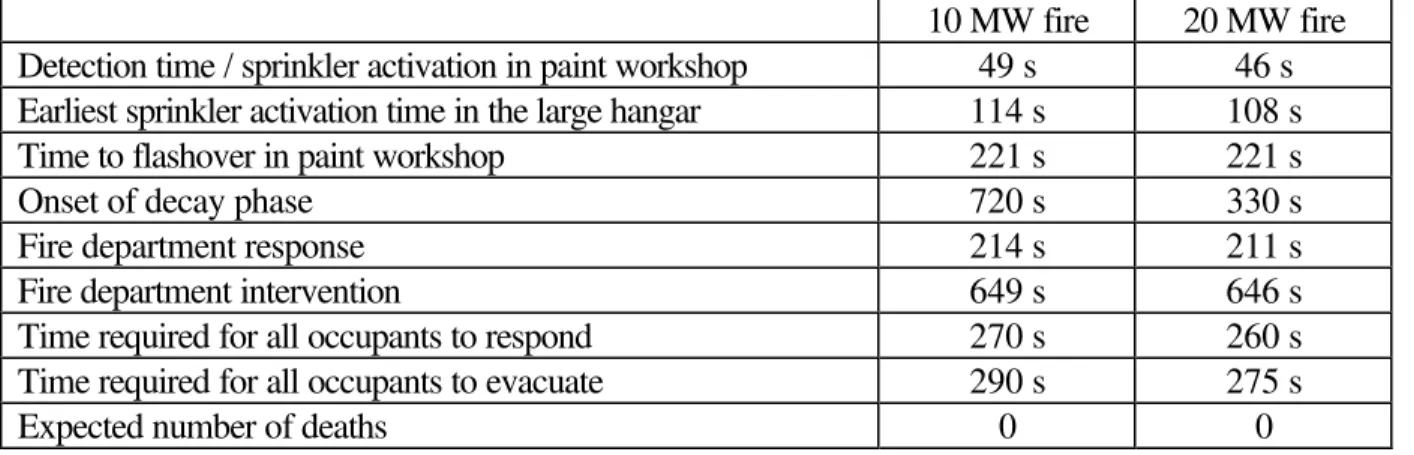
Summary of Case Study Results
Table 3 shows a summary of the results of the analyses for the 20 MW fire described above, as well as the 10 MW fire.
The 10 MW confined pool fire, which has a maximum diameter of 2.7 m, is estimated to reach 10 MW after 227 s, and continue to burn until 720 s. It is predicted that the fire will be detected at 49 s, flashover will occur at 221 s, and sprinklers in the large hangar will activate at 114 s. The occupant evacuation sub-model predicts that complete evacuation of the six compartments occurs at 290 s. The fire department is estimated to intervene after 649 s, and the expected number of deaths sub-model predicts that no occupants will die.
The results for the 20 MW confined pool fire, which has a maximum diameter of 4.0 m, are similar to the results of the 10 MW fire. The fire is predicted to reach 20 MW after 330 s. It is estimated that the fire will be detected after 46 s, and flashover will occur at 221 s. Foam sprinklers in the large hangar are calculated to activate after 108 s, and will create a large amount of debris in this area. The occupant evacuation sub-model predicts that complete evacuation of the six compartments occurs at 275 s. The fire department is estimated to intervene after 646 s, and the expected number of deaths sub-model predicts that no occupants will die.
Table 3. Results of Hangar 7 Analysis
10 MW fire 20 MW fire Detection time / sprinkler activation in paint workshop 49 s 46 s Earliest sprinkler activation time in the large hangar 114 s 108 s Time to flashover in paint workshop 221 s 221 s
Onset of decay phase 720 s 330 s
Fire department response 214 s 211 s
Fire department intervention 649 s 646 s
Time required for all occupants to respond 270 s 260 s Time required for all occupants to evacuate 290 s 275 s
Expected number of deaths 0 0
SUMMARY AND CONCLUSIONS
FIERAsystem, a new computer model to evaluate fire protection systems in industrial buildings, has been described. The model provides information on the safety and associated cost of candidate fire protection systems, and is expected to assist engineers and building officials in evaluating fire protection systems in buildings and in determining compliance with a set of objectives for buildings. In this study, FIERAsystem was used to assess two fire scenarios in a Canadian DND aircraft hangar. Two different design fires in a paint workshop adjacent to the main hangar were considered. Complete evacuation of the building, with no occupant deaths, was predicted for both scenarios. Information on costs and reliabilities of fire protection systems, and estimates of downtime for various levels of fire damage are being gathered, which will allow a complete risk analysis to be performed for this and other buildings.
1. Hadjisophocleous, G. V., Torvi, D. A., Fu, Z., and Yager B., FIERAsystem: A Computer Model for Fire Evaluation and Risk Assessment, 18th International Conference on Offshore Mechanics and Arctic Engineering, OMAE99/S&R-6016, 1999, St. Johns, Newfoundland.
2. Yung, D., Hadjisophocleous, G.V., Proulx, G. and Kyle, B.R., "Cost-Effective Fire-Safety Upgrade Options for a Canadian Government Office Building", Proceedings, International Conference on Performance-Based Codes and Design Methods, 1996, Ottawa, ON, pp. 269– 280
3. Hadjisophocleous, G.V., Benichou, N., Torvi, D.A. and Reid, I.M.A., “Evaluating Compliance of Performance-Based Designs with Fire Safety Objectives”, Proceedings,, 3rd International Conference on Performance-Based Codes and Fire Safety Design Methods, 2000, Lund University, Sweden.
4. Torvi, D.A., Raboud, D.W., and Hadjisophocleous, G.V., “FIERAsystem Theory Report: Life Hazard Model”, IRC Internal Report No. 781, Institute for Research in Construction, National Research Council of Canada, Ottawa, ON, 1999.
5. Tsao, C.K. and Perry, W.W., “Modifications to the Vulnerability Model: A Simulation System for Assessing Damage Resulting from Marine Spills (VM4)”, Report CG-D-38-79, U.S. Coast Guard Office of Research and Development, Washington, DC,1979.
6. Hadjisophocleous, G.V. and Yung, D., “A Model for Calculating the Probabilities of Smoke Hazard from Fires in Multi-Storey Buildings”, Journal of Fire Protection Engineering, Vol. 4, 1992, pp. 67-80.
7. National Building Code of Canada 1995, Canadian Commission on Building and Fire Codes, National Research Council of Canada, Ottawa, ON, 1995.