Publisher’s version / Version de l'éditeur:
Canadian Journal of Applied Spectroscopy, 39, 1, pp. 7-14, 1994-02
READ THESE TERMS AND CONDITIONS CAREFULLY BEFORE USING THIS WEBSITE. https://nrc-publications.canada.ca/eng/copyright
Vous avez des questions? Nous pouvons vous aider. Pour communiquer directement avec un auteur, consultez la
première page de la revue dans laquelle son article a été publié afin de trouver ses coordonnées. Si vous n’arrivez pas à les repérer, communiquez avec nous à PublicationsArchive-ArchivesPublications@nrc-cnrc.gc.ca.
Questions? Contact the NRC Publications Archive team at
PublicationsArchive-ArchivesPublications@nrc-cnrc.gc.ca. If you wish to email the authors directly, please see the first page of the publication for their contact information.
NRC Publications Archive
Archives des publications du CNRC
This publication could be one of several versions: author’s original, accepted manuscript or the publisher’s version. / La version de cette publication peut être l’une des suivantes : la version prépublication de l’auteur, la version acceptée du manuscrit ou la version de l’éditeur.
Access and use of this website and the material on it are subject to the Terms and Conditions set forth at
Applications of thermogravimetry and PAS-FTIR in the characterization
of silicone sealants
Paroli, R. M.; Delgado, A. H.; Cole, K. C.
https://publications-cnrc.canada.ca/fra/droits
L’accès à ce site Web et l’utilisation de son contenu sont assujettis aux conditions présentées dans le site LISEZ CES CONDITIONS ATTENTIVEMENT AVANT D’UTILISER CE SITE WEB.
NRC Publications Record / Notice d'Archives des publications de CNRC:
https://nrc-publications.canada.ca/eng/view/object/?id=8114b3a9-bd29-46aa-ab30-77f619de6f86 https://publications-cnrc.canada.ca/fra/voir/objet/?id=8114b3a9-bd29-46aa-ab30-77f619de6f86
Applic a t ions of t he rm ogra vim e t ry a nd PAS-FT I R in t he
c ha ra c t e riza t ion of silic one se a la nt s
N R C C - 3 6 0 9 1
P a r o l i , R . M . ; D e l g a d o , A . H . ; C o l e , K . C .
F e b r u a r y 1 9 9 4
A version of this document is published in / Une version de ce document se trouve dans:
Canadian Journal of Applied Spectroscopy, 39, (1), pp. 7-14, February-94
http://www.nrc-cnrc.gc.ca/irc
The material in this document is covered by the provisions of the Copyright Act, by Canadian laws, policies, regulations and international agreements. Such provisions serve to identify the information source and, in specific instances, to prohibit reproduction of materials without written permission. For more information visit http://laws.justice.gc.ca/en/showtdm/cs/C-42
Les renseignements dans ce document sont protégés par la Loi sur le droit d'auteur, par les lois, les politiques et les règlements du Canada et des accords internationaux. Ces dispositions permettent d'identifier la source de l'information et, dans certains cas, d'interdire la copie de documents sans permission écrite. Pour obtenir de plus amples renseignements : http://lois.justice.gc.ca/fr/showtdm/cs/C-42
Applications of Thermogravimetry and PAS-FTIR m the Characterization of
Silicone Sealants
Ralph M. ParoliH, Ana H. Delgado\ and Kenneth C. Cole2
Contribution from 11nstitutefor Research in Construction, National Research Council of Canada, Ottawa, Ontario,
KIA OR6 and 2
1ndustrial Material Institute, National Research Council of Canada, Boucherville, Quebec, Canada Ji;.B6Y4
Received June 24, 1993 Accepted: July 14, 1993
Abstract
Fourier transform infrared photoacoustic (PAS-FTIR) spectroscopy and thermogravimetry (TG) have been used to study the effects of exposure of silicone sealants to water in the presence and absence of UV-radiation. The silicone sealants were found to be fairly resistant to the two types of weathering condi-tions for the duration of the exposure (8000 hours). Only a small increase in the hydroxyl absorption band was observed by PAS-FTIR. No substantial changes in weight loss were observed using thermogravimetry.
Resume
La spectroscopie photo-acoustique injrarouge par
transformee de Fourier (P AS-FTIR) et la
thermogravi-metrie (TG) ont ete utilisees afin d'etudier l'effet de l'ex-position
a
l'eau de produits silicones scellants, en pre-sence ou en l'abpre-sence de radiations UV. Ces produits ont montre une bonne resistance aux conditions decrites ci-haut pendant toute la duree de l'exposition (8000 heures). Seule une legere augmentation de labande d'absorption correspondant au groupe hydroxyle a ete observee par P AS-FTIR. La thermogravimetrie n'a revele aucune perte de masse significative.
Introduction
Silicone sealants are the leading type of sealants cur-rently being used in the construction industry. They are preferred because of their properties which are directly linked to their chemistry. Silicone sealants normally contain polydimethylsiloxane rubber (PDMS) which has
* Author to whom correspondence should be addressed.
a very flexible backbone (1). PDMS is a polyorganosi-loxane with high thermal stability. The chemical bonds -Si-0-, -Si-C- and -Si-H are very stable. For example, the -Si-0-Si- bond has a bond dissociation energy of 364 KJ mol-1 and can tolerate up to 300°C without decomposing (2). Furthermore, the backbone is not affected by ultraviolet radiation and therefore, silicone sealants weather very well. The silicone sealants also contain additives (which provide strength and resist-ance to various environmental factors) and a crosslin-king system. The crosslincrosslin-king system is required to form the linear silicone elastomer and the mechanism usually involves a free-radical pathway. The curing process for one-part systems requires atmospheric moisture because it is a condensation curing process during which acetic acid is given off (see eq. [1]).
dimethyl polysiloxane triacetoxy methylsilane
[
HO-
セ・M
0- [セ・M
0]-le_
(0b
CH a)zMe Me x
base polymer
+ acetic acid [1]
Some of the advantages of the silicone sealants include(l): their one component nature, colour stability, high temperature resistance (up to 200°C), great flexi-bility (down to about -60°C), TN and ozone resistance, good chemical resistance. The disadvantages include: cost, difficult in painting, unpleasant odour (during cure), critical importance of surface preparation.
In many industrial applications it is necessary to determine the durability of a product. If the product has been in-use for many years then the durability can be
8
predicted from historical data. This, however, is not fea-sible for new products since it is unrealistic to expect a company to wait 25 years prior to releasing a product. Also, it is unacceptable to expect a consumer to accept a new product which has no track record. Since natural weathering takes too long, accelerated weathering is used. Accelerated aging can vary from a simple heat-aging test to more elaborate systems which simulate combined UV-radiation, temperature, humidity and atmospheric pollutant effects. Accelerated weathering is faster because harsher conditions are used. These harsh conditions can generate unnatural responses in the material and hence, care must be taken when defin-ing the weatherdefin-ing conditions.
Various mechanical and chemical properties can be monitored to study aging phenomena (3). The mechan-ical properties include tensile strength, elongation, flex-ural strength, impact, etc. Some of the chemical tech-niques used to study the weathering effects include thermal analysis (TG, DMA, DSC, TMA) and spectros-copy (FTIR, NMR, MS, SEM, ESCA, etc.).
Thermal Analysis
Thermal analysis encompasses a number of tech-niques which are useful to characterize polymeric build-ing materials. These techniques include thermogravi-metry (TG), differential thermal analysis (DTA), differential scanning calorimetry (DSC), dynamic mechanical analysis (DMA), thermomechanical analysis (TMA), and simultaneous thermal analysis (STA or TG/DTA or TG/DSC). In STA, data from two thermoa-nalytical techniques, thermogravimetry (TG) and differ-ential thermal analysis (DTA), are acquired simultane-ously, by the same instrument on a single specimen. Since TG provides information on any reaction involving mass change as a function of temperature and/or time (4), information on the heat stability and composition of the sample can be obtained. Differential thermal analy-sis (DTA) provides information on the temperature dif-ference between a redif-ference and a sample while they are subjected to a common temperature program (4). The main application of DTA is in the determination of thermal events such as oxidative stability, chemical reactions, phase transitions, enthalpies, melting point, decomposition, etc. All chemical changes can 「セ@ studied by DTA since heat is either absorbed (endothermic reaction) or evolved (exothermic reaction). In endother-mic reactions such as melting, the temperature of the sample should be lower than in the reference, since no heat was absorbed in the reference. Simultaneous TG/DTA technique is a very useful technique since physical and chemical changes of the sample are recorded simultaneously. This combination has many
Ralph M. Paroli et aL
advantages over the individual TG and DTA techniques. Firstly, the two measurements are taken at the same temperature and time, thereby eliminating the problem of homogeneity. Secondly, it saves time since only one sample has to be prepared, which minimizes experimen-tal errors.
The STA technique is not always sufficient to charac-terize all types of materials such as construction mate-rials, which have very complex composition. In many
cases, complementary techniques (e.g., FTIR) are
required to fully characterize the material.
Fourier Transform Photoacoustic Infrared (PAS-FTIR) Spectroscopy
Photoacoustic-FITR spectroscopy has been used for a number of years in many different fields, including, food, pharmaceutical, biomedical, coal, semi-conductors, environmental, and coatings. (5), Minimal sample prep-aration is a definite advantage of the PAS-FTIR tech-nique (6). The KBr pellet techtech-nique often presents prob-lems with samples which are difficult (if not impossible) to grind. Diffuse reflectance (DRIFT) is not feasible if the sample has low diffuse-reflectance components. Internal reflection also known as attenuated total reflectance (ATR) is a good technique when information is required of the top surface (1 to 10 J.L-m in depth) (7). This technique cannot, however, be used with samples of irregular morphology since it is difficult to obtain good optical contact between the sample and the ATR crystal. These problems are surmountable with the aid of P AS-FTIR. Photoacoustic spectroscopy renders pos-sible the simultaneous study of sample surface and bulk and it has been demonstrated to be a useful technique for obtaining mid-infrared spectra of solid samples with minimal preparation (8-13). Moreover, the presence of up to 25 wt% carbon black, a highly absorbing filler used in many construction products, does not cause any inter-ference (14). PAS-FTIR is particularly useful for mea-suring the spectra of materials, such as construction sealants, that suffer from a change in morphology dur-ing weatherdur-ing. The applications of this technique are quite widespread and include the analysis of catalytic surfaces, (15-17), electrode surfaces (18), polymer films (7, 19, 20), evaluation of accelerated weathering for polyester-urethane coatings (20), cured paint media and weathering of alkyd paints (21).
It is clear that polymeric construction materials are very complex. In addition to the resin used as a modi-fier, plasticizers, stabilizers, fillers (carbon bl.ack or min-eral) are also added. Construction materials, such as weathered sealants, cannot always be characterized by transmission or reflection techniques because they are black, grey or opaque, thick, and, as previously
Silicone Sealants
mentioned, change morphology with weathering. PAS-FTIR technique is known to be capable of providing spectral information for this type of material with min-imal sample preparation. For this reason, PAS was con-sidered useful for this investigation.
In this study, PAS and STA are used to monitor the chemical changes that occur in silicone-based sealants during exposure to water, both alone and in combination with UV-radiation. This work is part of a larger project which attempts to compare the weatherability of differ-ent sealants such as polyurethanes, polysulfides and sil-icones. The overall objective is to compare and correlate the various chemical and mechanical properties of these caulking materials using both natural and accelerated aging.
Experimental
Five commercially available silicone sealants were obtained from different manufacturers and cast as free-fllms (see Table I). The free films were placed back-to-hack in a frame which separated the fllms with an alu-minum divider. All of the free films were loaded into a xenon-arc Weather-o-meter (Atlas Electric Devices Company) for weathering. One series of films was thus exposed to light and water while the other was exposed to water only. Samples were removed every 1000 hours and stored for further analysis. The total time of expo-sure was 8000 hours.
Table I. Sample Description
Sample Colour
Sl
Off-whiteS2
WhiteS3
BlackS4
GreyS5
WhiteThe weathering conditions used for the samples were as follows:
Irradience: 0.37 W m-2 nm-1 Black panel temperature: 63°C Relative humidity arc on: 50%
Light cycle: 3.5 hours on; 0.5 hours off
Specimen spray cycle (deionized water): 118 min off; 20 min on
Rack spray cycle: when arc off
Volume 39, No. 1, 1994
9
Thermal analysis
Thermoanalytical studies of unweathered and weath-ered sealants were performed using a Seiko
Simultaneous Thermal Analyzer (STA) model
TG/DTA320. This module was interfaced to a Seiko SS5200H disk station. A specimen, weighing between 7 and 8 mg, was heated under a nitrogen atmosphere (100 mL min-1
) from 40°C (no weight loss observed before 40°C) to 900°C at 10°C min-1
• All samples were run in duplicate.
Fourier transform infrared photoacoustic spectroscopy Fourier transform infrared spectra were measured on a Nicolet 170SX spectrometer as well as a Nicolet 800 spectrometer. Both systems were equipped with an MTEC photoacoustic cell (model 200). For sampling, disks of 8 mm diameter were cut with a cork borer. In a few cases, where the samples were too thick, the thick-ness was reduced by slicing with a scalpel. Conditions used for recording the spectra were: resolution 8 em -1
; mirror velocity setting 4; number of scans 512; helium purge; Happ-Genzel apodization; standard phase cor-rection. In addition to the weathered samples, spec-imens of each material before exposure were ana-lyzed and used as controls. In all cases, no significant difference was observed between the duplicate spec-imens tested, and only one of the two spectra is included here. All spectra were ratioed against a background recorded earlier the same day with car-bon lampblack (Fisher Scientific, Cat. No. C-198) or with a carbon membrane standard reference. The spectra obtained were generally of good quality, but a higher noise level below 600 em -l meant that only
large features could be discerned in this region. The ratioed spectra were corrected for nonlinear response in PAS-FTIR by using the Nicolet macro CPA Spectra were recorded for unexposed samples and samples exposed for 2000, 4000, 6000 and 8000 hours. The sam-ples corresponding to odd-numbered multisam-ples of 1000 hours of exposure were not analyzed because so little difference was observed between samples correspond-ing to even-numbered periods.
Results and Discussions
Simultaneous thermal analysis (STA)
STA data provided simultaneous DTA and TG/DTG data of the silicone sealants. A typical STA plot (TG, DTG and DTA) is shown in Figure 1. In this case, how-ever, only weight loss (TG) and the associated derivative
10 l O r - - - , TG
ッヲセ@
I
OTA -10 C) セRP@ J(, セ@ I I OTG roo 40() bOO 800 H MP (' ャャAセZ[ャQョヲャャ@ 1000 110 90 10 ウッセ@ 00,,
Figure 1. Typical STA plot for an unaged silicone sealant.(DTG) data will be discussed since it is these values which yielded the most information. Two endothermic events can be observed in the DTA curve shown in Figure 1. The first (between approximately 300 and 600°C) is related to the decomposition of the polymer while the second event (between 700 and 800°C) is most likely due to the decompostion of the filler (e.g., CaCOs). The onsets of TG and DTG curves were also established in an attempt to determine if they could be used in a rou-tine fashion. Unfortunately, this was found to be a tedi-ous process and is operator dependent, therefore the data are presented but will not be discussed further. All of the data are summarized in Tables II to VI.
In general, two major weight losses are recorded for the silicone sealants. The first weight loss occurs in the 200-685°0 region and is most likely due to the decompo-sition of the siloxane polymer. The second weight loss, observed between 685°C and 800°C, arises from the breakdown of calcium carbonate. Weight losses for the sealants at 0 and 6000 hours are summarized in Table II.
As shown in Table II, the Sl silicone sealant does not undergo significant changes with weathering. The sam-ples start to lose weight at -300°C (Figure 2) and the total weight loss is 67-69% for both the unexposed and UV/water exposed samples. The weight loss in the 300°C-685°C region for the weathered samples is only 1-2% lower than that of the control sample, whereas the second weight loss (685°C-800°C) remains unchanged.
Table II. Onset Temperatures and Weight Losses for Sl Silicone Sealant
Sample T CCI · Tmax Wt loss T s&I'CI 'Tmax Wt loss I Residue
Sl TG DTG (OC) (%) TG DTG I (OCI (%) i (%) Control 494 474
I
571 44.8 707 688,743 2381 :n.4 60001/W 520 469 609 44.3 723 697 749 24.2 1l.5 6000W 489 434 584 42.5 711 692 741 24.4 33.2 Figure2.Ralph M. Paroli et al.
6000L/W 6000W Control
200 400 600 800 1000
lEMP c tHe at 1nQ 1
Derivative thermogravimetric (DTG) curves for the Sl sample; unexposed (control), exposed to water only (6000 W) and exposed to both water and ultraviolet light (6000 L!W).
The total weight loss for the series was merely 3% less for the sample exposed to water only. This variation may be attributed to inhomogeneity in the sealant or experimental errors rather than being due to weathering.
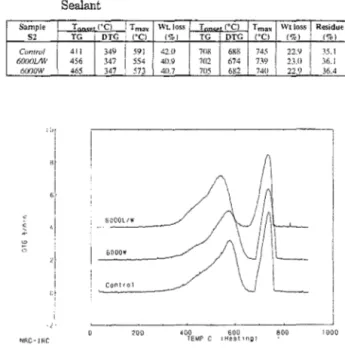
The 82 sealant series (Table III and Figure 3) has a total weight loss of 64-65%. This series starts to lose weight at a lower temperature than the Sl samples ( -200°0). Hence, it is thermally less stable. The TG and the DTG curves of the 82 samples (control and exposed) show similar trends to those observed for Sl sealants.
Table III. Onset Temperatures and Weight Losses for 82 Silicone Sealant Sample 52 Control 60001/W 6000W NAC- JRC Figure 3.
T ('CI Tma" Wtloss T I'CI Tmax Wtloss Residue
TG I DTG ('CI (%) TG DTG ('C) (%) (%) 411
I
349 ! 591 42.0 ?OR 688 745 22.9 35.1 456 347i
554 40.9 702 674 n9 23.0 16.1 465 347 573 40.7 705 682 7411 22.9 36.4 Cent rolセ@
IセセG@
I
6000LIW 6000W 200 400 600 800 liJOO TEMP C !Heat 1nglDerivative thermogravimetric (DTG) curves for the 82 sample; unexposed (control), exposed to water only (6000 W) and exposed to both water and ultraviolet light (6000 L/W).
Silicone Sealants
However, the peak temperature of the two weight losses for the samples exposed to light and/or water are lower than that of the control. Therefore, the weathering appears to affect thermal stability. A shoulder can also be observed between 200°C and 500°C. In the 685°C to 800°C region, the weight loss was 23% for both the unweathered and weathered samples.
The peak height of the DTG curves for the S3 control sample is similar for both weight losses. A similar trend is observed in the sample exposed to water. The first peak of the DTG curve for the control sample (Figure 4, control) has a small shoulder between 400°C and 550°C, which is not observed for the exposed samples (Figure 4, 6000 and 6000 L/W). The first weight loss for the sample exposed to water only is 3% lower than that of the control and the sample exposed to light and water (see Table IV). The latter does not seem to be affected by weathering, however, the same peak becomes sharper and an increase in peak height of 40% is observed. Although only the sample exposed to water shows a 3% lower weight loss, the shoulder in the con-trol sample is not observed in either of the exposed sam-ples. This may be due to the loss of a component in the sample during exposure to water. The sharpness of the first derivative weight loss of the DTG curve for the sample exposed to light, as well as its increase in peak height, shows that this sample is thermally less stable.
NRC-J><C I
,.
I 6000L/W 6000W Control セ@ 0 200 400 600 800 1000 1EMP C !Heat 1ng lFigure 4. Derivative thermogravimetric (DTG) curves for the S3 sample; unexposed (control), exposed to water only (6000 W) and exposed to both water and ultraviolet light (6000 L/W).
Table N. Onset Temperatures and Weight Losses for S3 Silicone Sealant
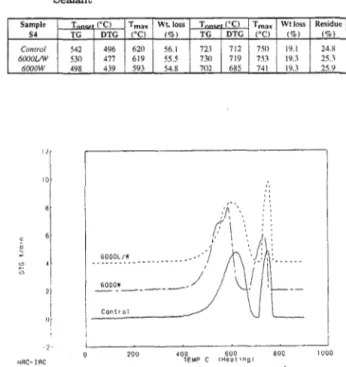
Sample T ('C) Tmax Wtloss T ('C) Tmax Wtloss Residue 53 TG DTG ('C) (%) TG DTG ('Cl (%) (%) Control 457 407 565 46.9 699 670 740 2!.6 3!.6 6000UW 483 397 555 46.9 691 659 B8 2!.6 3!.6 6000W 486 405 569 44.3 703 679 747 22.7 33.0 Volume 39, No. 1, 1994 11 The DTG curve for the S4 control silicone sample (Figure 5) shows that the sample starts to lose weight at a similar temperature (300°C) as the Sl and S3 series. From the data in Table V, it can be observed that the S4 series shows the largest total weight loss (75%) of all series studied, and that the control and exposed samples show similar weight losses. A comparison of the weight losses for this sample with those for the previous sam-ples reveals that S4loses more weight in the first region and less in the second. The peaks of the DTG curves for the control sample in both weight loss regions (Figure 5, control) have similar peak heights. UV radiation and/or water exposure seem to have an opposite effect on the shape of the peaks of the DTG curves for this series. Both exposed samples (Figure 5, 6000 and 6000 L/W), show two unresolved peaks for the first weight loss, but this peak becomes sharper for the sam-ple exposed to water. In addition, the peak height of the second peak decreases slightly for the sample exposed to water, whereas it becomes sharper for the sample exposed to light. Although the DTG curves for the con-trol and exposed samples have different shapes, the series does not seem to be significantly affected by the two types of weathering conditions used. However, it is more affected than Sl, S2, and S3.
Table V. Onset Temperatures and Weight Losses for S4 Silicone Sealant
Sample I T I'Cl Tmax! Wt.loss T ('Cl T max I Wt loss 1 Residue S4 TG DTG ('Cl i%l TG DTG (OC) (%) (%) 620 I I I Conrml I 542 496 56.1 723 712 750 119.1 24.H 6000UW 530 477 619 55.5 730 719 753 19.3 25.3 6000W , 498 439 I 593 54.8 702 685 741 19.3 25.9 "[ i 10[
.,
I 200 400 600 800 lUOOiセrcM lAC lEMP C rHe::.H lf1Ql
Figure 5. Derivative thermogravimetric (DTG) curves for the S4 sample; unexposed (control), exposed to water only (6000 W) and exposed to both water and ultraviolet light (6000 L/W).
12
100 セ@00 600 800 1000 :mc-lRC TEMP C !HeatlnQI
Figure6. Derivative thermogravimetric (DTG) curves for the S5 sample; unexposed (control), exposed to water only (6000 W) and exposed to both water and ultraviolet light (6000 L/W).
Table VI. Onset Temperatures and Weight Losses for S5 Silicone Sealant
Sample T (°C) I T max
l
Wt loss T (OC) Tmax Wt loss ( Residuess TG DTG (0C)
(CiC) TG DTG ("Cl (%) ' (l)(:)
Control
I
447 1 SSセ@ UセV@I
47.0 710 6X2 747 17.9 1 :.3.760001/W 4251 331 560 47.9 693 656 739 17.4 ) セUNP@
6000W 436 338 561 I 48.2 692 657 729 17.6 3.'U
The TG/DTG curves for control and exposed S5 sili-cone series are displayed in Figure 6 while the data are summarized in Table VI. A shoulder between 250°C and 500°C is observed for the control sample. It can also be seen that the first peak of DTG curve for the control sample is higher than the second one. Samples exposed to UV-radiation and/or water, do not show the shoulder on the first peak and the two weight losses occur at tem-peratures slightly higher than that of the control sam-ple. They also show a slight decrease in the peak height of the first peak, with a proportional increase on the peak height of the second peak.
FTIR Analysis
Generally, there was very little change in the FTIR spectra for the five different sealants afte.r 8000 hours of weathering. All of the sealant spectra contained the general peaks characteristic of the siloxane polymer.
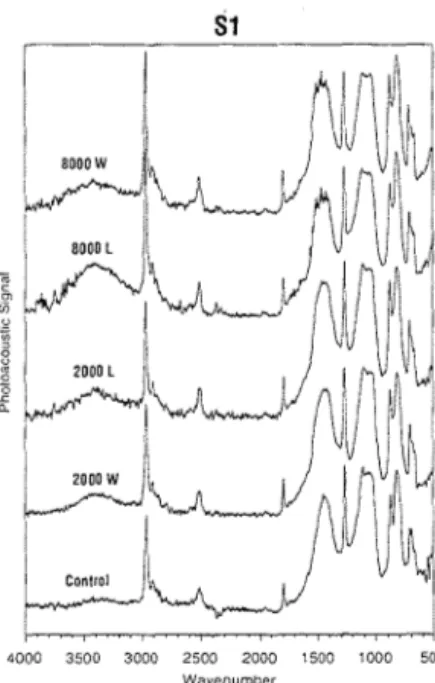
The spectrum of the unexposed S1 specimen (Figure 7) shows a number of peaks characteristic of calcium carbonate: a broad band from 1600-1300 em-\ sharper peaks at 879 and 712 em
-r,
and weak peaks at 2513 and 1796 em -1• These are due to calcite (a type of calcium carbonate). The remaining bands are characteristic of a polydimethylsiloxane polymer. They include (10) the C-H stretching peaks at 2966 and 2904 em-\ the broad Si-0-Si band at 1200-1000 cm-r, the Si-CHa peaks at 1267 and 822 em-\ and the peak at 700-660 em -1
•
Ralph M. Paroli et aL
4000 3500 3000 2500 2000 1500 1000 500 Wavenumber
Figure 7. P AS-FTIR spectra for the Sl silicone sealant prior to
weathering, after 2000 and 8000 hours of exposure in a weathering device.
Spectra of samples exposed for 2000, 4000 and 8000 hours to water and UV radiation/water spray closely resemble Figure 7 control. The only significant differ-ence is the appearance of a broad OH band near 3400 em -1
, which could be due simply to absorbed water.
The spectrum of the control S2 sample shows the same peaks observed in S1, corresponding to calcium carbonate and polydimethylsiloxane. The slightly differ-ent shape of the carbonate band at 1600-1300 cm-1 may indicate a different type of calcium carbonate (e.g. pre-cipitated). Spectra of samples exposed for 2000, 4000 and 8000 hours to water and UV radiation/water spray resemble the spectrum of the unexposed sample, except for the appearance of a broad 0 H band near 3400 em -1
•
In addition, the sample exposed to water for 2000 hours displayed peaks at 2919, 2850, and 1579 cm-1
• The first two peaks are typical of long hydrocarbon -(CHz)n-chains, and the third could be due to carboxylate ions -COO-. Peaks at these positions are characteristic of cal-cium salts of fatty acids, for example calcal-cium stearate. Originally, it was unclear whether these peaks originate from the sample itself (surface enrichment in calcium stearate additive) or from contamination.
Unlike the previous two materials, the S3 sealant is black. The presence of carbon black is probably respon-sible for the somewhat stronger baseline absorption observed in the spectra (about 5% as compared to less than 1% in the previous cases). Otherwise, the spectra show the same peaks as S1, arising from calcium car-bonate and polydimethylsiloxane. Again, exposure to water or UV radiation/water spray for 2000, 4000 and
Silicone Sealants
S4
4000 3500 3000 2500 2000 1500 1000 500 Wavenumber
Figure 8. P AS-FTIR spectra for the S4 silicone sealant prior to weathering, after 2000 and 8000 hours of exposure in a weathering device.
8000 hours has little effect on the spectrum. The increase in OH absorption on exposure is less pro-nounced than in the previous two cases, but the samples exposed to 1N radiation/water spray show signs of a decrease in the intensity of the carbonate peak at 1450 em -1 with respect to the silicone peak at 1266 em -1
• It is not clear whether this is due to loss of carbonate, a change in the nature of the carbonate species, or sim-ply to compositional variations within the material.
The 84 spectra (Figure 8) showed the same peaks as before, namely calcium carbonate and polydimethylsi-loxane. Once again, exposure to water or 1N radiation/ water spray for 2000, 4000 and 8000 hours had little effect on the spectrum.
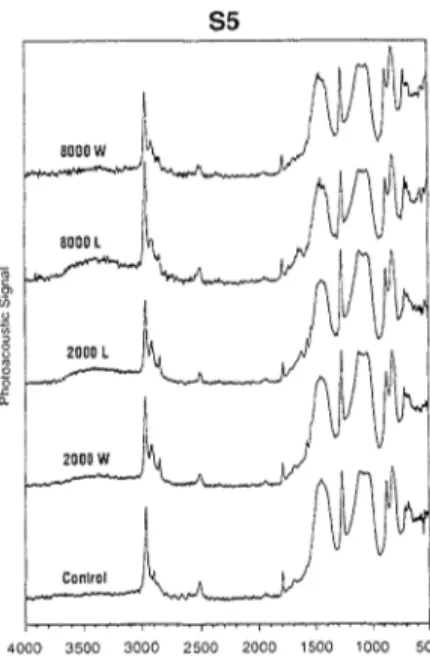
The spectra for the 85 sealant showed once again the same components: calcium carbonate and polydimethyl-siloxane (Figure 9). However, there is a weak shoulder near 1690 cm-1
not observed in the previous cases. Also, the notably higher absorption in the 700-500 em -1
range could indicate the presence of another pigment such as titanium dioxide. The shape of the carbonate band is similar to that seen in 82. The samples exposed to water and UV radiation/water spray show an increase in OH absorption near 3400 em -1
• The effect of water can be
seen more clearly after subtraction of the unexposed sample spectrum (Figure 10). It is interesting to note that all four of the exposed samples show the peaks (in the subtracted spectra) at 2918, 2850, 1578, 1540 em -l
characteristic of calcium stearate, as mentioned earlier in connection with 82.
The possibility was considered that the "calcium stearate" observed in some of the spectra could be
Volume 39, No. 1, 1994
13
S5
4000 3500 3000 2500 2000 1500 1000 500 Wavenumber
Figure 9. P AS-FTIR spectra for the S5 silicone sealant prior to
weathering, after 2000 and 8000 hours of exposure in a weathering device. S5 I
I
2000 W minus control • I セ@ I '1{11I
yI'
'I'
'
\l
i
4000 3500 3000 2500 2000 1500 1000 500 WavenumberFigure 10. PAS-FTIR difference spectrum for the S5 silicone seal-ant (2000 hours exposure to water only - control). See text for explanation.
transferred from the plastic bags used to store the sam-ples. To check this, the bag used for the 85 sample exposed to water for 4000 hours was rubbed against a clean KBr window and the spectrum measured in trans-mission. The resulting weak spectrum corresponded to a fatty amide such as oleamide or erucamide. Such prod-ucts are commonly used in the processing of polyethyl-ene. There-was no evidence of calcium stearate. Calcium carbonate is available in a form treated with stearic acid. It is possible that this type of calcium carbonate was used and that the weathering resulted in surface enrich-ment in stearate.
14
Conclusions
The five silicone-based materials all have a similar composition. The main components are a polydimethyl-siloxane polymer and calcium carbonate; the S5 may also contain some titanium dioxide. Up to 8000 hours of exposure, all five materials are fairly resistant to the two types of weathering conditions employed. Only minor changes were observed using TG/DTG and PAS-FTIR spectroscopy. In some cases there is an increase in hydroxyl absorption (possibly signifying an increase in water absorption). Furthermore, the weathering of specimens S2 and S5 resulted in surface enrichment in calcium stearate. The main weight losses observed by TG/DTA are ュッセエ@ likely due to the siloxane polymer and calcium carbonate. Additional work using a hyphenated technique such as TG/DTA-FTIR or quenching the sample at various temperatures would facilitate the identification of the various components.
References
1. D. Feldman, ''Polymeric Building Materials", Elsevier Applied Science, NY, NY, 1989.
2. R.B. Seymour, "Plastic Mortars, Sealants, and Caulking Compounds", ACS Symposium Series 113, ACS, Washington, D.C., 1979.
3. J. Wypych, ''Weathering Handbook", Chemtec Publishing, Toronto, 1990.
Ralph M. Paroli et al.
4. Encyclopedia of Polymer Science and Engineering, 2nd Edition, Supplement Volume, John Wiley and Sons Inc. 1989, USA p. 690. 5. G. Busse and B. Bulemer, Infrared Phys., 18, 22J (1978); G. Busse
and B. Bulemer, Infrared Phys., 18, 631 (1978).
6. Harrick Scientific Corporation, "Optical Spectroscopy Sampling Techniques Manual", 1987.
7. R.O. Carter III, M.C. Paputa Peck, and D.R. Bauer, Polymer Degradation and Stability, 23, 121 (1989).
8. M.G. Rockley, Chem. Phys. Lett., 68, 455 (1979).
9. M.G. Rockley, D.M. Davis, and H.H Richardson, Science, 210,918 (1980).
10. D.W. Vidrine, Appl. Spectrosc., 34, 314 (1980).
11. S.R. Lowry, D.G. Mead, and D.W. Vidrine, Anal. Chem., 54 546, (1982).
12. V. Renugopalakrishnan and R.S. Bhatnagar, J. Am. Chern. Soc.,
106, 2217 (1980).
13. S.M. Riseman, F.E. Massoth, G.M. Dhar, and E.M. Eyring, J. Phys. Chern., 86, 1760 (1982).
14. R.O. Carter, M.C. Paputa Peck, M.A Samus, and P.C. Kilgoar, Jr., Appl. Spectros., 43, 1350 (1989).
15. J.B. Kinney and R.H. Staley, J. Phys. Chern., 87, 3735 (1983). 16. J.A Gardella, Jr., D.-Z. Jiang, and E.M. Eyring.,Appl. Spectrosc.,
37, 131 (1983).
17. M.D. Porter, D.H. Karweik, T. Kuwana, W.B. Theis, G.B. Norris, and T.O. Tiernan, Appl. Spectrosc., 38, 11 (1984).
18. N. Teramae and S. Tanaka, "Fourier Transform Infrared Characterization of Polymers, Polymer Science and Technology'', Volume 36, Hatsuo Ishida, Ed., Plenum Press, New York, p. 315 (1987).
19. John R. Ferraro and K. Krishnan, "Practical Fourier Transform Infrared Spectroscopy, Industrial and Laboratory Chemical Analysis", Academic Press, Inc., p. 380 (1990).
20. D.R. Bauer, M.C. Paputa Peck, and R.O. Carter III, J. Coatings Techno!., 59 (755), 103 (1987).
21. J. Hodson and J.A Lander, Polymer, 28, 251 (1987).