HAL Id: inserm-00726449
https://www.hal.inserm.fr/inserm-00726449
Submitted on 30 Aug 2012
HAL is a multi-disciplinary open access
archive for the deposit and dissemination of
sci-entific research documents, whether they are
pub-lished or not. The documents may come from
teaching and research institutions in France or
abroad, or from public or private research centers.
L’archive ouverte pluridisciplinaire HAL, est
destinée au dépôt et à la diffusion de documents
scientifiques de niveau recherche, publiés ou non,
émanant des établissements d’enseignement et de
recherche français ou étrangers, des laboratoires
publics ou privés.
Altered skeletal muscle lipase expression and activity
contribute to insulin resistance in humans.
Pierre-Marie Badin, Katie Louche, Aline Mairal, Gerhard Liebisch, Gerd
Schmitz, Arild Rustan, Steven Smith, Dominique Langin, Cedric Moro
To cite this version:
Pierre-Marie Badin, Katie Louche, Aline Mairal, Gerhard Liebisch, Gerd Schmitz, et al.. Altered
skeletal muscle lipase expression and activity contribute to insulin resistance in humans.. Diabetes,
American Diabetes Association, 2011, 60 (6), pp.1734-42. �10.2337/db10-1364�. �inserm-00726449�
Altered Skeletal Muscle Lipase Expression and Activity
Contribute to Insulin Resistance in Humans
Pierre-Marie Badin,
1,2Katie Louche,
1,2Aline Mairal,
1,2Gerhard Liebisch,
3Gerd Schmitz,
3Arild C. Rustan,
4Steven R. Smith,
5Dominique Langin,
1,2,6and Cedric Moro
1,2OBJECTIVE—Insulin resistance is associated with elevated
content of skeletal muscle lipids, including triacylglycerols (TAGs)
and diacylglycerols (DAGs). DAGs are by-products of lipolysis
consecutive to TAG hydrolysis by adipose triglyceride lipase
(ATGL) and are subsequently hydrolyzed by hormone-sensitive
lipase (HSL). We hypothesized that an imbalance of ATGL relative
to HSL (expression or activity) may contribute to DAG
accumu-lation and insulin resistance.
RESEARCH DESIGN AND METHODS
—We first measured
lipase expression in vastus lateralis biopsies of young lean (n = 9),
young obese (n = 9), and obese-matched type 2 diabetic (n = 8)
subjects. We next investigated in vitro in human primary myotubes
the impact of altered lipase expression/activity on lipid content and
insulin signaling.
RESULTS
—Muscle ATGL protein was negatively associated
with whole-body insulin sensitivity in our population (r =
20.55,
P = 0.005), whereas muscle HSL protein was reduced in obese
subjects. We next showed that adenovirus-mediated ATGL
over-expression in human primary myotubes induced DAG and ceramide
accumulation. ATGL overexpression reduced insulin-stimulated
glycogen synthesis (
230%, P , 0.05) and disrupted insulin
sig-naling at Ser1101 of the insulin receptor substrate-1 and
down-stream Akt activation at Ser473. These defects were fully
rescued by nonselective protein kinase C inhibition or
concom-itant HSL overexpression to restore a proper lipolytic balance.
We show that selective HSL inhibition induces DAG
accumula-tion and insulin resistance.
CONCLUSIONS—Altogether, the data indicate that altered
ATGL and HSL expression in skeletal muscle could promote
DAG accumulation and disrupt insulin signaling and action.
Targeting skeletal muscle lipases may constitute an interesting
strategy to improve insulin sensitivity in obesity and type 2
diabetes.
Diabetes 60:1734–1742, 2011
S
keletal muscle insulin resistance is a strong risk
factor of type 2 diabetes and cardiovascular
dis-eases (1,2). Dysfunctional adipose tissue can lead
to lipid oversupply and increased
flux of free fatty
acids (FFAs) into skeletal muscle and is associated with the
accumulation of intramyocellular triacylglycerols (IMTGs)
(3
–5). This chronic lipid overload in tissues can evolve to
a state of lipotoxicity leading to cell dysfunction (6). The
term
“lipotoxicity” defines more generally in skeletal muscle
a state of lipid overload (increased concentrations of
long-chain acyl-CoA, diacylglycerols [DAGs], and ceramide)
causing insulin resistance (7
–12). DAGs have been shown
to activate novel protein kinase C (PKC) isoforms, such as
the novel PKC
u leading to insulin receptor substrate-1
(IRS-1) serine phosphorylation and impaired downstream
insulin signaling (10
–13). DAGs can be formed through
multiple pathways but are also formed as intermediates
during triacylglycerol (TAG) synthesis and hydrolysis (14).
The control of lipolysis in skeletal muscle has mainly been
attributed to hormone-sensitive lipase (HSL), which
ex-hibits a 10-fold higher speci
fic activity for DAG than TAG
(15). HSL null mice display normal TAG hydrolase activity
after an overnight fast and accumulate large amounts of
DAG (16). Recently it was shown that adipose triglyceride
lipase (ATGL) plays a major role in the regulation of
cel-lular TAG stores in various tissues of the body, including
heart and skeletal muscle (17,18). ATGL speci
fically drives
the hydrolysis of TAG into DAG (18). ATGL-de
ficient mice
are more insulin sensitive and glucose tolerant despite a
threefold increase in TAG content in their skeletal muscle
(17). The molecular mechanism underlying this phenotype
remains unclear. In the current study, we hypothesized
that an imbalance of ATGL relative to HSL could increase
intracellular DAG concentrations and promote insulin
re-sistance. To test this hypothesis, we
first examined the
relationship between muscle ATGL expression and
whole-body insulin sensitivity in a wide range of subjects. We
next manipulated the expression/activity of ATGL and HSL
in vitro in cultured human primary skeletal muscle cells and
evaluated its impact on lipid pools and insulin signaling.
RESEARCH DESIGN AND METHODS
Skeletal muscle cell culture.Satellite cells from vastus lateralis or rectus abdominis biopsies of lean, healthy, insulin-sensitive subjects were isolated by trypsin digestion, preplated on an uncoated petri dish for 1 h to remove fibroblasts, and subsequently transferred to T-25 collagen-coated flasks in Dulbecco’s modified Eagle’s medium (DMEM) low glucose (1 g/L) supple-mented with 10% FBS and growth factors (human epidermal growth factor, BSA, dexamethasone, gentamicin, amphotericin B [Fungizone, Invitrogen, Grand Island, NY], and fetuin) as previously described (19). Cells from several donors were pooled and grown at 37°C in a humidified atmosphere of 5% CO2. Differentiation of myoblasts into myotubes was initiated at approximately 90% confluence by switching to a-minimum essential medium with antibiotics, From1INSERM, U1048, Obesity Research Laboratory, Institute of Metabolic
and Cardiovascular Diseases (I2MC), Toulouse, France; the2Paul Sabatier University, University of Toulouse, Toulouse, France; the3Institute of Clin-ical Chemistry, University of Regensburg, Regensburg, Germany; the4 De-partment of Pharmaceutical Biosciences, School of Pharmacy, University of Oslo, Oslo, Norway; the5Translational Research Institute for Metabolism and Diabetes and the Burnham Institute, Florida Hospital, Winter Park, Florida; and the6Centre Hospitalier Universitaire de Toulouse, Biochemis-try Laboratory, Biology Institute of Purpan, Toulouse, France.
Corresponding author: Cedric Moro, cedric.moro@inserm.fr. Received 24 September 2010 and accepted 3 March 2011. DOI: 10.2337/db10-1364
This article contains Supplementary Data online at http://diabetes. diabetesjournals.org/lookup/suppl/doi:10.2337/db10-1364/-/DC1.
Ó 2011 by the American Diabetes Association. Readers may use this article as long as the work is properly cited, the use is educational and not for profit, and the work is not altered. See http://creativecommons.org/licenses/by -nc-nd/3.0/ for details.
2% FBS, and fetuin. The medium was changed every other day, and cells were grown up to 5–6 days.
Overexpression of lipases.Human ATGL and HSL cDNAs were cloned into the pcDNA3 vector (Invitrogen Corp., Carlsbad, CA). DNA sequencing was performed to check correct insertion of the cDNA using an ABI3100 automatic sequencer (Applied Biosystems, Courtaboeuf, France). Adenoviruses ex-pressing in tandem greenfluorescent protein (GFP) and ATGL or HSL were constructed, purified, and titrated (Vector Biolabs, Philadelphia, PA). An ad-enovirus containing the GFP gene only was used as a control. Myotubes were infected with the control (GFP), ATGL, and HSL adenoviruses at day 4 of differentiation and remained exposed to the virus for 24 h in serum-free DMEM containing 150mmol/L of oleate complexed to BSA (ratio 4:1). Oleate was preferred to palmitate for lipid loading of the cells to favor TAG synthesis and to avoid the intrinsic lipotoxic effect of palmitate (20,21). No adenovirus-induced cellular toxicity was observed as determined by chemiluminescent quantification of adenylate kinase activity (ToxiLight, Lonza Group Ltd., Basel, Switzerland). For insulin signaling experiments, infected myotubes were in-cubated for 20 min in DMEM low glucose with or without 100 nmol/L of insulin (Sigma-Aldrich, Lyon, France).
Determination of glycogen synthesis. Cells were preincubated with a glucose- and serum-free a-minimum essential medium for 90 min and then exposed to DMEM supplemented with D[U-14C]glucose (1
mCi/mL; PerkinElmer, Boston, MA) in the presence or absence of 100 nmol/L insulin for 3 h. After incubation, glycogen synthesis was determined as described previously (22). Pulse-chase studies of lipid metabolism.Cells were pulsed overnight (18 h) with a combination of [1-14C]oleate (1
mCi/mL; PerkinElmer) and unlabeled oleate (100mmol/L final concentration) to prelabel the endogenous TAG pool. After incubation, myotubes were chased for 3 h in nutrient-deficient DMEM containing 0.1 mmol/L glucose and 0.5% FFA-free BSA. At the end of in-cubation, total lipids were extracted in chloroform/methanol (2v/1v) and separated by thin-layer chromatography as previously described (23). Incor-poration rates were normalized to total protein content measured in each well. Western blot analysis.Muscle tissues and cell extracts were homogenized in a buffer containing 50 mmol/L HEPES, pH 7.4, 2 mmol/L EDTA, 150 mmol/L NaCl, 30 mmol/L NaPO4, 10 mmol/L NaF, 1% Triton X-100, 10mL/mL protease inhibitor (Sigma-Aldrich), 10mL/mL phosphatase I inhibitor (Sigma-Aldrich), 10mL/mL phosphatase II inhibitor (Sigma-Aldrich), and 1.5 mg/mL benzami-dine HCl. Tissue homogenates were centrifuged for 25 min at 15,000g, and supernatants were stored at280°C. Solubilized proteins from muscle tissue and myotubes were run on a 4–12% SDS-PAGE (Bio-Rad, Hercules, CA), transferred onto nitrocellulose membrane (Hybond ECL, GE Healthcare, Buckingamshire, U.K.), and incubated with the primary antibodies (ATGL, Cell Signaling Technology Inc., Beverly, MA; Perilipin-A, Abcam Inc., Cambridge, MA). The HSL antibody was as previously described (24). Antibodies for in-sulin signaling p-Ser473–Akt, Akt, p-Ser1101–IRS-1, p-Tyr612–IRS-1, IRS-1, and p-Ser660–HSL were all from Cell Signaling Technology Inc. Subsequently, im-munoreactive proteins were determined by enhanced chemiluminescence re-agent (GE Healthcare, Waukesha, WI) and visualized by exposure to Hyperfilm ECL (GE Healthcare). Glyceraldehyde-3-phosphate dehydrogenase (GAPDH) (Cell Signaling Technology Inc.) served as an internal control.
Subjects.Nine young lean, nine young obese, and eight obese subjects with type 2 diabetes were recruited in the study (Table 1). The subjects with type 2 diabetes were diet-controlled or were taking metformin (n = 6) and insulin (n = 2), and were otherwise healthy with an average HbA1cof 7.06 0.78%. None of them were taking thiazolidinediones. The protocol was approved by
the institutional review board of the Pennington Biomedical Research Center, and all volunteers gave written informed consent. After participants com-pleted the screening visit, fat mass was measured on a Hologic Dual Energy X-Ray Absorptiometer (QDR 2000, Hologic Inc., Bedford, MA). The partic-ipants were asked to refrain from vigorous physical activity for 48 h before presenting to the Pennington inpatient clinic and ate a weight-maintaining diet consisting of 35% fat, 16% protein, and 49% carbohydrate 2 days before the clamp and the muscle biopsy. Samples of vastus lateralis weighing 60–100 mg were obtained by muscle biopsy using the Bergstrom technique, blotted, cleaned, and snap-frozen in liquid nitrogen (25).
Hyperinsulinemic euglycemic clamp.Insulin sensitivity was measured by clamp (26). After an overnight fast, insulin (80 mU$ m22$ min21) and 20% glucose (to maintain plasma glucose at 90 mg/dL) were administered for 2 h. Glucose and insulin were measured in three independent blood plasma sam-ples 5 min apart at baseline and again at steady-state after approximately 2 h. Glucose disposal rate was adjusted for kilograms of fat-free mass.
Lipase activity assays.TAG hydrolase (TAGH) and DAG hydrolase (DAGH) activities were measured on cell extracts as previously described (24,27). Briefly, 1(3)-mono[3H]oleyl-2-O-mono-oleylglycerol (MOME) and [9, 10-3H(N)]triolein were emulsified with phospholipids by sonication. MOME is a DAG analog that allows for the measurement of DAGH activity because it is not a substrate for monoacylglycerol lipase. [9, 10-3H(N)]triolein was used to determine spe-cifically TAGH activity, and [3H]MOME was used to determine specifically DAGH activity.
TAG and DAG determination by gas chromatography-mass spectrometry. Total lipids were extracted from frozen muscle tissue samples and from myotubes harvested in water containing 0.25 mL 0.1% SDS. Lipids were extracted using the method of Folch et al. (28). The extracts werefiltered, and lipids were recovered in the chloroform phase. TAG and DAG were isolated using thin-layer chromatography on Silica Gel 60 A plates developed in pe-troleum ether, ethyl ether, and acetic acid (80:20:1), and visualized by rhoda-mine 6G. The TAG and DAG band was scraped from the plate and methylated using BF3/methanol as described by Morrison and Smith (29). The methylated FFAs were extracted with hexane and analyzed by gas chromatography us-ing an HP 5890 gas chromatograph equipped withflame ionization detectors, an HP 3365 Chemstation, and a capillary column (SP2380, 0.25 mm3 30 m, 0.25µm film; Supelco, Bellefonte, PA). Helium was used as a carrier gas. The oven temperature was programmed from 160 to 230°C at 4°C/min. FFA methyl esters were identified by comparing the retention times with those of known standards. Inclusion of the internal standards, 20:1 (trieicosenoin) and 17:0 (diheptadecanoin), permits quantitation of the amount of TAG and DAG in the sample.
Ceramide determination by electrospray ionization tandem mass spectrometry.Ceramide was quantified by electrospray ionization tandem mass spectrometry as previously described (30). Briefly, lipid extracts were prepared by the method of Bligh and Dyer (31) in the presence of nonnaturally occurring Cer 14:0, Cer 17:0. Samples were analyzed by directflow injection on a Quattro Ultima triple-quadrupole mass spectrometer (Micromass, Manchester, U.K.) using an HTS PAL autosampler (CTC Analytics AG, Zwingen, Switzerland) and an Agilent 1100 binary pump (Agilent Technologies GmbH, Waldbronn, Germany) with a solvent mixture of methanol containing 10 mmol/L ammo-nium acetate and chloroform (3:1, v/v). Aflow gradient was performed starting with aflow of 55 µL/min for 6 s followed by 30 µL/min for 1.0 min and an increase to 250µL/min for another 12 s. Ceramide was analyzed using a frag-ment of m/z 264 with N-heptadecanoyl-sphingosine as internal standard. Both ions [M+H]+and [M+H-H2O]+were used, and quantification was achieved by calibration lines generated by addition of Cer 16:0, 18:0, 20:0, 24:1, 24:0 to tissue and cell samples, respectively. Correction of isotopic overlap of ceramide species and data analysis were performed by self-programmed Excel (Microsoft Corp., Redmond, WA) macros according to the principles described previously (32).
Statistical analyses.All statistical analyses were performed using GraphPad Prism 5.0 for Windows (GraphPad Software Inc., San Diego, CA). One-way ANOVA followed by Bonferroni post hoc tests and paired, two-tailed Student t tests were performed to determine differences between groups and treat-ments. Two-way ANOVA and Bonferroni post hoc tests were used when ap-propriate. Normal distribution of the data was tested using the Shapiro-Wilk normality test. The relationships between muscle ATGL protein and clinical variables were analyzed using Spearman rank correlations. All values in Figs. 1 to 7 and Table 1 are presented as mean6 SEM. Statistical significance was set at P, 0.05.
RESULTS
Relationship
between
muscle
ATGL
and
insulin
sensitivity.
We
first investigated the relationship between
skeletal muscle ATGL protein content and insulin sensitivity
TABLE 1
Clinical characteristics of the subjects
Lean (9)
Obese (9)
Type 2
diabetes (8)
Sex (male/female)
6/3
5/4
6/2
Age (years)
23.8
6 0.8 23.7 6 0.8
53.8
6 3.8
b,eBody weight (kg)
66.4
6 3.6 94.5 6 3.4
c102.4
6 4.2
cBMI (kg/m
2)
22.5
6 0.5 32.9 6 0.5
c35.4
6 1.7
cBody fat (%)
20.4
6 2.8 31.1 6 1.6
a37.5
6 2.9
bGDR (mg/min/kg FFM)
9.3
6 0.8
7.0
6 0.6
a5.3
6 0.6
cFasting glucose
(mmol/L)
4.67
6 0.12 4.81 6 0.13
a7.51
6 0.76
b,dFasting insulin (mU/L)
8.4
6 1.2 13.2 6 1.1
a13.7
6 2.9
aData are mean6 SEM. FFM, fat-free mass; GDR, glucose disposal rate.aP , 0.05,bP , 0.01,cP , 0.001 vs. lean;dP , 0.01,eP , 0.001 vs. obese.
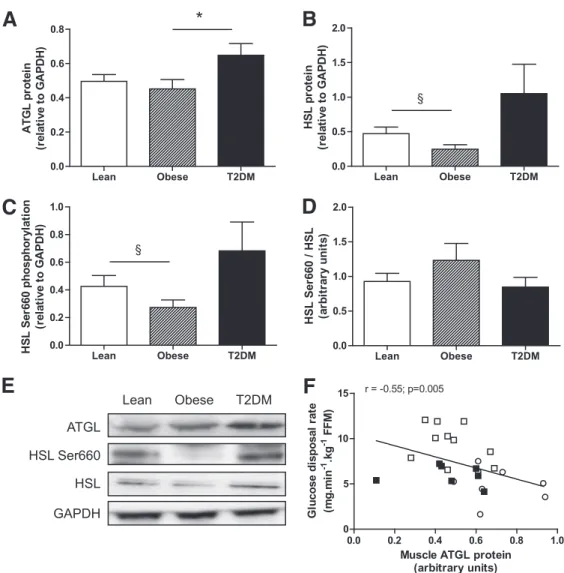
in human vastus lateralis samples of young lean, young
obese, and type 2 diabetic subjects. The characteristics of
the subjects are described in Table 1. As expected, obese
and type 2 diabetic subjects had lower insulin sensitivity
and higher body fat, fasting glucose, and fasting insulin
compared with lean subjects. Muscle ATGL protein content
was signi
ficantly elevated in type 2 diabetic subjects when
compared with lean and obese subjects (0.50
6 0.04, 0.45 6
0.05, and 0.65
6 0.07 arbitrary units [AU] for lean, obese,
and type 2 diabetic subjects, respectively) (Fig. 1A and E).
We also con
firm a reduced HSL Ser660 phosphorylation
(0.43
6 0.08 vs. 0.27 6 0.05 AU, 236%) (Fig. 1C and E) and
HSL protein content (0.47
6 0.09 vs. 0.25 6 0.07 AU, 248%)
(Fig. 1B and E) in skeletal muscle of obese compared with
lean subjects. HSL Ser660 phosphorylation (0.68
6 0.21 vs.
0.43
6 0.08 AU) and total HSL (1.05 6 0.43 vs. 0.47 6 0.09
AU) tended to increase in type 2 diabetic subjects
com-pared with lean subjects. The ratio of phosphorylated HSL
Ser660 to total HSL was not signi
ficantly changed between
groups (Fig. 1D). We noted a signi
ficant inverse relationship
between muscle ATGL protein content and whole-body
in-sulin sensitivity measured by euglycemic hyperinin-sulinemic
clamp across individuals (Fig. 1F). Similarly, muscle ATGL
protein was positively correlated with fasting glucose levels
(r = 0.56, P
, 0.005). Perilipin-A protein was not detectable
in any of the muscle samples excluding signi
ficant
con-tamination by in
filtrated adipocytes (data not shown).
Adenovirus-mediated ATGL overexpression.
We used
an adenovirus gene delivery method to overexpress ATGL
in our cell culture model. ATGL protein expression was
induced by
;3.4 6 0.2-fold (Fig. 2A). ATGL overexpression
increased TAGH activity twofold (Fig. 2B), but did not
change DAGH activity as expected (Fig. 2C). We checked
that the ATGL enzyme was operative in intact cells by
di-rectly measuring the rate of incorporation of radiolabeled
oleate into different lipid pools. We could show that ATGL
overexpression reduced the rate of incorporation of [1-
14C]
oleate into TAG (Fig. 2D), whereas the rate of incorporation
was increased into DAG (Fig. 2E) and intracellular FFA
(Fig. 2F).
Elevated ATGL expression promotes DAG and
cer-amide accumulation.
We found that total TAG content was
reduced in myotubes overexpressing ATGL (0.60
6
0.07-fold, P
, 0.01) (Fig. 3A). Conversely, consistent with an
FIG. 1. Skeletal muscle lipase protein expression in lean, obese, and type 2 diabetic subjects. Quantitative bar graph of ATGL protein (A), HSL protein (B), HSL Ser660 phosphorylation (C), and the ratio HSL Ser660 phosphorylation to total HSL (D) in vastus lateralis samples of lean, obese, and type 2 diabetic subjects.E: Representative blots of lipases and the loading control GAPDH. F: Relationship between vastus lateralis ATGL protein expression and glucose disposal rate measured by euglycemic hyperinsulinemic clamp across individuals. White square, lean; black square, obese; open circle, type 2 diabetes. *P < 0.05 compared with obese; §P = 0.08 compared with lean.
imbalance of ATGL relative to HSL, total DAG content
in-creased in myotubes overexpressing ATGL (1.5
6 0.1-fold)
(Fig. 3B). Ceramide content was also increased in myotubes
overexpressing ATGL (2.9
6 0.7-fold), possibly as a
conse-quence of increased intracellular FFA
flux and de novo
ceramide synthesis (Fig. 3C).
Elevated ATGL expression impairs insulin signaling
and action.
We
first showed that glycogen synthesis under
insulin stimulation was impaired by 30% (P
, 0.05) in
myotubes overexpressing ATGL (Fig. 4A). Insulin-stimulated
glycogen synthesis was signi
ficantly reduced in myotubes
overexpressing ATGL (0.72
6 0.07-fold, P = 0.01). We further
showed that ATGL overexpression increased Ser1101
–IRS-1
phosphorylation by twofold at baseline and under insulin
stimulation (P
, 0.001) (Fig. 4B and D). IRS-1
phosphory-lation at Ser1101 inhibits IRS-1 tyrosine phosphoryphosphory-lation and
function and is a primary target for PKC (13), suggesting
a possible link between ATGL and PKC activation.
Down-stream insulin activation of Akt on the residue Ser473 was
also impaired (change insulin minus baseline
231%, P ,
0.05) during ATGL overexpression. Ser473 Akt
phosphory-lation was increased at baseline (P
, 0.05) and reduced
under insulin stimulation in ATGL-overexpressing myotubes,
whereas total Akt protein content was not different across
treatments (Fig. 4C and D).
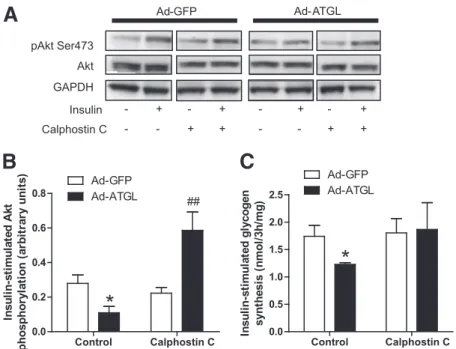
ATGL-mediated insulin resistance involves DAG and
PKC activation.
Because several isoforms of novel PKC
have been linked to insulin resistance (33), we used a
broad range nonselective PKC inhibitor in our
experi-ments. Calphostin C treatment greatly enhanced
insulin-stimulated Akt activation in ATGL overexpressing myotubes
(+163%, P
, 0.01 compared with GFP with calphostin C)
FIG. 2. ATGL overexpression increases TAG hydrolysis in myotubes.A: Quantitative bar graph of ATGL protein during adenovirus-mediated ATGL overexpression vs. GFP control (n = 4). Insets are showing representative blots of two independent experiments. TAG hydrolase activity (B) and DAG hydrolase activity (C) were measured in control myotubes (GFP) and myotubes overexpressing ATGL (n = 4). Pulse-chase studies using [1-14C]oleate were performed to determine the kinetics of the different lipid pools in response to ATGL overexpression. The rate of incorporation of radiolabeled oleate into (D) TAG, (E) DAG, and (F) FFA was determined in control myotubes (GFP) and myotubes overexpressing ATGL. *P < 0.05; **P < 0.01 vs. GFP (n = 4).
FIG. 3. Elevated ATGL expression promotes DAG and ceramide accumulation. Determination of (A) TAG, (B) DAG, and (C) ceramide content in control myotubes (GFP) and myotubes overexpressing ATGL. *P < 0.05 (n = 5).
(Fig. 5A and B). Similarly, nonselective PKC inhibition fully
rescued insulin-stimulated glycogen synthesis to control
GFP levels in myotubes overexpressing ATGL (Fig. 5C).
PKC inhibition by the nonselective inhibitor calphostin C
(1
mmol/L) was sufficient to fully rescue ATGL-mediated
insulin resistance. ATGL-mediated inhibition of glycogen
synthesis and Akt phosphorylation was not prevented
by the de novo ceramide synthesis inhibitor myriocin
(10
mmol/L) (Supplementary Fig. 1).
HSL overexpression is suf
ficient to rescue
ATGL-mediated insulin resistance.
We tested the hypothesis
that restoring a proper cellular lipolytic balance could
re-verse ATGL-mediated insulin resistance. To do so, we
concomitantly overexpressed ATGL and HSL in
differ-entiated myotubes and examined insulin signaling and
action. HSL overexpression by itself did not produce
lipo-toxicity and insulin resistance (Supplementary Fig. 2). The
concomitant overexpression of HSL and ATGL increased
both HSL (3.4
6 0.8-fold, P , 0.05) and ATGL (3.2 6 0.6-fold,
P , 0.05) protein content, TAGH activity (4.4 6 2.0-fold, P ,
0.01), and DAGH activity (5.1
6 1.8-fold, P , 0.01). When
coexpressed with ATGL, HSL was suf
ficient to completely
rescue ATGL-mediated insulin resistance. This was
evi-denced by a full restoration of insulin-mediated Akt
acti-vation (Fig. 6A and B) and glycogen synthesis (Fig. 6C) to
GFP control levels in myotubes coexpressing ATGL and
HSL compared with ATGL alone.
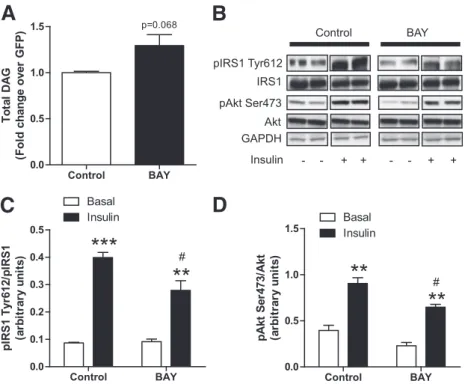
Selective HSL inhibition impairs insulin signaling.
We
next examined the effect of HSL-selective inhibition by the
BAY compound on DAG levels and insulin action. BAY has
been shown to be a highly selective HSL inhibitor in
pre-vious studies (24). We observed a moderate increase in
total DAG levels (+29%, P = 0.068) in myotubes treated for
24 h with 1
mmol/L of BAY (Fig. 7A). BAY treatment did
not increase ceramide content (0.57
6 0.07 vs. 0.57 6 0.06
nmol/mg for control and BAY, respectively). In the same
treatment condition, BAY reduced Tyr612
–IRS-1
phosphor-ylation on insulin treatment (
230%, P , 0.05) (Fig. 7B
and C) and insulin-mediated Akt phosphorylation (
228%,
P = 0.03) (Fig. 7B and D). We did not observe additive
effects of ATGL overexpression combined with HSL
in-hibition compared with ATGL overexpression alone on
insulin-stimulated Akt Ser473 phosphorylation
(Supple-mentary Fig. 3).
DISCUSSION
Ectopic fat deposition in non-adipose tissues such as
skeletal muscle is a common feature of insulin resistance
in obesity and type 2 diabetes (3
–5). The mechanisms
underlying IMTG accumulation and elevated lipotoxicity in
insulin-resistant states are not yet fully understood. We
show for the
first time a novel mechanism by which an
altered lipolytic balance in skeletal muscle might
contrib-ute to lipotoxicity and insulin resistance in humans. An
imbalance of ATGL relative to HSL promotes DAG
accu-mulation and induces insulin resistance at least in part
through a DAG/PKC pathway.
We
first showed that ATGL protein expression in vastus
lateralis samples obtained from a wide range of subjects
was negatively associated with whole-body insulin
sensi-tivity measured by euglycemic hyperinsulinemic clamp. It
is interesting to note that the glucose disposal rate during
this clamp is mostly accounted by skeletal muscle and thus
mostly re
flects skeletal muscle insulin sensitivity in lean
subjects. Higher doses of insulin are required to fully
suppress hepatic glucose production in obese and type 2
diabetic subjects as previously shown (34). Thus, the
re-lationship between muscle ATGL and insulin sensitivity is
stronger in lean subjects than in obese and type 2 diabetic
FIG. 4. Elevated ATGL expression disrupts insulin signaling and action. A: Glycogen synthesis was measured in the absence (open bars) or presence (black bars) of 100 nmol/L insulin in control myotubes (GFP) and myotubes overexpressing ATGL. *P < 0.05, **P < 0.01 vs. basal; #P < 0.05 vs. GFP insulin (n = 8 per group). B: Quantitative bar graph of basal Ser1101 IRS-1 phosphorylation (n = 4). ***P < 0.001 vs. GFP. C: Quantita-tive bar graph of Ser473 Akt phosphorylation (n = 11). *P < 0.05, ***P < 0.001 vs. basal; #P < 0.05 vs. Ad-GFP. D: Representative blots of Ser1101 pIRS-1, total IRS-1, Ser473 pAkt, total Akt, and the loading control GAPDH in the presence (+) or absence (2) of 100 nmol/L of insulin in control myotubes (GFP) and myotubes overexpressing ATGL.
subjects. When the data were examined by group, only
obese type 2 diabetic subjects displayed increased muscle
ATGL protein content. This
finding is slightly in contrast
with recent data showing an increased skeletal muscle
ATGL protein expression in nondiabetic obese versus
age-matched lean individuals (35). The discrepancy could be
explained by an effect of aging because the type 2 diabetic
subjects were older than the lean and obese subjects in our
study. Thus, age-related changes in skeletal muscle lipases
with respect to insulin sensitivity should be further
ex-plored. Elevated muscle ATGL protein in obese type 2
di-abetic subjects is in agreement with a higher muscle DAG
FIG. 5. ATGL-mediated insulin resistance involves PKC activation.A: Representative blots of Ser473 pAkt, total Akt, and GAPDH in the presence (+) or absence (2) of insulin and the nonselective PKC inhibitor calphostin C (1 mmol/L) in control myotubes (GFP) and myotubes overexpressing ATGL.B: Quantitative bar graph of insulin-stimulated Ser473 Akt phosphorylation (n = 3); insulin-stimulated Akt phosphorylation was calculated as theD between basal and insulin stimulation in each condition. *P < 0.05 vs. GFP; ##P < 0.01 vs. GFP calphostin C. C: Insulin-stimulated glycogen synthesis in myotubes expressing GFP and ATGL in the absence (control) or presence of calphostin C. Glycogen synthesis was expressed as theD change between glycogen synthesis under insulin stimulation and glycogen synthesis at baseline. *P < 0.05 vs. GFP (n = 4).
FIG. 6. Rescue of ATGL-mediated insulin resistance by HSL.A: Representative blots of Ser473 pAkt, total Akt, and GAPDH in the presence (+) or absence (2) of insulin in control myotubes (GFP) and myotubes overexpressing ATGL alone (Ad-ATGL) or in combination with HSL (Ad-ATGL+ Ad-HSL).B: Quantitative bar graph of insulin-stimulated Ser473 Akt phosphorylation (n = 4); insulin-stimulated Akt phosphorylation was cal-culated as theD between basal and insulin stimulation in each condition. *P < 0.05 vs. GFP. C: Insulin-stimulated glycogen synthesis was measured in control myotubes (GFP) and myotubes overexpressing ATGL alone (Ad-ATGL) or in combination with HSL (Ad-ATGL+Ad-HSL). *P < 0.05 vs. GFP (n = 6).
content previously reported in these subjects (36). We
next evaluated the causal relationship between elevated
ATGL expression and insulin resistance in primary culture
of skeletal muscle cells.
We overexpressed ATGL in human primary myotubes
using an adenovirus and assessed the consequences on
lipids and insulin action. Elevated expression of ATGL
reduced TAG content and simultaneously increased DAG
and ceramide content. Ceramides are potentially produced
de novo through the action of serine palmitoyl-transferase
I as previously shown (8). ATGL-mediated lipotoxicity
was paralleled by impairment in insulin-stimulated
glyco-gen synthesis and insulin signaling possibly due to
PKC-mediated Ser1101-IRS-1 phosphorylation and downstream
inhibition of Akt Ser473 phosphorylation. Of note, increased
ATGL expression induced baseline Akt Ser473
phosphor-ylation independently of insulin. This suggests that ATGL
may activate potential regulators of Ser473 Akt, such as
mTORC2, by yet unknown mechanisms (37). Future studies
will be required to dissect the precise mechanism by which
ATGL elicits baseline Akt activation. IRS-1
phosphoryla-tion at Ser1101 is primarily mediated by PKC
u and induces
general inhibition of IRS-1 function (13). Together, our
data show that ATGL mediates insulin resistance at least in
part through DAG and PKC activation. Itani et al. (38,39)
have previously shown that membrane-associated PKC
b
and
u protein content and activity increased the skeletal
muscle of obese versus lean and obese diabetic versus
nondiabetic matched control subjects, respectively. Even
if the exact nature of DAG stereoisomers produced by the
action of ATGL is currently unknown, the data support
an important role for DAG in mediating skeletal muscle
insulin resistance in this model. This observation is
con-sistent with other studies showing a critical role of DAG
in mediating insulin resistance in liver (40) and skeletal
muscle (10
–12) in response to high-fat diets and lipid
infu-sions. Our results are also consistent with a study by Bell
et al. (41) suggesting that AML12 liver cells lacking the lipid
coat protein adipophilin and tail-interacting protein of
47 kDa develop insulin resistance with increased recruitment
of ATGL to lipid droplets.
Of interest, ATGL-mediated insulin resistance was fully
rescued by HSL after restoring a proper cellular lipolytic
balance. Overexpression of HSL by itself did not cause
lipotoxicity and insulin resistance contrary to ATGL. HSL
displays a high DAG substrate speci
ficity and is considered
the major DAG hydrolase in several tissues (42). This
supports the concept that the functional balance between
ATGL and HSL may in
fluence intracellular DAG
concen-trations and insulin action in skeletal muscle. Altogether,
these data highlight a potential protective role of DAG
hydrolases against intramyocellular lipotoxicity by their
ability to rapidly hydrolyze DAG. The importance of DAG
turnover in insulin resistance is also illustrated by the
protective role of DGAT1 against intramyocellular
lipo-toxicity and fat-induced insulin resistance by increasing
lipid partitioning into IMTG (43,44). Along these lines,
re-duced DAG kinase-
d activity, which converts DAG into
phosphatidic acid, might also contribute to skeletal muscle
insulin resistance by increasing total DAG level (45).
Consistent with recent studies that reported a robust
reduction in skeletal muscle HSL protein expression in
insulin-resistant obese subjects (35,46), our study
con-firmed that both HSL Ser660 phosphorylation and HSL
protein content were reduced in skeletal muscle of obese
compared with lean subjects. The trend for increased HSL
protein content in skeletal muscle of patients with type 2
diabetes could be explained by the hyperglycemic milieu
because glucose was shown to induce HSL transcription in
adipocytes (47). To study the impact of reduced HSL
FIG. 7. Selective HSL inhibition disrupts insulin signaling.A: Total DAGs were measured in control myotubes and myotubes treated for 24 h with 1mmol/L of the selective HSL inhibitor BAY (n = 6). B: Representative blots of Tyr1162 pIR, total IRalpha, Ser473 pAkt, total Akt, and GAPDH in the presence (+) or absence (2) of insulin in control myotubes and myotubes treated with BAY. Quantitative bar graphs of (C) Tyr612-IRS-1 phosphorylation (n = 4) and (D) Ser473 Akt phosphorylation (n = 4) in control myotubes and myotubes treated with the BAY compound. **P < 0.01; ***P < 0.001 vs. basal; #P < 0.05 vs. control insulin.
expression/activity in skeletal muscle, we next evaluated
the consequences of inhibiting HSL activity on lipid pools
and insulin sensitivity in myotubes. HSL activity is
regu-lated by phosphorylation on serine residues in response
to muscle contraction and catecholamines in vivo (48).
Jocken et al. (46) found that reduced HSL phosphorylation
at Ser563, Ser565, and Ser659 was entirely due to lower
HSL protein content and associated with reduced resting
glycerol release from the forearm muscle of obese
sub-jects. We report that selective inhibition of HSL increases
speci
fically total DAG levels and consequently disrupts
insulin receptor signaling and action. This observation is
somehow consistent with data on HSL knockout mice that
are insulin-resistant at the level of the skeletal and cardiac
muscles when fed a chow diet (49,50) and accumulate
DAG in their muscles (16). Further studies will be required
to unravel the precise mechanism by which reduced HSL
expression/activity induces insulin resistance in skeletal
muscle.
In conclusion, the current study highlights a new
mech-anism by which an altered lipolytic balance between ATGL
and HSL induces DAG and insulin resistance in skeletal
muscle. The molecular mechanism involves at least in part
DAG-mediated PKC activation. Future studies should
ex-plore the cause-effect relationship between altered lipase
expression and insulin resistance in vivo in animal models
with targeted modulations of lipase expression in skeletal
muscle. Targeting skeletal muscle lipases might be of
po-tential therapeutic interest for improving insulin resistance
in obesity and type 2 diabetes.
ACKNOWLEDGMENTS
This work was supported by grants from the National
Research Agency (ANR-09-JCJC-0019-01) and the European
Foundation for the Study of Diabetes/Novo Nordisk (to
C.M.); the Commission of the European Communities
(Integrated Project HEPADIP; http://www.hepadip.org/),
Contract No. LSHM-CT-2005-018734 (to D.L.); and National
Institutes of Health grants US-1P30-DK-072476 (Pennington
Biomedical Research Center/Nutrition Obesity Research
Center) and R01-AG-030226 (to S.R.S.). The Hormone
As-say and Analytical Services Core, Vanderbilt Diabetes
Research and Training Center, supported by National
Institutes of Health Grant DK-20593, performed TAG and
DAG analyses.
No potential con
flicts of interest relevant to this article
were reported.
P.-M.B., K.L., A.M., G.L., and G.S. researched data and
reviewed and edited the article. A.C.R. reviewed and edited
the article. S.R.S. and D.L. contributed to discussion and
reviewed and edited the article. C.M. researched data and
wrote the article.
The authors thank Diana Albarado (Pennington
Biomed-ical Research Center, Baton Rouge, LA), Shantele Thomas
(Burnham Institute, Winter Park, FL), and Maarten Coonen
(Maastricht University, the Netherlands) for excellent
tech-nical assistance.
REFERENCES
1. DeFronzo RA. Pathogenesis of type 2 diabetes mellitus. Med Clin North Am 2004;88:787–835, ix
2. McGarry JD. Banting lecture 2001: dysregulation of fatty acid metabolism in the etiology of type 2 diabetes. Diabetes 2002;51:7–18
3. Krssak M, Falk Petersen K, Dresner A, et al. Intramyocellular lipid con-centrations are correlated with insulin sensitivity in humans: a1H NMR spectroscopy study. Diabetologia 1999;42:113–116
4. Pan DA, Lillioja S, Kriketos AD, et al. Skeletal muscle triglyceride levels are inversely related to insulin action. Diabetes 1997;46:983–988 5. Perseghin G, Scifo P, De Cobelli F, et al. Intramyocellular triglyceride
content is a determinant of in vivo insulin resistance in humans: a1H-13C nuclear magnetic resonance spectroscopy assessment in offspring of type 2 diabetic parents. Diabetes 1999;48:1600–1606
6. Unger RH. Minireview: weapons of lean body mass destruction: the role of ectopic lipids in the metabolic syndrome. Endocrinology 2003;144:5159– 5165
7. Adams JM 2nd, Pratipanawatr T, Berria R, et al. Ceramide content is in-creased in skeletal muscle from obese insulin-resistant humans. Diabetes 2004;53:25–31
8. Chavez JA, Knotts TA, Wang LP, et al. A role for ceramide, but not dia-cylglycerol, in the antagonism of insulin signal transduction by saturated fatty acids. J Biol Chem 2003;278:10297–10303
9. Holland WL, Brozinick JT, Wang LP, et al. Inhibition of ceramide synthesis ameliorates glucocorticoid-, saturated-fat-, and obesity-induced insulin resistance. Cell Metab 2007;5:167–179
10. Dresner A, Laurent D, Marcucci M, et al. Effects of free fatty acids on glucose transport and IRS-1-associated phosphatidylinositol 3-kinase ac-tivity. J Clin Invest 1999;103:253–259
11. Griffin ME, Marcucci MJ, Cline GW, et al. Free fatty acid-induced insulin resistance is associated with activation of protein kinase C theta and al-terations in the insulin signaling cascade. Diabetes 1999;48:1270–1274 12. Itani SI, Ruderman NB, Schmieder F, Boden G. Lipid-induced insulin
re-sistance in human muscle is associated with changes in diacylglycerol, protein kinase C, and IkappaB-alpha. Diabetes 2002;51:2005–2011 13. Li Y, Soos TJ, Li X, et al. Protein kinase C Theta inhibits insulin signaling by
phosphorylating IRS1 at Ser(1101). J Biol Chem 2004;279:45304–45307 14. Timmers S, Schrauwen P, de Vogel J. Muscular diacylglycerol metabolism
and insulin resistance. Physiol Behav 2008;94:242–251
15. Langfort J, Ploug T, Ihlemann J, Saldo M, Holm C, Galbo H. Expression of hormone-sensitive lipase and its regulation by adrenaline in skeletal muscle. Biochem J 1999;340:459–465
16. Haemmerle G, Zimmermann R, Hayn M, et al. Hormone-sensitive lipase deficiency in mice causes diglyceride accumulation in adipose tissue, muscle, and testis. J Biol Chem 2002;277:4806–4815
17. Haemmerle G, Lass A, Zimmermann R, et al. Defective lipolysis and altered energy metabolism in mice lacking adipose triglyceride lipase. Science 2006;312:734–737
18. Zimmermann R, Strauss JG, Haemmerle G, et al. Fat mobilization in adi-pose tissue is promoted by adiadi-pose triglyceride lipase. Science 2004;306: 1383–1386
19. Ukropcova B, McNeil M, Sereda O, et al. Dynamic changes in fat oxidation in human primary myocytes mirror metabolic characteristics of the donor. J Clin Invest 2005;115:1934–1941
20. Listenberger LL, Han X, Lewis SE, et al. Triglyceride accumulation pro-tects against fatty acid-induced lipotoxicity. Proc Natl Acad Sci U S A 2003; 100:3077–3082
21. Turpin SM, Lancaster GI, Darby I, Febbraio MA, Watt MJ. Apoptosis in skeletal muscle myotubes is induced by ceramides and is positively related to insulin resistance. Am J Physiol Endocrinol Metab 2006;291:E1341– E1350
22. Pickersgill L, Litherland GJ, Greenberg AS, Walker M, Yeaman SJ. Key role for ceramides in mediating insulin resistance in human muscle cells. J Biol Chem 2007;282:12583–12589
23. Hessvik NP, Bakke SS, Fredriksson K, et al. Metabolic switching of hu-man myotubes is improved by n-3 fatty acids. J Lipid Res 2010;51:2090– 2104
24. Langin D, Dicker A, Tavernier G, et al. Adipocyte lipases and defect of lipolysis in human obesity. Diabetes 2005;54:3190–3197
25. Bergstrom J. Percutaneous needle biopsy of skeletal muscle in physio-logical and clinical research. Scand J Clin Lab Invest 1975;35:609–616 26. DeFronzo RA, Tobin JD, Andres R. Glucose clamp technique: a method for
quantifying insulin secretion and resistance. Am J Physiol 1979;237:E214– E223
27. Mairal A, Langin D, Arner P, Hoffstedt J. Human adipose triglyceride lipase (PNPLA2) is not regulated by obesity and exhibits low in vitro triglyceride hydrolase activity. Diabetologia 2006;49:1629–1636
28. Folch J, Lees M, Sloane Stanley GH. A simple method for the isolation and purification of total lipides from animal tissues. J Biol Chem 1957;226:497– 509
29. Morrison WR, Smith LM. Preparation of fatty acid methyl esters and di-methylacetals from lipids with boronfluoride–methanol. J Lipid Res 1964; 5:600–608
30. Liebisch G, Drobnik W, Reil M, et al. Quantitative measurement of dif-ferent ceramide species from crude cellular extracts by electrospray P.-M. BADIN AND ASSOCIATES
ionization tandem mass spectrometry (ESI-MS/MS). J Lipid Res 1999;40: 1539–1546
31. Bligh EG, Dyer WJ. A rapid method of total lipid extraction and puri fica-tion. Can J Biochem Physiol 1959;37:911–917
32. Liebisch G, Lieser B, Rathenberg J, Drobnik W, Schmitz G. High-throughput quantification of phosphatidylcholine and sphingomyelin by electrospray ionization tandem mass spectrometry coupled with isotope correction algorithm. Biochim Biophys Acta 2004;1686:108–117
33. Schmitz-Peiffer C, Biden TJ. Protein kinase C function in muscle, liver, and beta-cells and its therapeutic implications for type 2 diabetes. Diabetes 2008;57:1774–1783
34. Bonadonna RC, Groop L, Kraemer N, Ferrannini E, Del Prato S, DeFronzo RA. Obesity and insulin resistance in humans: a dose-response study. Metabolism 1990;39:452–459
35. Jocken JW, Moro C, Goossens GH, et al. Skeletal muscle lipase content and activity in obesity and type 2 diabetes. J Clin Endocrinol Metab 2010; 95:5449–5453
36. Moro C, Galgani JE, Luu L, et al. Influence of gender, obesity, and muscle lipase activity on intramyocellular lipids in sedentary individuals. J Clin Endocrinol Metab 2009;94:3440–3447
37. Huang J, Manning BD. A complex interplay between Akt, TSC2 and the two mTOR complexes. Biochem Soc Trans 2009;37:217–222
38. Itani SI, Pories WJ, Macdonald KG, Dohm GL. Increased protein kinase C theta in skeletal muscle of diabetic patients. Metabolism 2001;50:553–557 39. Itani SI, Zhou Q, Pories WJ, MacDonald KG, Dohm GL. Involvement of protein kinase C in human skeletal muscle insulin resistance and obesity. Diabetes 2000;49:1353–1358
40. Neschen S, Morino K, Dong J, et al. n-3 Fatty acids preserve insulin sensi-tivity in vivo in a peroxisome proliferator-activated receptor-alpha-dependent manner. Diabetes 2007;56:1034–1041
41. Bell M, Wang H, Chen H, et al. Consequences of lipid droplet coat protein downregulation in liver cells: abnormal lipid droplet metabolism and in-duction of insulin resistance. Diabetes 2008;57:2037–2045
42. Holm C. Molecular mechanisms regulating hormone-sensitive lipase and lipolysis. Biochem Soc Trans 2003;31:1120–1124
43. Liu L, Zhang Y, Chen N, Shi X, Tsang B, Yu YH. Upregulation of myo-cellular DGAT1 augments triglyceride synthesis in skeletal muscle and protects against fat-induced insulin resistance. J Clin Invest 2007;117:1679– 1689
44. Schenk S, Horowitz JF. Acute exercise increases triglyceride synthesis in skeletal muscle and prevents fatty acid-induced insulin resistance. J Clin Invest 2007;117:1690–1698
45. Chibalin AV, Leng Y, Vieira E, et al. Downregulation of diacylglycerol ki-nase delta contributes to hyperglycemia-induced insulin resistance. Cell 2008;132:375–386
46. Jocken JW, Roepstorff C, Goossens GH, et al. Hormone-sensitive lipase serine phosphorylation and glycerol exchange across skeletal muscle in lean and obese subjects: effect of beta-adrenergic stimulation. Diabetes 2008;57:1834–1841
47. Smih F, Rouet P, Lucas S, et al. Transcriptional regulation of adipocyte hormone-sensitive lipase by glucose. Diabetes 2002;51:293–300
48. Jocken JW, Blaak EE. Catecholamine-induced lipolysis in adipose tissue and skeletal muscle in obesity. Physiol Behav 2008;94:219–230
49. Park SY, Kim HJ, Wang S, et al. Hormone-sensitive lipase knockout mice have increased hepatic insulin sensitivity and are protected from short-term diet-induced insulin resistance in skeletal muscle and heart. Am J Physiol Endocrinol Metab 2005;289:E30–E39
50. Mulder H, Sörhede-Winzell M, Contreras JA, et al. Hormone-sensitive li-pase null mice exhibit signs of impaired insulin sensitivity whereas insulin secretion is intact. J Biol Chem 2003;278:36380–36388