Publisher’s version / Version de l'éditeur:
Cellular Polymers, 22, 4, 2003
READ THESE TERMS AND CONDITIONS CAREFULLY BEFORE USING THIS WEBSITE.
https://nrc-publications.canada.ca/eng/copyright
Vous avez des questions? Nous pouvons vous aider. Pour communiquer directement avec un auteur, consultez la Questions? Contact the NRC Publications Archive team at
[email protected]. If you wish to email the authors directly, please see the first page of the publication for their contact information.
Archives des publications du CNRC
This publication could be one of several versions: author’s original, accepted manuscript or the publisher’s version. / La version de cette publication peut être l’une des suivantes : la version prépublication de l’auteur, la version acceptée du manuscrit ou la version de l’éditeur.
Access and use of this website and the material on it are subject to the Terms and Conditions set forth at
The second expansion cycle in ultramicrocellular foams
Nawaby, A. V.; Handa, Y. P.
https://publications-cnrc.canada.ca/fra/droits
L’accès à ce site Web et l’utilisation de son contenu sont assujettis aux conditions présentées dans le site LISEZ CES CONDITIONS ATTENTIVEMENT AVANT D’UTILISER CE SITE WEB.
NRC Publications Record / Notice d'Archives des publications de CNRC:
https://nrc-publications.canada.ca/eng/view/object/?id=811705c8-aaf8-4276-902c-842b5e64f6e9 https://publications-cnrc.canada.ca/fra/voir/objet/?id=811705c8-aaf8-4276-902c-842b5e64f6e9
The Second Expansion Cycle in Ultramicrocellular
Foams
†A. Victoria Nawaby
1and Y. Paul Handa
21Institute for Chemical Process and Environmental Technology, National Research Council
of Canada, Ottawa, Ontario, Canada K1A 0R6. 2Pactiv Corporation, Technology Center,
2651 Brickyard Road, Canandaigua, New York 14424-7990
Received: 19 March 2003 Accepted: 4 July 2003
SUMMARY
Ultramicrocellular PMMA foams made from the low temperature rubbery phase, obtained by saturating the polymer with CO2 at 0ºC and 34 atm, was subjected to a second expansion cycle by heating it rapidly to temperatures in the range 30 to 120ºC. The blowing agent for the secondary expansion was either the residual CO2 in the foam at about 19 wt% level or fresh CO2 re-equilibrated at 0ºC and 34 atm to a loading level of about 29 wt%. In the former case, the second expansion cycle led to lower foam densities whereas in the latter case it led to stretching and re-orientation of the cell walls with no significant gain in further foam density reduction or cell density increase.
INTRODUCTION
It is well known that compressed gases such as CO2 and N2 can dissolve to considerable extent in polymers to induce cell nucleation and growth on depressurization. The cellular morphology thus obtained is often in the 10-100µm range. Two processes are often used to generate such structures. In the continuous extrusion process, the molten polymer is directly injected with compressed gas, followed by dissolution and a final pressure and temperature decrease to generate the cellular structure. In the batch solid-state extrusion process, the polymer is saturated with the compressed gas under appropriate temperature and pressure conditions, followed by either rapid depressurization or first slowly decreasing the pressure and then quickly heating the polymer-gas solution to a temperature above the plasticized glass transition temperature,
Tg. Generally, the closed cell morphologies with cell diameter in the range 1-100 µm and a cell density about 108 cells/cm3 are termed microcellular foams.
† Correspndence to: A. V. Nawaby ([email protected]). †Issued as NRCC No. 46442
The cellular structures with a diameter in the range 0.01-1 µm and a cell density in excess of 1012 cells/cm3 are termed ultramicrocellular foams(1).
CO2 in particular is considered a desirable blowing agent due to it physical properties and benign nature. This gas near or above its critical point can dissolve in large enough quantities to cause an appreciable reduction in the Tg of the polymer-gas system(2). For poly(methyl methacrylate), PMMA, CO
2 is an excellent plasticizer causing a Tg depression which is not linearly dependent on the gas pressure as generally is the case but, instead, the system exhibits a retrograde behavior(1,3,4) whereby two transitions under a constant gas pressure are observed: a rubber-to-glass transition at a lower temperature (Tg,l), and a glass-to-rubber transition at a higher temperature (Tg,h). The existence of Tg,l
is due to the higher solubility of the gas in the polymer at lower temperatures, and heating the system at a constant pressure results in some gas loss from the polymer giving a rubber-to-glass transition accompanied by generation of microcellular morphology. On further heating at the same constant pressure results in the usual glass-to-rubber transition at Tg,h, and to the generation of ultramicrocellular morphology due to a much higher cell nucleation rate. Ultramicrocellular foams with an average cell size of 0.35 µm and cell density of 1013 cells/cm3 were produced by saturating PMMA with CO
2 in the liquid or sub-critical state(3,4). The reported low temperature/pressure process offers better control on cell growth and gives finer morphologiesas compared to those reported in the literature(5).
The evolution of ultramicrocellular foams has created an interest in exploring pathways to generate morphologies beyond the sub-micron level. While searching for newer processing windows using the patented low temperature foaming process(3,4), it was observed that the foams exhibited significant mass change over time due to loss of CO2. The availability of this considerable amount of CO2 in the foam, which we will refer here as the primary foam, offers the possibility to use this extra gas to re-foam the ultramicrocellular morphology and obtain smaller cell sizes or lower density. The re-foamed morphology is therefore referred to as secondary foam.
In conventional foaming processes, for example in the case of polystyrene (PS), secondary foaming is commonly practiced. The extruded PS foams can normally retain about 50-90% of the physical blowing agent. As foam ages and air permeates into the cells, the total cell pressure (from the permeated air and residual blowing agent) during a converting stage, such as thermoforming, can be much higher than atmospheric and causes a further expansion of the cells and hence secondary foaming. Another variant of the secondary foaming process has been recently reported(6,7) whereby density of a thermoplastic
foam is further reduced by resaturating with a compressed gas such as CO2 and subjecting the foam-gas solution to another expansion cycle.
In this paper we will explore whether the ultramicrocellular foams produced from the retrograde phase can be subjected to secondary foaming and its effect on the resulting morphological characteristics.
EXPERIMENTAL
PMMA sample used had a Tg of 95 °C, Mw = 108,500, and Mn = 56,700. It was compression molded into sheets of about 1.25 mm in thickness. Bone dry CO2 was used.
Primary PMMA foams were prepared by saturating the polymer with CO2 at 0°C and 34 atm for 24 hours and subsequently heating in a water bath at 50°C. Secondary foams were prepared utilizing the CO2 left in the sample after aging under ambient conditions from 2 to 14 days, and then heating to 120°C. The secondary foams were also prepared by placing the primary foam in a vacuum oven at 30°C for 3 days, then re-saturating with CO2 at the above conditions for 24 hours and subsequently foaming in the range 30 to 120°C. Primary PMMA foam samples after the vacuum step were also saturated with N2 gas at 24°C and 54 atm to investigate the effect of gas type on secondary foaming. Desorption kinetic studies on the primary foam samples were carried out using a high-precision gravimetric technique (CAHN D110 microbalance)(8). A sample with dimensions 1.5x0.5x0.5 cm and weighing 0.4 g was placed in the balance and the entire system evacuated. The amount of gas loss as a function of time at various temperatures in the range 14 to 55°C was monitored until no further mass changes was observed. Foam densities were determined by measuring the mass in air and in water.
RESULTS AND DISCUSSION
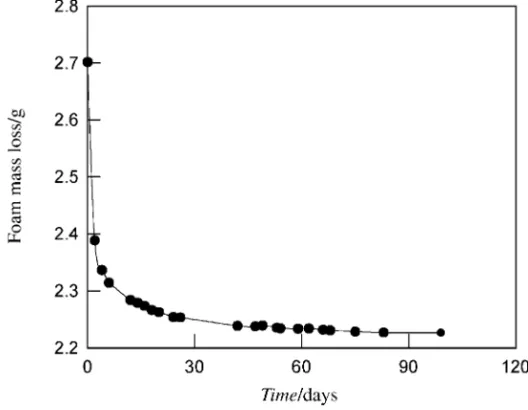
During the foaming process, initially the pressure of CO2 within the matrix is higher than the ambient. On aging at a given temperature, the concentration gradient results in diffusion of CO2 out of the matrix until an equilibrium with the surroundings is established. Even with the CO2 at 1 atm inside the cells, the foam matrix acts as a gas reservoir, considering (as shown below) the amount of CO2 present in the cells and that dissolved in the polymer matrix. A typical desorption curve under ambient conditions is shown in Figure 1. The total
amount of gas given off by the primary foam is about 19 wt%, and represents a retention of about 65% of the initial amount of the blowing agent dissolved in the polymer before foaming. As expected, the total amount of gas given off was the same irrespective of the desorption temperature except that the desorption rates became more rapid with increasing temperature. For example at 14°Cequilibrium was reached after 21 days as compared to 6 days at 55°C. The analysis of the kinetic data using the hybrid model(8) gives desorption diffusion coefficients in the range 2.5 to 3.9x10⁻⁷ cm2/s over the temperature range of 14 to 55°C.
In the microcellular foaming process, the morphology obtained is directly dependent on the amount of dissolved gas and the foaming temperature(1). This implies that the amount of gas left in the resulting foam is also a function of the cellular morphology. This indeed was found to be the case. As seen in Figure 2, a correlation exists between the total amount of gas desorbed from the primary PMMA foam and the primary foam characteristics, and is similar in nature as the correlation with the amount of dissolved gas(1). Cell density measurements were carried out using the method as described previously(9). Cell sizes were determined using the image analysis software Image-Pro from
Figure 1 Change in mass of primary PMMA foam sample under ambient conditions
Cybernetics and SEM photographs of the foam samples. As shown in Figure 2, the amount of residual gas in the sample gas corresponds to the foaming temperature – i.e. the higher the foaming temperature, the less gas is available for desorption, and the accompanying morphology is reflected in smaller cell size and higher cell density.
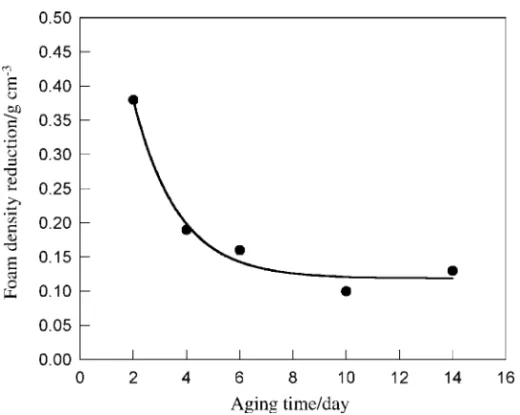
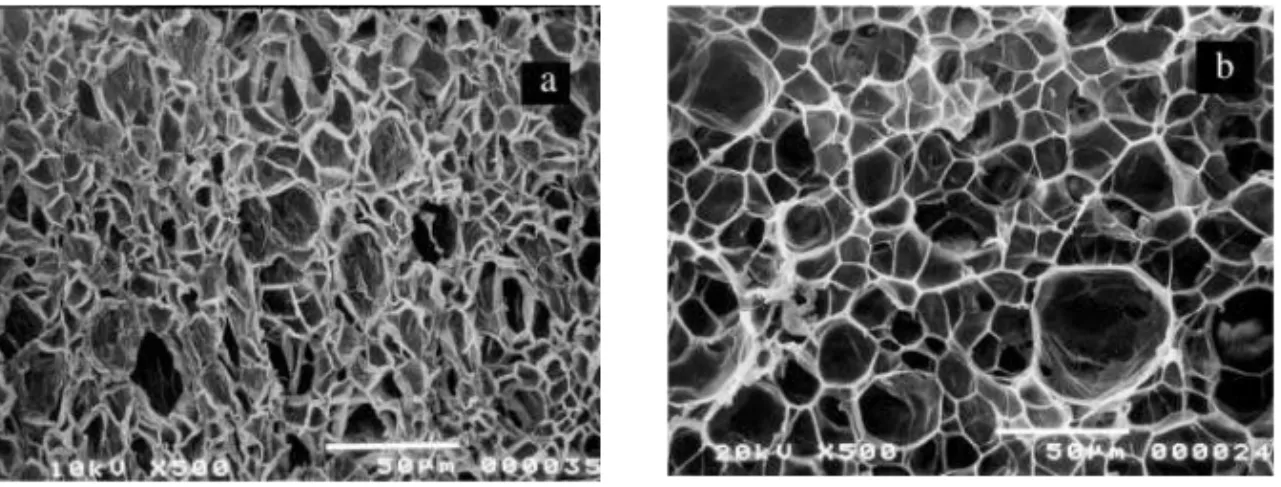
Results on the secondary foams obtained after aging the primary foam samples for various times followed by rapidly heating the sample to 120°C are shown in Figure 3 where reduction in density of the primary foam is plotted against the time it was aged before re-foaming. It is noted from Figure 1 that the majority of the gas loss occurs in the first three days with the rest exhibiting a gradual exponential decay. Accordingly, the largest density reduction achieved was 0.38 g/cm3 when a freshly made primary foam sample with a density of 0.50 g/cm3 was aged for 2 days and subsequently foamed to give secondary foam with a density of 0.12 g/cm3. With further aging, the density reduction achieved decreased and eventually leveled off for samples aged 6 days or more. This is also reflected in that no change in the cell size or cell density was evident in the SEM analysis on the secondary foam sample made after aging for more than 6 days. On the other hand, as shown in Figure 4, a Figure 2 Cell density and cell size of the primary foam samples plotted against the amount of residual gas in the sample
Figure 4 Microphotographs of PMMA foams: a) primary foam prepared at 100°C, b) secondary foam prepared by aging the primary foam for 2 days and then rapidly heating it to 120°C
Figure 3 Density reduction achieved after aging the primary foam for various periods and then rapidly heating it to 120°C
significant change in the cell size was observed when primary foam made at 100°C (Figure 4a) was aged for 2 days and then subsequently heated to 120°C (Figure 4b).
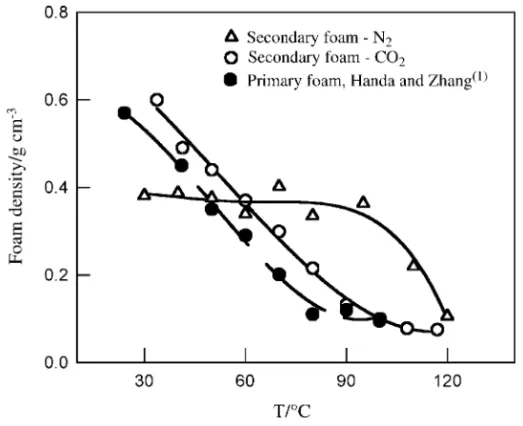
The primary foams were also re-foamed by subjecting the samples to a second saturation cycle using CO2 and N2 and a second expansion cycle in the temperature range 30 to 120°C. Since, as noted above, the primary foams prepared at 50°Ccontained a significant amount of CO2 within the morphology, the samples were first left in the vacuum oven at about 30°Cfor 3 days prior to re-saturation. The resultant secondary foam densities are shown in Figure 5. The secondary foams prepared with a second saturation step using CO2 exhibit the same trend and are within experimental error as the primary foam densities. The primary foam densities as previously reported by Handa and Zhang4 seem to level off in the foaming temperature range of 80 to 100°Cwhereas the secondary foam densities continue to decrease up to 120°C. The densities of the secondary foam prepared with N2 remain constant at about 0.45 g/cm3, which is close to the density of primary foam prepared at 50°C. This is due to the fact that the solubility of N2 is much lower than that of CO2 and thus does not contribute to further expansion of the matrix until at higher temperatures
Figure 5 Primary and secondary foam densities using CO2 and N2 as the blowing agents for the second expansion cycle
where density reduction is observed once the foaming temperature surpasses the Tg of the system.
Figure 6 shows microphotographs of the secondary foams prepared at 120°C with CO2 and N2 gases. The re-saturation with CO2 and re-foaming of the primary foam, Figure 8a, results in reorientation of the cell walls due to the high solubility of this gas in the polymer at lower temperatures and the severe plasticization of the matrix. Such relaxation is not available in the case of N2 due to the rather limited solubility of N2 and becomes possible only when the system approaches the nominal Tg of the polymer.
CONCLUSIONS
It was found that the freshly prepared ultramicrocellular foams contain enough residual blowing agent (about 19 wt%) that they can be subjected to a second expansion cycle to give morphologies with lower density, provided the secondary foaming is done at temperatures higher than those used during the primary foaming and that this operation is performed within 48 hours. Conversely, the primary foams can be first totally degassed, re-saturated with the blowing agent, and foamed again. Such a secondary foaming cycle leads to re-orientation of the primary cells without any significant density reduction.
ACKNOWLEDGEMENT
The authors thank Mr. Gerry Pleizier for assistance with the SEM work.
Figure 6 Microphotographs of secondary PMMA foams prepared at 120°C: a) with CO2, b) with N2
REFERENCES
1. Handa, Y. P. and Zhang, Z. J. Polym. Sci.: Part B: Polym. Phys. 2000, 38, 716. 2. Handa, Y. P., Lampron, S., and O’Neill, M. L. J. Polym. Sci.: Part B: Polym.
Phys. 1994, 32, 2549.
3. Handa, Y. P. and Zhang, Z. US Patent No. 5,955,511, September 21, 1999. 4. Handa, Y. P., Zhang, Z., and Wong, B. Cellular Polymers 2001, 20, 1. 5. Goel, S. and Beckman, E. J. Polym. Eng. Sci. 1994, 34, 1148.
6. Francis, P. S. and Chapman, T. M. US Patent No. Re34,123, November 10, 1992. 7. Kreiser, D. W., Dinkel, A. L., and Weibel, J. P. US Patent No. 6,197,840, March
6, 2001.
8. Wong, B., Zhang, Z., and Handa, Y. P. J. Polym. Sci.: Part B: Polym. Phys. 1998,
36, 2025.
9. Handa, Y. P., Wong, B., Zhang, Z., Kumar, V., Eddy, S., and Kishan, K. Polym.