HAL Id: tel-01782398
https://tel.archives-ouvertes.fr/tel-01782398v2
Submitted on 14 May 2018HAL is a multi-disciplinary open access archive for the deposit and dissemination of sci-entific research documents, whether they are pub-lished or not. The documents may come from teaching and research institutions in France or abroad, or from public or private research centers.
L’archive ouverte pluridisciplinaire HAL, est destinée au dépôt et à la diffusion de documents scientifiques de niveau recherche, publiés ou non, émanant des établissements d’enseignement et de recherche français ou étrangers, des laboratoires publics ou privés.
Comparative study of the proteome of S. coelicolor
M145 and S. lividans TK24, two phylogenetically closely
related strains with very different abilities to accumulate
TAG and produce antibiotics
Aaron Millan Oropeza
To cite this version:
Aaron Millan Oropeza. Comparative study of the proteome of S. coelicolor M145 and S. lividans TK24, two phylogenetically closely related strains with very different abilities to accumulate TAG and produce antibiotics. Genomics [q-bio.GN]. Université Paris Saclay (COmUE), 2017. English. �NNT : 2017SACLS160�. �tel-01782398v2�
i
NNT : 2017SACLS160
T
HESE DE DOCTORAT
DE
L‟U
NIVERSITE
P
ARIS
-S
ACLAY
PREPAREE A
L‟U
NIVERSITE
P
ARIS
-S
UD
E
COLED
OCTORALE N°
581
Agriculture, alimentation, biologie, environnement et santé (ABIES)
Spécialité de doctorat : Microbiologie
Par
M. Aarón Millán Oropeza
Comparative study of the proteome of S. coelicolor M145 and S. lividans
TK24, two phylogenetically closely related strains with very different
abilities to accumulate TAG and produce antibiotics
Thèse présentée et soutenue à Orsay, le 23 juin 2017 :Composition du Jury :
Mme Fabienne Malagnac Prof. Université Paris-Saclay Présidente M. Sébastien Rigali Prof. Université de Liège Rapporteur M. Bertrand Aigle Prof. Université de Lorraine Rapporteur Mme Warren Albertin MCF. ENSCP de Bordeaux Examinatrice M. Ivan Mijakovic Prof. Chalmers University of Technology Examinateur Mme Marie-Jöelle Virolle DR. Université Paris-Saclay Directrice de thèse Mme Céline Henry IE. Université Paris-Saclay- INRA Co-encadrante de thèse
ii Dedicated to our little angel Ian
iii
ACKNOWLEDGMENTS
Je tiens à remercier à la France pour m‟avoir accueilli pendant ma formation Doctorale dans un environnement international et unique, c‟était une toute première expérience à l‟étranger très enrichissante. Également je remercie à CONACyT et à l‟Ambassade de France au Mexique pour le support économique tout au long de mes études à l‟Université Paris-Sud.
J‟exprime ma gratitude aux membres du jury qui m‟ont fait l‟honneur de juger ce travail de thèse ainsi pour les échanges très enrichissantes lors de ma soutenance que je n‟oublierai jamais.
Je suis très reconnaissant à ma directrice de thèse Marie-Jöelle Virolle pour m‟avoir accueilli dans son laboratoire de recherche. Cette opportunité m‟a permis d‟apprendre beaucoup des choses du milieu professionnel et surtout du développement personnel. Je vous remercie pour vos recommandations, votre soutien pendant la thèse et votre passion pour les Streptomyces.
Un grand merci à ma co-encadrante de thèse Céline Henry pour sa gentillesse, complicité et soutien tout au long de mon séjour en France. Les expériences vécues dans les réunions, formations et congrès ont été des apprentissages significatifs pour mon projet professionnel et personnel. Merci Céline pour être une formidable encadrante et une excellente personne.
C‟était un grand plaisir de travailler en collaboration avec les tous les gens de PAPPSO et du bâtiment 526, une expérience exceptionnelle au niveau scientifique, technique et culturel. Merci beaucoup! Spécialement à Mélisande Blein-Nicolas pour m‟avoir encouragé et formé au monde de la bio-informatique où je suis toujours motivé.
Je remercie à mes collègues du laboratoire pour les moments vécus ensemble. À Michelle pour m‟avoir formé à la manipulation des Streptomyces et aussi pour ta gentillesse et support inconditionnel. À Marc pour les conseils pragmatiques dans les situations les plus invraisemblables au labo. À Clara pour avoir toujours un sourire et une histoire drôle à raconter, Euro2016 inclus. Également, je remercie aux autres
iv membres qui ont fait partie du groupe MES : Anthony, Chlöe, Maxime, Ahmed, Imen, Ines, Catherine, Esma, Jade, Benjamin, Marc-Antoine et Morgane. C‟était un plaisir de travailler à côte de vous. Également, je remercie aux voisins du couloir pour son agréable compagnie jour après jour et pour les afterworks « Picon-bière ». Merci à Jean-Luc, Sylvie, Armel, Emmanuelle, Soumaya, Laura, Luisa, Laetitia, Sylvain, Florence, Jerzy, Drago, Mathieu, Mauro, Babil, Brittany, Céline, Antoine et Christiane.
Je remercie également aux gens du LCP, du LETIAM pour son agréable compagnie et collaboration pendant une partie importante de ma thèse. Merci énormément Jean Bleton pour ton soutien et ton aide, tu es un chercheur et une personne formidable. Merci à Fathi, Naira, Philippe, Aurélien, Sanaz, Doura, Marine, Myriam, Ariane, Alex et Rolando. Grâce à cette collaboration j‟ai trouvé des personnes très importantes pour moi.
Thanks to my good friends Rolando and Nga for the great moments spent together including running to catch a night bus in the middle of Palaiseau or falling from the “easier” and scarier ski station ;-P
Muito obrigado ao meu amor, à minha paixão, Diana, pelos momentos juntos nesta etapa profissional e pessoal. Estou muito contente de ter tido a sorte de conhecer o urso mais jeitoso e lindíssimo do mundo... Nossa!
Gracias especiales al club de los “sabrosos” Leticia, Marta, Karen, Adriana, Nicolas, Edgar, David, Elodie, Proxy, Romain, Antoine y Robin por las noches en Paris que hicieron mi estancia más feliz.
Muchas gracias a Abuelo, Alan, Pakún, J-Lu, Pablo, Pam, Angie y Sr. Tavo por llenar de memes mi móvil y de alegría mis tardes.
Gracias a mi linda familia por apoyarme en todas mis decisiones así como en ésta etapa de mi vida. Los amo mamá, papá, Emi, Maga, Geraldine e Ian.
v
TABLE OF CONTENTS
INTRODUCTION ... 1
CHAPTER I. BIBLIOGRAPHIC STUDY ... 6
1.1. The genus Streptomyces ... 6
1.2. Development cycle of Streptomyces ... 8
1.3. Genome architecture of Streptomyces ... 11
1.4. Primary metabolism in Streptomyces... 13
1.4.1. Central carbon metabolism ... 13
1.4.1.1. Glycolysis and gluconeogenesis ... 14
1.4.1.2. Pentose phosphate pathway ... 17
1.4.1.3. Krebs cycle ... 19
1.4.1.4. Anaplerotic reactions ... 21
1.4.1.5. Glycerol metabolism ... 22
1.4.1.6. Fatty acids biosynthesis ... 22
1.4.2. Nitrogen metabolism ... 24
1.4.3. Phosphate metabolism ... 27
1.4.4. Respiratory chain ... 29
1.4.5. Storage compounds ... 31
1.4.5.1. Glycogen and trehalose ... 31
1.4.5.1. Triacylglycerols ... 32
1.4.5.2. Polyphosphates ... 34
1.5. Secondary metabolism in the model specie Streptomyces coelicolor and its regulation ... 35
1.5.1. Polyketides and fatty acids ... 39
1.5.2. Non-ribosomal Peptides (NRP) biosynthesis ... 41
vi
1.5.4. Regulation of secondary metabolites in S. coelicolor ... 43
1.6. Towards the understanding of links between primary and secondary metabolism ... 49
CHAPTER II. METHODS OF LABEL-FREE RELATIVE QUANTITATIVE PROTEOMICS ... 52
2.1. Shotgun proteomic preparation ... 53
2.2. Nano separation - Mass Spectrometry ... 54
2.2.1. LC-MS/MS ... 57
2.2.1.1. Q-Exactive mass spectrometer ... 58
2.2.1.2. Orbitrap Fusion™ Lumos™ Tribrid™ mass spectrometer ... 59
2.3. Protein identification via mass-matching... 60
2.4. Methods of label-free relative protein quantification ... 62
2.4.1. Spectral counting (SC) ... 62
2.4.2. Extracted Ion Current (XIC) ... 62
2.5. LC-MS/MS high-throughput proteomic studies in Streptomyces ... 64
CHAPTER III. ATTENUATED TOTAL REFLECTION FOURIER TRANSFORM INFRARED (ATR-FT-IR) FOR RAPID DETERMINATION OF MICROBIAL CELL LIPID CONTENT: CORRELATION WITH GAS CHROMATOGRAPHY-MASS SPECTROMETRY (GC-MS) ... 67
Abstract ... 68
3.1. Introduction ... 68
3.2. Materials and methods ... 71
3.3.1. Strains ... 71
3.3.2. Cell culture and experimental design ... 71
3.3.3. FT-IR measurements ... 71
3.3.4. IR Transmission Measurements of KBr pellets ... 73
3.3.5. ATR measurements ... 74
vii
3.3. Results and discussion ... 79
3.3.1. Correlation between the quantification of total esterified fatty acid content with FT-IR in transmission and ATR methods ... 79
3.3.2. Correlation between the quantification of total esterified fatty acid content with GC/MS and ATR methods ... 81
3.4. Conclusions ... 83
3.5. Funding ... 84
CHAPTER IV. QUANTITATIVE PROTEOMIC ANALYSIS CONFIRMED OXIDATIVE METABOLISM PREDOMINATES IN STREPTOMYCES COELICOLOR VERSUS GLYCOLYTIC METABOLISM IN STREPTOMYCES LIVIDANS ... 85
Abstract ... 86
4.1. Introduction ... 86
4.2. Experimental procedures ... 89
4.2.1. Bacterial growth ... 89
4.2.2. Protein extraction and digestion ... 89
4.2.3. LC-MS/MS analysis ... 91
4.2.4. Protein identification ... 91
4.2.5. Protein quantification based on extracted ion current ... 92
4.2.6. Detection of protein abundance changes ... 93
4.2.7. Data analysis ... 95
4.2.8. Detection of organic acids by GC/MS ... 95
4.2.9. Glucose, proline, ammonia, nitrate/nitrite and external free phosphate quantification ... 96
4.2.10. Esterified fatty acids quantification by GC/MS ... 96
4.3. Results and discussion ... 96
4.3.1. Global proteome analysis ... 96
viii
4.3.3. Nitrogen and amino acids metabolism ... 102
4.3.4. Phosphate and energetic metabolism ... 107
4.3.5. Stress responses ... 108
4.3.6. Secondary metabolite pathways ... 111
4.3.7. Some speculation concerning the genetic basis possibly underpinning the different metabolic features of S. coelicolor and S. lividans ... 112
4.4. Conclusion ... 113
4.5. Supplementary data ... 114
4.6. Supplementary figures ... 115
4.7. Acknowledgments ... 121
CHAPTER V. COMPARATIVE PROTEOMIC ANALYSIS OF STREPTOMYCES COELICOLOR AND STREPTOMYCES LIVIDANS REVEALED DRASTIC DIFFERENCES IN THEIR METABOLIC FEATURES. ... 122
5.1. Introduction ... 123
5.2. Materials and Methods ... 124
5.2.1. Bacterial growth ... 124
5.2.2. Total proteins extraction and digestion ... 125
5.2.3. LC-MS/MS analysis ... 126
5.2.4. Proteins identification ... 127
5.2.5. Peptide quantification based on extracted ion current ... 128
5.2.6. Detection of protein abundance changes ... 130
5.2.7. Data analysis ... 131
5.2.8. Esterified fatty acids quantification by GC/MS ... 132
5.2.9. Assay of ACT and RED production ... 132
5.2.10. Glucose, glycerol, proline and phosphate quantification assays... 133
5.3. Results ... 133
ix
5.3.2. Global proteomes analysis ... 135
5.3.3. Proteins of central carbon metabolism ... 140
5.3.4. Lipid metabolism ... 144
5.3.5. Amino acids and nitrogen assimilation ... 149
5.3.6. Phosphate and respiratory metabolism ... 152
5.3.7. Stress and defense ... 154
5.3.8. Secondary metabolites pathways ... 156
5.4. Discussion ... 158
5.5. Supplementary material ... 160
5.6. Acknowledgments ... 160
DISCUSSION AND PERSPECTIVES ... 161
ANNEXE A. RÉSUMÉ DES TRAVAUX DE RECHERCHE ... 165
x
LIST OF FIGURES
Figure A. Discovery of important antibiotics and other natural products over the years (Hopwood, 2007). ... 2 Figure B. Number of genomes of actinobacteria species relevant to natural products deposited at NCBI databases per year (Gomez-Escribano et al., 2016)... 3 Figure C. Schematic representation of regulatory cascades of PhoP likely involved in S.
coelicolor and S. lividans metabolism. ... 164
Figure 1. 1. Phylogenetic tree reconstructed with 100 actinobacterial species (Sen et al., 2014). ... 7 Figure 1. 2. Developmental cycle of Streptomyces on solid cultures of Streptomyces. Image from the website of Laboratory of Cell Biochemistry, Hiroshima University, http://home.hiroshima-u.ac.jp/~mbiotech/hosenkin_lab/Front-e.html , accessed on April 8th, 2017. ... 8 Figure 1. 3. Optical pictures of isolated colonies of wild-type S. coelicolor (A), a bldH mutant with no aerial hyphae (B), and a whi mutant with white colour of the aerial hyphae (C) The blue drops are the antibiotic actinorhodin produced by S. coelicolor. ... 9 Figure 1. 4. Confocal laser scanning fluorescence microscopy of the development cell death processes of S. coelicolor in liquid cultures (Manteca et al., 2008). ... 10 Figure 1. 5. The genomes of various Streptomyces were aligned with the 8.67 Mb genome of S. coelicolor using MAUVE software (Kirby, 2011). ... 12 Figure 1. 6. Schematic representation of catabolic and metabolic reactions. ... 13 Figure 1. 7. Glycolysis/gluconeogenesis pathway in S. coelicolor (BioCyc Database Collection). ... 15 Figure 1. 8. Pentose phosphate pathway in S. coelicolor (BioCyc Database Collection). ... 18 Figure 1. 9. Krebs cycle pathway in S. coelicolor (BioCyc Database Collection). ... 20
xi
Figure 1. 10. Anaplerotic pathways in S. coelicolor (BioCyc Database Collection). ... 21
Figure 1. 11. Representation of Fatty Acids Synthetase (Hardwood, 2010). ... 23
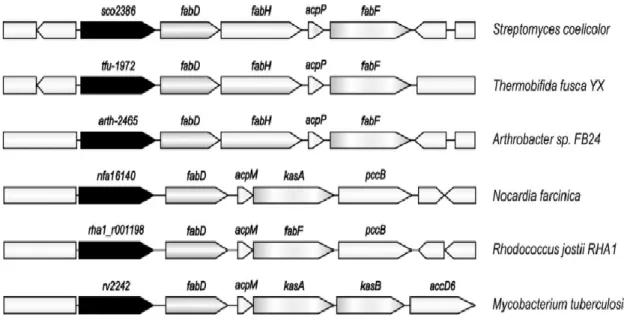
Figure 1. 12. Synteny of fab genes clusters in Actinomycetes (Arabolaza et al., 2010). ... 24
Figure 1. 13. Ammonium assimilation pathways. ... 27
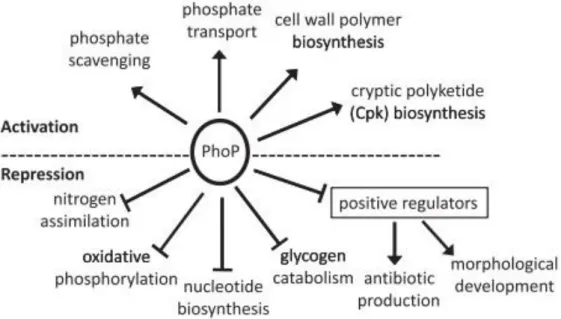
Figure 1. 14. Pathways and biological processes controlled by the two-component system PhoR/PhoP in condition of phosphate limitation (Allenby et al., 2012). ... 28
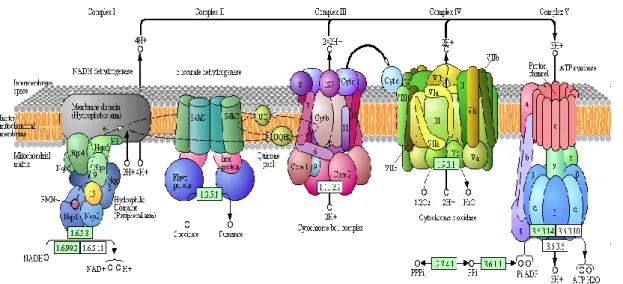
Figure 1. 15. Oxidative phosphorylation representation (Kegg Pathways Database, http://www.kegg.jp/ ) ... 30
Figure 1. 16. Possible electron donors and cytochrome oxidases encoded in the genome of S. coelicolor. Adapted from Sawers et al. (2016). ... 30
Figure 1. 17. Glucan pathways in Streptomyces (Chandra et al., 2011)... 32
Figure 1. 18. Triacylglycerols and phospholipids biosynthetic pathways. ... 33
Figure 1. 19. Polyphosphate structure. ... 34
Figure 1. 20. Relationship between primary metabolism and some precursors of Actinomycete-derived antibiotics. ... 35
Figure 1. 21. Some secondary metabolites synthesized by S. coelicolor. ... 36
Figure 1. 22. Representation of different types of PKS (Weissman, 2009). ... 39
Figure 1. 23. Representation of a NRPS composed of four modules encoded by two genes (Argüelles Arias et al., 2011). ... 41
Figure 1. 24. Proposed biosynthetic pathways of albaflavenone, geosmin (A), 2-methylisoborneol (B) and aminotrihydroxybacteriohopane (ATBH) in S. coelicolor (Challis, 2014). ... 42
xii Figure 1. 25. Proposed pathway of isorenieratine and β-carotene biosynthesis in S.
coelicolor (Challis, 2014). ... 43
Figure 2. 1. Historical record of publications per year on the field of proteomics. ... 52 Figure 2. 2. Representation of bottom-up proteomics workflow. Adapted from (Gregorich et al., 2014). ... 53 Figure 2. 3. MS-based pipeline representation. ... 55 Figure 2. 4. MS2 spectra of the tryptic peptide Y286ICDNQDTISSK297 from bovine serum albumin (BSA). Respective b and y″ ions are indicated (Kanski et al., 2005). ... 56 Figure 2. 5. Components of the Q-Exactive mass spectrometer... 58 Figure 2. 6. Components of the Orbitrap Fusion™ Lumos™ Tribrid™ mass spectrometer... 59 Figure 2. 7. Schematic representation of protein inference on X!TandemPipeline (Langella et al., 2017)... 61 Figure 2. 8. Pipeline for XIC-based quantification approaches. ... 63 Figure 3. 1. Recorded ATR spectra of the analyzed Streptomyces strains. ... 72 Figure 3. 2. Calibration curve of KBr pellets using different concentrations of tripalmitin. ... 74 Figure 3. 3. Gas chromatograms illustrating the fatty acids methyl esters (FAMES) profile of Streptomyces coelicolor M1144 grown in R2YE medium supplemented with glycerol (a). Overlap of 3 biological replicates (chromatograms in black, red and green). C13:0 and C20:0 were two internal standards. Representative gas chromatograms of the analyzed Streptomyces strains grown in R2YE medium supplemented with glucose 0.1 M or glycerol 0.2 M (b). ... 78 Figure 3. 4. Correlation between CO/amide I ratios determined by ATR with the esterified fatty acids content (a) and the CO/amide I ratios (b) determined by FT-IR in transmission using KBr pellets of the analyzed Streptomyces strains. ... 80
xiii Figure 3. 5. Correlation between the CO/amide I ratios obtained with ATR and total FAME quantification as determined by GC/MS in the analysed Streptomyces samples. ... 81 Figure 3. 6. FAME accumulation in the analysed Streptomyces strains, determined by GC/MS, showing mean and standard deviation (n = 3). ... 82 Figure 4. 1. General workflow of the samples preparation for shotgun proteomics (a) and the bioinformatic and statistical analysis of proteomic data (b). ... 90 Figure 4. 2. Venn diagram of the 2024 identified proteins using X!TandemPipeline 3.3.4 (a). Sub-cellular localization of the identified proteins in S. coelicolor and S.
lividans. Results obtained from LocateP (b). PCA based on the abundances of 595
proteins quantified by XIC in 19 LC-MS runs. (c). Venn diagram of the 360 proteins showing significant abundance change between S. coelicolor and S. lividans (ANOVA, adjusted p value < 0.05, d). ... 98 Figure 4. 3. Heatmap representation of the protein abundances estimated by the SC and XIC approaches in S. coelicolor (M145) and S. lividans (TK24) at 36, 48 and 72 h of culture. ... 99 Figure 4. 4. Central carbon metabolism pathways indicating the proteins with higher abundance in S. coelicolor and in S. lividans (a). Glycolytic steps are indicated in brackets. Histograms indicate the extracellular intermediate compounds of Krebs cycle detected by GC/MS and glucose consumption that showed significant difference (p value < 0.05 [*], p value < 0.01 [**]). Fold-change of proteins belonging to central carbon metabolism showing significantly higher abundance in S. lividans than in S.
coelicolor (b) or in S. coelicolor than in S. lividans (c). ... 101
Figure 4. 5. Heatmap representation of proteins corresponding to amino acids and nitrate metabolism in S. coelicolor (M145) and S. lividans (TK24) at 36, 48 and 72 h (a). The quantification methods are displayed in the vertical bar indicating those proteins quantified by SC (orange) and XIC (black). Total numbers of proteins for each sub-functional category are also indicated (bottom-left). All proteins showed a significant abundance change (ANOVA, adjusted p value < 0.05). Quantification of
xiv proline (b), ammonia (c), and nitrates/nitrites (d) concentration in growth medium (p value < 0.05 [*], p value < 0.01 [**]). ... 103 Figure 4. 6. Fold-change of proteins with significant abundance change (ANOVA, adjusted p value < 0.05) belonging to the functional category of energetic and phosphate metabolism. Protein identifiers are indicated as SCO numbers for S. coelicolor and their orthologous as SSPG numbers for S. lividans. ... 107 Figure 4. 7. Fold-change of proteins with significant abundance change (ANOVA, adjusted p value< 0.05) belonging to the functional categories of response to stress and defense (a) and secondary metabolites biosynthesis (b). ... 110 Figure S4. 1. Percentage of dissolved oxygen in S. coelicolor cultures. Continuous measurements were conducted using an oxygen sensor (OxyFerm FDA 325). ... 115 Figure S4. 2. Growth curves of S. coelicolor and S. lividans. Values represent the average of four independent experiments ± SD. ... 115 Figure S4. 3. Number of MS1 and MS2 scans from the LC-MS runs. ... 116 Figure S4. 4. Content of total lipid derived fatty acids methyl esters (FAMES) in S.
coelicolor and S. lividans (a). Relative abundance of the various FAMES species
determined by GC/MS (b). ... 117 Figure S4. 5. Theoretical sub-cellular distribution of the proteomes of S. coelicolor and
S. lividans using the LocateP database. ... 118
Figure S4. 6. Number of quantified peptides per LC-MS run of the dataset. Arrows indicate the dubious LC-MS runs for Streptomyces coelicolor M145. ... 118 Figure S4. 7. PCA based on protein abundances estimated from normalized peptide intensities of all LC-MS runs of the dataset. LC-MS runs for S. coelicolor M145 and S.
lividans TK24 are represented in black and red, respectively. ... 119
Figure S4. 8. PCA based on the abundances of 1429 protein estimated from spectral counts in the 19 selected LC-MS runs. ... 119
xv Figure S4. 9. Volcano plots of log10-fold change (S. lividans / S. coelicolor) of proteins abundance at 36 (a), 48 (b) and 72 h (c) of cultivation. ... 120 Figure S4. 10. Total free phosphate content in growth medium of S. coelicolor and S.
lividans. ... 121
Figure 5. 1. Proteomic workflow. Samples preparation for quantitative proteomics (A). Bioinformatic and statistical analysis of proteomic data (B). ... 126 Figure 5. 2. LC-MS run samples before (A) and after (B) peptide intensities normalization. ... 129 Figure 5. 3. Comparative features of S. coelicolor and S. lividans... 134 Figure 5. 4. Venn diagram of the 4372 identified proteins using X!TandemPipeline 3.4.2 (A). Sub-cellular localization of the identified proteins in S. coelicolor M145 and
S. lividans TK24 inferred using the LocateP database (B). ... 135
Figure 5. 5. Number of peptides per LC-MS/MS sample of the proteomic dataset (A). Principal Component Analysis (PCA) of proteins abundances from peptide intensities (B and D) and spectral counts (C and E) of the proteomic dataset. ... 137 Figure 5. 6.Venn diagram of the 1040 proteins showing significant abundance change calculated using the XIC and SC approaches (ANOVA, adjusted p value < 0.05)... 138 Figure 5. 7. Heatmap representation of the protein abundances estimated by XIC and SC. ... 139 Figure 5. 8. Heatmap representation of proteins from central carbon metabolism with significant change (adjusted p value < 0.05). ... 141 Figure 5. 9. Schematic representation of central carbon metabolism. Enzymatic reactions catalyzed by proteins with significant variation (ANOVA, adjusted p value > 0.05) are represented by arrows. The thickness of the arrows is proportional to proteins‟ abundance. Comparison of protein abundance in S. coelicolor and S. lividans on glucose (A) or glycerol (B) grown cultures at 72h. Comparison of protein abundance in glucose and glycerol grown cultures of S coelicolor (C) and S. lividans (D) at 72h. ... 143
xvi Figure 5. 10. Proteins of fatty acids biosynthesis that showed significant abundance variation between S. coelicolor and S. lividans (ANOVA, adjusted p value < 0.05). .. 145 Figure 5. 11. Proteins annotated as involved in lipid and fatty acids degradation showing significant abundance variation between S. coelicolor and S. lividans (ANOVA, adjusted p value < 0.05). Protein abundances are represented by black and grey histograms for S. coelicolor (M145) and S. lividans (TK24) cultivated in R2YE glucose (GLU) or glycerol (GLY) after 72 h of cultivation. ... 149 Figure 5. 12. Heatmap of proteins involved in: proline (PRO), hydroxyproline (HYP) and glutamate degradation (A), nitrogen assimilation (B), phosphate metabolism (C) and of respiratory chain (D) with significant abundance change (adjusted p value < 0.05). ... 151 Figure 5. 13. Boxplots indicating the protein abundances of GlnR (SCO4159) in S.
coelicolor and S. lividans. n = 4. ... 152
Figure 5. 14. Heatmap of proteins related to response to stress and defense with significant abundance change (adjusted p value < 0.05). ... 155 Figure 5. 15. Heatmap of proteins from secondary metabolites biosynthetic pathways with significant abundance change (adjusted p value < 0.05). ... 157 Figure A. 1. Spectres d‟absorption ATR-FT-IR normalisés des bactéries Streptomyces. Le contenu total des acides lipidiques estérifiés peut être mesuré en utilisant les bandes d‟absorption à 1740 cm-1
(bande C=O, a) où celle de 2953-2853 cm-1 (bande C-H, b). ... 167 Figure A. 2. Corrélation entre les rapports CO/amide I obtenus avec l'ATR-FT-IR et la quantification totale des acides gras estérifiés déterminée par GC/MS dans les échantillons des Streptomyces. ... 168 Figure A. 3. Diagramme de Venn des 2024 protéines identifiées en utilisant X! TandemPipeline 3.3.4 (a). Localisation sous-cellulaire des protéines identifiées chez S.
xvii (b). Diagramme de Venn des 360 protéines qui ont montré un changement d'abondance significatif entre S. coelicolor et S. lividans (ANOVA, «p-value» ajustée <0.05, c). .. 169 Figure A. 4. Représentation en carte de chaleur (Heat Map) des abondances relatives des 360 protéines dont la différence l‟abondance est jugée significativement statistiquement différente entre S. coelicolor (M145) et chez S. lividans (TK24) à 36, 48 et 72 h de culture. Chaque barre verte dans partie gauche du schéma représente une protéine. La méthode utilisée pour quantifier chaque protéine est affichée en orange (SC) ou noir (XIC) sur la barre verticale à gauche du schéma. Les catégories fonctionnelles et le nombre total de protéines pour chaque catégorie sont affichées, respectivement, au-dessus et en dessous des barres vertes. ... 171 Figure A. 5. Schéma des voies du métabolisme carboné central et histogrammes représentant les dosages, au cours du temps, de différents composés présents dans le milieu de culture (glucose et intermédiaires du cycle Krebs détectés par GC/MS, a). Les protéines plus abondantes chez S. lividans que chez S. coelicolor sont en rouge et celles plus abondantes chez S. coelicolor que chez S. lividans sont en bleu. Histogrammes représentant certaines enzymes du métabolisme carboné central présentant une abondance significativement plus élevée chez S. lividans que chez S. coelicolor (histogrammes noirs, b) ou plus élevée chez S. coelicolor que chez S. lividans (histogrammes gris, c). ... 172 Figure A. 6. «Heat Map» des protéines correspondant au métabolisme des acides aminés et au métabolisme du nitrate dont la différence d‟abondance est jugée significativement statistiquement différente entre S. coelicolor (M145) et chez S.
lividans (TK24) à 36, 48 et 72 h de culture (a). Chaque carré vert dans partie gauche du
schéma représente une protéine. La méthode utilisée pour quantifier chaque protéine est affichée en orange (SC) ou noir (XIC) sur la barre verticale à gauche. Les catégories fonctionnelles et le nombre total de protéines pour chaque catégorie sont affichées, respectivement, au-dessus et en dessous des barres vertes. Histogrammes représentant les concentrations en proline (b), ammoniac (c) et nitrates / nitrites (d) présentes dans le milieu de culture (p-value <0.05 [*], p-value <0.01 [**]) de S coelicolor (histogrammes gris) et S lividans (histogrammes noirs). ... 173
xviii Figure A. 7. Histogrammes représentant certaines protéines appartenant aux catégories fonctionnelles de réponse au stress (a) et biosynthèse de métabolites secondaires (b) présentant une abondance significativement plus élevée chez S. coelicolor que chez S.
lividans (histogrammes gris) ou chez S. lividans que chez S. coelicolor (histogrammes
noirs). Les identifiants de protéines sont indiqués comme «SCO» pour S. coelicolor et leurs orthologues chez S. lividans comme «SSPG». ... 174 Figure A. 8. Caractéristiques comparatives de S. coelicolor et de S. lividans. Courbes de croissance sur milieu R2YE solide supplémenté avec glucose ou avec glycérol (A). Les lignes continues ou pointillées représentent la croissance de R2YE avec du glucose et du glycérol, respectivement. Les cercles noirs et blancs représentent S. coelicolor et S.
lividans, respectivement. Images des mycéliums de S. coelicolor et S. lividans cultivées
pendant 24, 36, 48, 60 et 72 h (B). Concentration de glucose, de glycérol, de proline et de phosphate dans le milieu R2YE (C). Production des antibiotiques RED (intracellulaire) et ACT (intra et extracellulaire) après 36, 48 et 72h de culture (D). Accumulation d'esters méthyliques d'acides gras totaux dérivés de lipides (FAMES) chez S. coelicolor et chez S. lividans (E). Les données sont présentées comme moyen ± écar type (n = 4 répliques par condition). ... 176 Figure A. 9. Diagramme de Venn des 4372 protéines identifiées en utilisant le logiciel X!TandemPipeline 3.4.2. ... 177 Figure A. 10. Diagramme de Venn des 1040 protéines ayant une variation d'abondance significative calculée en utilisant les approches XIC et SC (ANOVA, p-value ajustée <0.05). ... 178 Figure A. 11. «Heat Map» des abondances relatives de 1040 protéines dont la différence l‟abondance est jugée significativement statistiquement différente entre S.
coelicolor (M145) et chez S. lividans (TK24) à 36, 48 et 72 h de culture. Chaque barre
verte dans la partie gauche du schéma représente une protéine. La méthode utilisée pour quantifier chaque protéine est affichée en orange (SC) ou noir (XIC) sur la barre verticale à gauche. Les catégories fonctionnelles et le nombre total de protéines pour chaque catégorie sont affichées, respectivement, au-dessus et en dessous des barres vertes. ... 179
xix Figure A. 12. Représentation du métabolisme central du carbone. Les réactions enzymatiques catalysées par des protéines avec une variation significative (ANOVA, p-value ajustée> 0.05) sont représentées par des flèches. L'épaisseur des flèches est proportionnelle à l'abondance des protéines. Comparaison de l'abondance des protéines chez S. coelicolor et S. lividans sur les cultures cultivées en glucose (A) ou en glycérol (B) à 72h. Comparaison de l'abondance des protéines entre les cultures en glucose et en glycérol chez S coelicolor (C) et chez S. lividans (D) à 72h. ... 181 Figure A. 13. Représentation de carte chaleur d‟abondance de protéines appartenant à la dégradation de proline (PRO), hydroxyproline (HYP) et glutamate (GLU) (A) et du métabolisme du phosphate (B) avec un changement d‟abondance significatif (p-value < 0.05). Les méthodes de quantification sont affichées dans la barre verticale indiquant les protéines quantifiées par SC (orange) et XIC (noir)... 182 Figure A. 14. Protéines de la biosynthèse des acides gras qui ont montré une variation d'abondance significative entre S. coelicolor et S. lividans (ANOVA, p-value ajustée <0.05). Les abondances de protéines sont représentées par des histogrammes en noir et gris pour S. coelicolor (M145) et S. lividans (TK24) cultivés dans milieu R2YE contenant glucose (GLU) ou glycérol (GLY) après 72h de culture. ... 183 Figure A. 15. Protéines annotées comme impliquées dans la dégradation des lipides et des acides gras qui montrent une variation d'abondance significative entre S. coelicolor et S. lividans (ANOVA, valeur p ajustée <0.05). Les abondances de protéines sont représentées par des histogrammes noirs et gris pour S. coelicolor (M145) et S. lividans (TK24) cultivés dans le glucose R2YE (GLU) ou le glycérol (GLY) après 72 h de culture. ... 184 Figure A. 16. «Heat Map» des abondances relatives de protéines appartenant aux voies de biosynthèse de métabolites secondaires dont la différence d‟abondance entre S.
coelicolor (M145) et chez S. lividans (TK24) à 36, 48 et 72 h de culture a été jugée
statistiquement significative. Chaque barre verte dans partie gauche du schéma représente une protéine. La méthode utilisée pour quantifier chaque protéine est affichée en orange (SC) ou noir (XIC) sur la barre verticale à gauche. Les catégories fonctionnelles et le nombre total de protéines pour chaque catégorie sont affichées, respectivement, au-dessus et en dessous des barres vertes. ... 186
xx
LIST OF TABLES
Table 1. 1. Genome characteristics of the model species S. coelicolor, S. lividans and S.
griseus. ... 11
Table 1. 2. Genes involved in nitrogen metabolism in S. coelicolor. Adapted from Reuther and Wohlleben (2007) and StrepDB database. ... 24 Table 1. 3. Gene clusters of secondary metabolites produced by S. coelicolor (van Keulen and Dyson, 2014). ... 37 Table 1. 4. Regulatory genes involved in secondary metabolites biosynthesis in S.
coelicolor. ... 44
Table 2. 1. Analytical metrics of principal Mass analyzers used in the field of proteomics. Adapted from (Zhang et al., 2013) ... 57 Table 2. 2. LC-MS/MS proteomic analysis of Streptomyces... 64
Table 3. 1. Relative abundance (%) of fatty acid methyl esters in the analyzed
Streptomyces strains. ... 75
Table 4. 1. Proteins involved in the biosynthesis of cofactors and prosthetic groups that showed significant variation (ANOVA, adjusted p value < 0.05)... 104
xxi
LIST OF ABBREVIATIONS
1,3PG: 1,3-bisphosphoglycerate 2PG: 2-phosphoglycerate 3PG: 3-phosphoglycerate 6PGL: 6-phosphoglucono-lactone αKG: α-ketoglutarateACC: Acetyl-CoA Carboxylase
ACN: Acetonitrile
ACP: Acyl Carrier Protein
ACT: Actinorhodin
AGPAT: 1-acylglycerol–3-phosphate acyltransferase
ANOVA: Analysis of variance
AT: Acyltransferase
ATBH: Aminotrihydroxybacteriohopane
ATR: Attenuated Total Reflection
BSA: Bovine serum albumin
CCR: Carbon Catabolite Repression
CIT: Citrate
CDA: Calcium-Dependent Antibiotics
CDI: Collision-induced dissociation
CRP: Cyclic AMP receptor protein
CSR: Cluster-situated regulators
CPK: Cryptic Polyketide Coelimycin P1
DAG: Diacylglycerol
DGAT: Diacylglycerol acyltransferase
DH: Dehydratase
DHA: Dihydroxyacetone
DHAP: Dihydroxyacetone phosphate
DMAPP: Dimethylallyl diphosphate
E4P: Erythrose-4-phosphate
xxii emPAI Exponentially modified Protein Abundance Index
ER: Enoyl reductase
ESI: Electrospray ionization
ETF: Electron transfer flavoproteins
E-value Expectation value
F1,6P: Fructose-1,6-biphosphate
F6P: Fructose-6-phosphate
FAME: Fatty Acid Methyl Esters
FAS: Fatty acid synthetase
FDR: False discovery rate
FID: Flame ionization detector
FTIR: Fourier Transform Infrared
FUM: Fumarate
G1P: Glucose-1-phosphate
G6P: Glucose-6-phosphate
GAP: Glyceraldehyde-3-phosphate
GC-MS: Gas Chromatography coupled to Mass Spectrometry
GDH: Glutamate dehydrogenase
GL6P: 6-phosphogluconate
GlcP: Glucose permeases
Glk: Glucose kinase
GLM: Generalized linear mixed model
Gly3P: Glycerol-3-phosphate
GPAT: Gly3P-acyltransferase
GS: Glutamine synthetase
GOGAT: Glutamate synthase
GXL: Glyoxylate
HCD: Higher-energy collisional dissociation HILIC: Hydrophilic interaction chromatography
HPr: Histidine-containing protein
HS: Hyperscore
iCIT: Isocitrate
xxiii
IPP: Isoprenyl diphosphate
IR: Infrared
KR: Ketoreductase
KS: Ketosynthase
LC: Liquid Chromatography
LIT: Linear Ion Trap
MAL: Malate
MALDI: Matrix-Assisted Laser Desorption / Ionization
MDR: Multi-drug resistant
MRSA: Methicillin resistant Staphylococcus aureus
MS: Mass Spectrometry
NGS: Next-Generation Sequencing
NRP: Non-ribosomal peptides
NRPS: Non-ribosomal peptides synthetase
OAA: Oxaloacetate
ORF: Open read frame
P: Phosphate
PA: Phosphatidic acid
PAF: Protein Abundance Factor
PAP: Phosphatidic acid phosphatase
PCA: Principal component analysis
PCD: Programmed cell death
PCP: Peptidyl carrier protein
PEP: Phosphoenolpyruvate
Pi: Inorganic phosphate
Pfk: Phosphofructokinase
PK: Polyketides
PKS: Polyketide synthases
PL: Phospholipids
PLS: Partial least square
PolyP: Inorganic polyphosphate
ppb: Parts per billion
xxiv
ppGpp: Guanosine pentaphosphate
PPK: Polyphosphate kinase
ppm: Parts per million
PPP: Pentose phosphate pathway
PTMs: Post-translational modifications
PTS: Phosphotransferase systems
Q: Quadrupole
R5P: Ribose-5-phosphate
RED: Undecylprodigiosin
RiPP: Ribosomally synthesized and Posttranslationally modified Peptides
RL5P: Ribulose-5-phosphate
ROS: Reactive oxygen specie
S7P: Sedoheptulose-7-phosphate
SAM: S-adenosylmethionine
SC: Spectral counting
SCX: Strong cation exchange
SDS-PAGE: Sodium Dodecyl Sulfate-Polyacrylamide Gel Electrophoresis
SEM: Standard error of the mean
SUC: Succinate
SucCoA: succinyl-CoA
TAG: Triacylglycerol
TCA: Tricarboxylic acid cycle
TE: Thioesterase
TEFA: Total esterified fatty acids
TFA: Trifluoroacetic acid
ToF: Time of flight
Tpi: Triosephosphate isomerase
UPS: Universal stress protein
VRSA: Vancomycin resistant Staphylococcus aureus
X5P: Xylulose-5-phosphate
1
INTRODUCTION
The beginning of the modern “antibiotic era” goes back in 1928, when Alexander Fleming (1881 – 1955), a Scottish biologist and botanist accidentally observed an inhibition halo of seed cultures of Staphylococcus aureus caused by a contaminant mold. This mold, eventually identified as Penicillium notatum, produced an active agent named penicillin and proved to be effective against Gram-positive bacteria such as
Staphylococcus or Streptococcus that are causing of septicemia and scarlet fever,
respectively. Later penicillin was isolated, produced at large-scale and used as a life-saver antibacterial compound during World War II (Hopwood, 2007; Demain and Sanchez, 2009).
However, penicillin was not effective against Gram-negative pathogenic bacteria like
Salmonella, Vibrio cholerae or other bacteria responsible for urinary tract infections.
This hurdle coupled with the start of World War II mobilized the research of new active compounds against disease-producing bacteria. One of the pioneers on this field was the Ukrainian-American microbiologist Selman Waksman (1888 – 1973), supervisor of the graduated studies of Albert Schatz that led to the discovery of an antibiotic produced by
Streptomyces griseus: streptomycin (ACS, 2005), in 1943. Streptomycin was capable of
killing gram-negative pathogens and tubercle bacillus without causing lethal or side-effects to humans. Eventually, streptomycin and penicillin were commercialized at large-scale by pharmaceutical companies during the 1940‟s (Woodruff, 1981). These successful breakthroughs also released the quest for new antibacterial compounds. Many antibiotics were identified between 1940 and 1960 in what is commonly known as the “golden age” of antibiotics discovery (Figure A).
Approximately two-thirds of all known antibiotics used in modern medicine are produced by Actinomycetes, from which the large majority are synthesized by the
Streptomyces genus (Barka et al., 2016). Streptomyces are saprophytic, soil-dwelling
microorganisms with complex life cycle that play key roles in soil ecology due to their ability to scavenge nutrients and to hydrolyze a wide range of polysaccharides and other natural macromolecules (Chater et al., 2010). The life cycle of Streptomyces starts with the germination of a spore that grows out to form a branched vegetative mycelium.
2 Then, under adverse conditions, such as nutrient depletion, an aerial mycelium arises from the vegetative mycelium. The tip ends of these aerial hyphae will then generate spores. Interestingly, antibiotics biosynthesis is usually concomitant to aerial mycelium development (Bibb, 2005; Chater et al., 2010).
Figure A. Discovery of important antibiotics and other natural products over the years (Hopwood, 2007).
Bold type indicates Actinomycete products; normal type indicates fungal products; italic type indicates products from non-actinomycete bacteria.
After this „golden age‟, scientific and economic situations changed. In the 1990‟s the efficiency of the classical screening methods decreased and antibiotic resistance of pathogenic bacteria increased as a result of the extensive and uncontrolled use/consumption of antibiotics resulting in their spreading in the environment (Berdy, 2012). In the same decade, resistant gram positive bacteria emerged as a major health threats with methicillin (MRSA) and vancomycin (VRSA) resistant Staphylococcus
aureus, penicillin resistant Streptococcus pneumonia, and multi-drug resistant (MDR) Clostridium difficile (Fair and Tor, 2014). In the United States, at least 2 million people
become infected with bacteria that are resistant to antibiotics and at least 23,000 people die each year as a direct result of these infections (Center for Disease Control and Prevention, 2017). This reappearing of „old‟ pathogens that became antibiotic-resistant could potentially bring us back to the pre-antibiotic era.
3 Fortunately, the research of novel bioactive natural products from actinobacteria re-emerged at the beginning of the 21st century with the sequencing of the genome of numerous Streptomyces species starting that of the historical model strain Streptomyces
coelicolor (Bentley et al., 2002). In silico analysis of S. coelicolor (Challis and
Hopwood, 2003), revealed that this strain contains pathways directing the biosynthesis of more than 20 secondary metabolites whereas only four were previously identified. This clearly evidenced that the metabolic potential of Streptomyces, and actinobacteria in general, was largely underestimated and that they possess a cryptic potential for the production of novel antimicrobials.
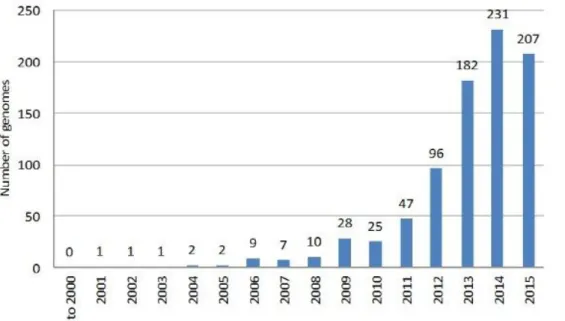
The development of faster and less-expensive next-generation sequencing (NGS) technologies and the establishment of bioinformatic tools led to the development of genetic engineering strategies to discover needed novel bioactive secondary metabolites (Figure B). In this regard, it was speculated that only 1-3% of the Streptomycete antibiotics have been discovered and finding the remaining 97–99% will require high-throughput screening by modern technologies (Clardy et al., 2006).
Figure B. Number of genomes of actinobacteria species relevant to natural products deposited at NCBI databases per year (Gomez-Escribano et al., 2016).
Most of the secondary metabolites are distributed in three major classes: polyketides (PK), non ribosomal peptides (NRP), or hybrids thereof (PK-NRP). For PK, the elongation chain starters comprise malonyl-CoA and methylmalonyl-CoA monomer
4 units; while, for NRP proteinogenic or non-proteinogenic amino acids are the monomer units used for chain elongation (Fischbach and Walsh, 2006). In both cases, the precursors of these building-blocks required for secondary metabolite biosynthesis are generated from primary metabolism. Tremendous efforts have been made to understand the molecular basis underlying the links between primary and secondary metabolism in
Streptomyces (Alam et al., 2010; Nieselt et al., 2010; Thomas et al., 2012). However,
the metabolic features accompanying the transition between primary to secondary metabolism remain to be unraveled.
To contribute to the elucidation of these links, I conducted a shotgun proteomic strategy using last cutting-edge mass spectrometry technology applied to the model, sequenced and phylogenetically closely-related Streptomyces species S. coelicolor and
S. lividans in order to determinate the nature of the metabolic features underlying the
biosynthesis of secondary metabolites. Both strains possess the same pathways for the biosynthesis of well-characterized secondary metabolites of the polyketide (actinorhodin, ACT) or peptidyl (calcium-dependent antibiotics CDA, undecylprodigiosin, RED) families but the expression of these pathways is high in S.
coelicolor and relatively low in S. lividans. The better understanding of these processes
would foster new strategies to enhance production of known as well as cryptic antibiotics.
The present thesis work is described in five chapters:
In the first chapter, the state of the art concerning primary and secondary metabolism in Streptomyces is introduced. The advances of central carbon, nitrogen, phosphate and energetic metabolism are described. Afterwards, a description of the secondary metabolites biosynthesis and its regulation is presented in the historically antibiotic-producing model specie S. coelicolor. What is currently known on the relationships between primary and secondary metabolism in S. coelicolor and S.
lividans is also described.
In the second chapter, the label-free proteomic strategies are presented including the recent and efficient shotgun approach. The methods of relative-quantitation used in
5 proteomics are also mentioned. And, a section is dedicated to high-throughput proteomic studies conducted in Streptomyces.
In the third chapter, a simple and fast method to quantify total fatty acids methyl esters in Streptomyces is described. This method is based on Fourier Transform Infrared (FTIR) Spectroscopy using Attenuated Total Reflection mode (ATR). The validity of this method was assessed using the classical approaches of Gas Chromatography coupled to Mass Spectrometry (GC-MS) and FTIR in transmission mode with the help of KBr pellets. The proposed method was tested with various
Streptomyces species and proved to be suitable for screening purposes.
The fourth chapter describes a comparative label-free proteomic study of the model species S. coelicolor and S. lividans cultivated in liquid R2YE medium supplemented with glucose under oxygen-limiting conditions. A total of 2024 proteins were identified and quantified, from them 360 showed significant differences in abundance between the species. The contrasted reaction to oxygen limitation of these two species is discussed. This study confirmed the previously observed oxidative and glycolytic metabolism of S. coelicolor and S. lividans, respectively.
In the fifth chapter, a comparative and quantitative proteomic analysis of S.
coelicolor and S. lividans was conducted in solid R2YE medium supplemented with
glucose or glycerol as main carbon sources. This study allowed the identification of 4372 proteins which represents the largest proteome dataset of any Streptomyces specie until now. The spatio-temporal analysis showed 1040 proteins with significant variation. The unprecedented depth of this study allowed to precisely define the metabolic features underlying the contrasted abilities of these two species to produce antibiotics and to accumulate storage lipids.
Finally, an integrated discussion and conclusion are presented. This part sums up the studies conducted during this thesis and details possible perspectives for potential evolution of the project.
6
CHAPTER I. BIBLIOGRAPHIC STUDY
1.1. The genus Streptomyces
The phylum Actinobacteria is one of the largest taxonomic units among the 18 major lineages within the domain of bacteria, including 5 subclasses, 6 orders, and 14 suborders (Ludwig et al., 2012). The analysis based on sequencing the 16S rRNA gene, DNA-DNA hybridization and chemical composition allowed to classify the order of Actinomycetales into 14 suborders, including: Actinomycineae, Actinopolysporineae, Catenulisporineae, Corynebacterineae, Frankineae, Glycomycineae, Jiangellineae, Kineosporineae, Micrococcineae, Micromonosporineae, Propionibacterineae, Pseudonocardineae, Streptomycineae, and Streptosporangineae (Sen et al., 2014) (Figure 1. 1). It is precisely in the Streptomycineae suborder where is classified the family Streptomycetaceae that includes the important genus of Streptomyces.
Streptomyces are saprophytic, soil-dwelling, Gram-positive bacteria with high G+C
content (69-78%) of their genome. They have a complex morphological and metabolic differentiation cycle. These bacteria are of great importance for mankind due to their ability to synthesize antibiotics and other bio-active molecules useful in medicine or agriculture (Challis and Hopwood, 2003; Barka et al., 2016).
Streptomyces live in the superficial layers of terrestrial or marine soils, where they
play key ecological roles in the recycling of C, N and P present in organic debris originated from plant, fungi or insects. They are capable of hydrolyze a wide range of polysaccharides (cellulose, chitin, xylan, and agar) and other natural macromolecules (proteins, lipids, nucleic acids, etc.) (Chater et al., 2010). Furthermore, Streptomyces can also colonize the rhizosphere to control the spread of fungal pathogens by creating a symbiosis with the plants (Hopwood, 2007).
7 Figure 1. 1. Phylogenetic tree reconstructed with 100 actinobacterial species (Sen et al., 2014).
8 1.2. Development cycle of Streptomyces
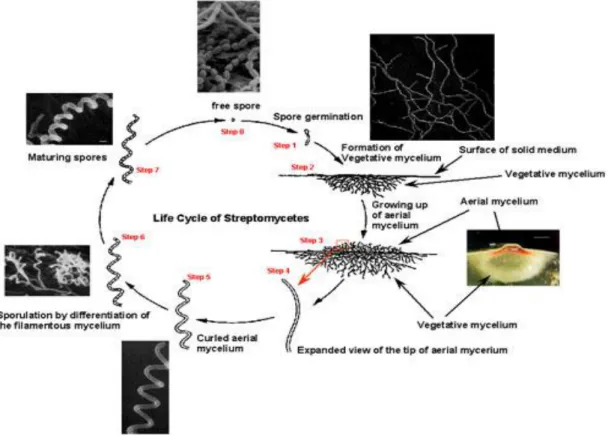
The life cycle of Streptomyces on solid surfaces is more complex than that of other bacteria (Figure 1. 2). The asexual cycle starts with the germination of a spore which is dormant until the suitable conditions occur for growth, including water availability, presence of nutriments (C, P, N) and the presence of divalent cations (Ca2+, Mg2+ and Fe2+) (Yagüe et al., 2013; Bobek et al., 2014). The spores allow Streptomyces to survive for long periods under adverse conditions (i.e. desiccation, poor nutrient availability, oxygen limitation or competition with other soil microorganisms). Germination is regulated by the cyclic AMP receptor protein (Crp) encoded by SCO3571. The deletion of this gene leads to a drastic delay of germination and cell growth as well as premature sporulation (Derouaux et al., 2004; Piette et al., 2005). Another gene involved at the germination stage is nepA (SCO4002), a structural cell wall protein that regulates spore dormancy under unfavorable environmental conditions (de Jong et al., 2009).
Figure 1. 2. Developmental cycle of Streptomyces on solid cultures of Streptomyces. Image from the website of Laboratory of Cell Biochemistry, Hiroshima University, http://home.hiroshima-u.ac.jp/~mbiotech/hosenkin_lab/Front-e.html , accessed on April 8th, 2017.
9 Once the germination is triggered, the spore swells and a germ tube emerges that will grow and branch to form the compartmentalized vegetative mycelium (Yague et al., 2016). After growth of the vegetative mycelium, and in condition of nutriments depletion Streptomyces must switch into survival and dispersal mode. To do so, aerial hyphae is induced from vegetative mycelium. The vegetative mycelium is autolytically degraded by a programmed cell death (PCD) mechanism in order to recycle the necessary nutriments to erect a second mass of aerial mycelium (Miguelez et al., 1999; Manteca et al., 2006). The tip ends of hyphae will differentiate into chains of unigenomic spores where gene exchange takes place (Claessen et al., 2006). The production of antibiotics is often concomitant of the late steps of this developmental process (Bibb, 2005). These new spores are dispersed by wind or animals to give rise of new colonizing mycelia.
Early aerial hyphal formation is regulated by an extracellular signaling cascade dependent on the bld genes, for bald, whose deletion/mutation results in species unable to form aerial hyphae (Claessen et al., 2006). Moreover, the processes of sporulation septation, spore maturation and the synthesis of grey spore pigment are regulated by the
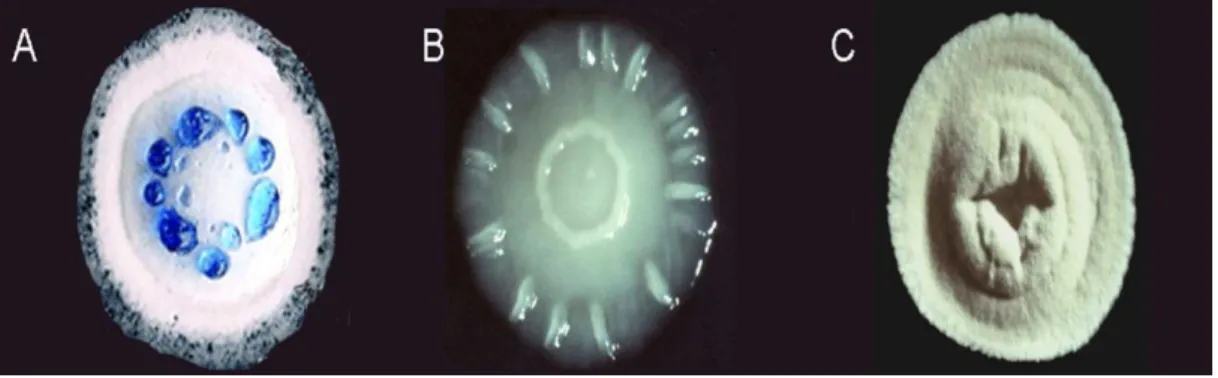
whi genes (Kelemen et al., 1998; Chater, 2001). Whi mutants are capable to form aerial
mycelium but they cannot achieve the sporulation process properly (Figure 1. 3).
Figure 1. 3. Optical pictures of isolated colonies of wild-type S. coelicolor (A), a bldH mutant with no aerial hyphae (B), and a whi mutant with white colour of the aerial hyphae (C) The blue drops are the antibiotic actinorhodin produced by S. coelicolor. Image obtained from Dr Paul Hoskinsson‟s laboratory website http://spider.science.strath.ac.uk/sipbs/staff/Paul_Hoskisson.html , accessed on April 8th, 2017.
10 In liquid cultures, cell development of Streptomyces shows similar features than on solid medium but usually does not undergoes sporulation (Manteca et al., 2008). This is important for industrial purposes since large-scale production of antibiotics is conducted in liquid cultures in large bioreactors. A first phase of active growth begins with the development of a compartmentalized mycelium that forms pellets and is followed by a transient growth arrest being correlated with the death of mycelial cells presents in the center of the pellets (Manteca et al., 2008). Then, the formation of a second multinucleated differentiated mycelium emerges after the death process of the first compartmentalized mycelium (Figure 1. 4). The secondary metabolites are generally produced at this late stage (Takano et al., 1992; Huang et al., 2001).
Figure 1. 4. Confocal laser scanning fluorescence microscopy of the development cell death processes of S. coelicolor in liquid cultures (Manteca et al., 2008).
Culture time points (hours), pellet diameters (micrometers), and the growth arrest phase are indicated. Arrows in panel indicate septa. MI = first mycelium. MII = second mycelium.
11 1.3. Genome architecture of Streptomyces
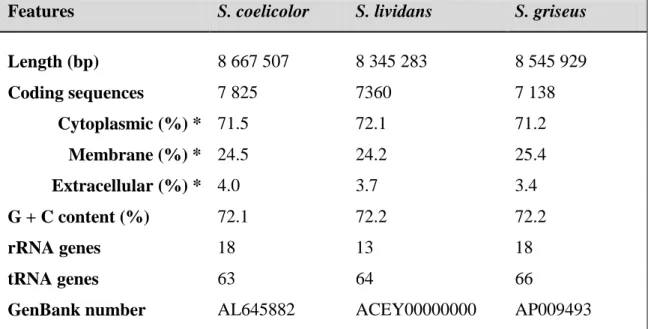
The specie S. coelicolor is the most largely studied Streptomyces specie mainly due to its capacity to produce the red-pigmented undecylprodigiosin (RED) and blue-pigmented actinorhodin (ACT) antibiotics which are easy to detect visually at different stages of development. In 2002, the sequencing of the genome of S. coelicolor was a major achievement that contributed to a better knowledge of the molecular basis underlying antibiotics production in Streptomyces (Bentley et al., 2002). Since then, the improvements on NGS technologies helped to sequence genomes more efficiently and at lower expenses than at the beginning of the 21st century (Gomez-Escribano et al., 2016). Nowadays, it is possible the access to more than 30 completed genomes of different Streptomyces species (Harrison and Studholme, 2014). The genome characteristics of three model species, S. coelicolor, S. lividans and S. griseus are indicated in Table 1. 1 (Bentley et al., 2002; Ohnishi et al., 2008; Ruckert et al., 2015). Table 1. 1. Genome characteristics of the model species S. coelicolor, S. lividans and S.
griseus.
Features S. coelicolor S. lividans S. griseus
Length (bp) 8 667 507 8 345 283 8 545 929 Coding sequences 7 825 7360 7 138 Cytoplasmic (%) * 71.5 72.1 71.2 Membrane (%) * 24.5 24.2 25.4 Extracellular (%) * 4.0 3.7 3.4 G + C content (%) 72.1 72.2 72.2 rRNA genes 18 13 18 tRNA genes 63 64 66
GenBank number AL645882 ACEY00000000 AP009493
* Sub-cellular distribution from LocateP database (Zhou et al., 2008)
Streptomyces genome size remains among the largest in bacteria. The 8-9 Mb
genomes are linear and constituted by a central “core” as well as by a left and right "arms" or terminal regions (1.5-Mb left and 2.3-Mb right) that are more variable than the core region (Figure 1. 5).
12 The central core constitutes approximately half of the total size of the chromosome. It contains essential genes necessary for growth such as those controlling DNA replication, transcription, translation, and central metabolism. The terminal regions contain repeated terminal sequences as well as a large number of transposable elements that renders highly variable and instable this part of the chromosome (Leblond and Decaris, 1994; Lin and Chen, 1997).
More than two-thirds of the proteins involved in biosynthesis of secondary metabolites tend to be located in the terminal regions. The latter are thought to be the siege of incorporation of foreign genes via horizontal transfer. This process is likely to be involved in the large diversity of secondary metabolites produced by the Streptomyces species.
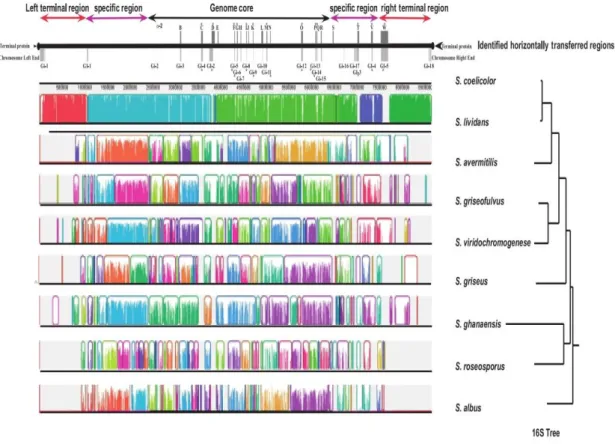
Figure 1. 5. The genomes of various Streptomyces were aligned with the 8.67 Mb genome of S. coelicolor using MAUVE software (Kirby, 2011).
The colored blocks represent syntenous regions. These were then compared with a 16S phylogenetic tree of the same species. At the top of the alignment are indicated the horizontally transferred regions within the S. coelicolor genome.
13 1.4. Primary metabolism in Streptomyces
Primary metabolism involves the catabolic and anabolic reactions of the cell. The catabolic reactions generate building-blocks, energy and reducing power for further utilization of the anabolism that includes proteins, nucleic acids, lipids and storage substances biosynthesis (Figure 1. 6). In bacteria, genes of primary metabolism are usually clustered in operons; however, it should be stressed that Streptomyces often possess multiple paralogs genes located at different chromosomal positions that encode proteins with similar function involved in primary metabolism (Siebring, 2010). This feature clearly makes more complex the analysis of the functioning of primary metabolism of Streptomyces.
Figure 1. 6. Schematic representation of catabolic and metabolic reactions.
1.4.1. Central carbon metabolism
In many bacteria, the transport of glucose, the preferred carbon substrate, into the cell is conducted by phosphotransferase systems (PTS) that uses phosphoenolpyruvate
14 as phosphoryl donor. PTS consists of sugar-specific PTS permeases, also referred to as enzymes II (EII), and two general PTS proteins, enzyme I (EI) and histidine-containing protein (HPr), that participate in the phosphorylation of all PTS-transported carbohydrates (Bruckner and Titgemeyer, 2002). The genome of S. coelicolor encodes the complete PTS machinery that includes the genes: ptsI (EI), ptsH (HPr), crr (EII), two fructose/mannitol EII permeases, and four glucose/sucrose EII permeases (Parche et
al., 2000). However, the major glucose transport system in S. coelicolor is not the PTS,
the latter is required for fructose (Nothaft et al., 2003) and N-acetylglucosamine (Parche
et al., 2000) transport; instead, it is the glucose permeases (GlcP). Two glcP gene copies
have been discovered in different parts of the chromosome of S. coelicolor: glcP1 (SCO5578) and glcP2 (SCO7153)(van Wezel et al., 2005).
Like other bacteria, Streptomyces assimilates selectively the different carbon sources in preferential order; once the preferred carbon source is depleted the assimilation of secondary substrates is activated. This type of regulation is known as Carbon Catabolite Repression (CCR) (Gorke and Stulke, 2008). In S. coelicolor, glucose kinase (Glk) represents the main glucose phosphorylating enzyme thought to act also as a regulatory protein in CCR (Kwakman and Postma, 1994). Deletion mutants of the glkA gene have shown to be incapable of growing on glucose as sole carbon source (Angell et al., 1994). Furthermore, glk is thought to interact with glcP to form a complex required for the efficient transport of glucose into the cell (van Wezel et al., 2007). This interaction might be facilitated by the gene product SCO2127 which has been associated with the glucose CCR phenomenon (Guzman et al., 2005; Forero et al., 2012). The protein SCO2127, located next to a Glk (SCO2126), was proposed to be a regulatory protein of CCR and mycelium differentiation by modulating the lipoprotein ABC-type permease (BldKB, SCO5113) in cultures grown in presence of glucose (Chavez et al., 2011). Still the functioning of CCR in Streptomyces remains enigmatic.
1.4.1.1. Glycolysis and gluconeogenesis
The Embden-Meyerhof-Parnas pathway, also known as glycolysis, is the sequence of reactions catabolizing glucose which is highly conserved in bacteria including
15 Figure 1. 7. Glycolysis/gluconeogenesis pathway in S. coelicolor (BioCyc Database Collection).
16 Glycolysis occurs in two main stages, the first stage catalyzes the splitting of one molecule of glucose into one molecule of glyceraldehyde-3-phosphate (GAP) and one molecule of dihydroxyacetone phosphate (DHAP, also called glycerone phosphate) that are inter-convertible; while the second stage catalyzes the oxidation of GAP into pyruvate and DHAP into glycerol-3-phosphate (Gly3P). Overall, one mole of glucose generates two moles of pyruvate, two moles of ATP and two moles of NADH (Berg et
al., 2002). At first, glucose is phosphorylated by the glucose kinase (Glk). The product,
glucose-6-phosphate (G6P), is isomerized into fructose-6-phosphate (F6P) in a reaction catalyzed by G6P isomerase. F6P is the substrate of phosphofructokinase (Pfk) that adds a second phosphate to the sugar in order to form fructose-1,6-biphosphate (F1,6P). Then, F1,6P is divided into GAP and glycerone phosphate or dihydroxyacetone (DHA) by the enzyme F1,6P aldolase. Eventually, the reversible conversion between DHA and GAP is catalyzed by the enzyme triosephosphate isomerase (Tpi). Until this step, 2 moles of ATP are consumed; in the following steps oxidation of GAP will produce 2 moles of ATP and 2 moles of NADH. The enzyme GAP dehydrogenase catalyzes the conversion of GAP into 1,3-bisphosphoglycerate (1,3PG). The next reaction, catalyzed by phosphoglycerate kinase, involves the addition of phosphate to 1,3PG at phosphate level phosphorylation generating 3-phosphoglycerate (3PG) and ATP. The 3PG is then isomerized into 2-phosphoglycerate (2PG) by the phosphoglycerate mutase. The enzyme enolase catalyzes the conversion of 2PG into phosphoenolpyruvate (PEP). The last step of glycolysis, the enzyme pyruvate kinase catalyzes the conversion of PEP into pyruvate and generates ATP.
As observed in Figure 1. 7, the genome of S. coelicolor contains multiple paralogs genes encoding similar related enzymes for a given step of the glycolysis. The function of this redundancy is poorly understood. For instance, the enzyme Pfk presents three isoforms, SCO1214, SCO2119 and SCO5426, the latter being the more expressed during growth (Siebring, 2010). Interestingly, deletion mutants of SCO5426, that are likely to have a reduced glycolytic flux, showed an enhanced capacity to produce the pigmented antibiotics ACT and RED (Borodina et al., 2008).
In absence of glycolytic carbon sources, Streptomyces possess the machinery to grow on gluconeogenic carbon sources such as glutamine, glutamate (Borodina et al., 2005; van Wezel et al., 2006) or form acetyl-CoA originated from storage lipid degradation
17 (Olukoshi and Packter, 1994). Gluconeogenesis operates in the opposite direction of glycolysis. In gluconeogenesis, PEP can be generated from pyruvate by the pyruvate phosphate dikinase (PPDK, SCO0208) and the conversion of F1,6P into F6P is catalyzed by the enzyme fructose-1,6-biphosphatase (SCO5047).
1.4.1.2. Pentose phosphate pathway
The pentose phosphate pathway (PPP) is a pathway branched on glycolysis (Figure 1. 8). There are two phases in the PPP, the first one is oxidative and generates NADH/NADPH and pentoses for nucleotide biosynthesis, while the second is non-oxidative and generates glycolytic intermediates such as F6P and GAP.
In the oxidative phase, the first step is catalyzed by G6P dehydrogenase that converts G6P into 6-phosphoglucono-lactone (6PGL) generating NADPH. Then, 6PGL is converted into 6-phosphogluconate (GL6P) by 6-phosphogluconolactonase. Afterwards, GL6P is converted into ribulose-5-phosphate (RL5P) by GL6P dehydrogenase. The RL5P is an important precursor for ATP, coenzyme A, NAD, FAD, DNA and RNA generation. Eventually RL5P is isomerized into ribose-5-phosphate (R5P) or into xylulose-5-phosphate (X5P) by the enzymes R5P isomerase and ribulose phosphate-3-epimerase, respectively.
The non-oxidative phase of PPP involves the reactions catalyzed by transketolase and transaldolase. The transketolase catalyzes the reaction that transfers a C2 fragment from X5P to R5P in order to form sedoheptulose-7-phosphate (S7P) and GAP. While the transketolase transfers a C3 fragment from S7P to GAP to form erythrose-4-phosphate (E4P) and F6P. Some transketolases can also transfer a C2 moiety from X5P to E4P in order to form F6P and GAP (Berg et al., 2002). Transaldolases and transketolases interconnect PPP and glycolysis.
18 Figure 1. 8. Pentose phosphate pathway in S. coelicolor (BioCyc Database Collection).