HAL Id: hal-01299832
https://hal.archives-ouvertes.fr/hal-01299832
Preprint submitted on 8 Apr 2016HAL is a multi-disciplinary open access archive for the deposit and dissemination of sci-entific research documents, whether they are pub-lished or not. The documents may come from teaching and research institutions in France or
L’archive ouverte pluridisciplinaire HAL, est destinée au dépôt et à la diffusion de documents scientifiques de niveau recherche, publiés ou non, émanant des établissements d’enseignement et de recherche français ou étrangers, des laboratoires
SIMULATING WORLD TRADE IN THE DECADES
AHEAD: DRIVING FORCES AND POLICY
IMPLICATIONS
Lionel Fontagné, Jean Fouré, Alexander Keck
To cite this version:
Lionel Fontagné, Jean Fouré, Alexander Keck. SIMULATING WORLD TRADE IN THE DECADES AHEAD: DRIVING FORCES AND POLICY IMPLICATIONS. 2014. �hal-01299832�
WTO Working Paper ERSD-2014-05 Date: April 04, 2014
World Trade Organization
Economic Research and Statistics Division
SIMULATING WORLD TRADE IN THE DECADES AHEAD: DRIVING FORCES AND POLICY IMPLICATIONS
Lionel Fontagné, Jean Fouré and Alexander Keck
Manuscript date: April 04, 2014
Disclaimer: This is a working paper, and hence it represents research in progress. This paper represents the personal opinions of individual staff members and/or external contributors, and is not meant to represent the position or opinions of the WTO or its Members, nor the official position of any staff members. Any errors are the fault of the authors. Copies of working papers can be requested from the divisional secretariat by writing to: Economic Research and Statistics Division, World Trade Organization, rue de Lausanne 154, CH-1211 Geneva 21, Switzerland. Please request papers by number and title.
SIMULATING WORLD TRADE IN THE DECADES AHEAD: DRIVING FORCES AND POLICY IMPLICATIONS
Lionel Fontagné*, Jean Fouré† and Alexander Keck‡ April 2014
Abstract
The geography and composition of international trade are changing fast. We link a macroeconomic growth model and sectoral CGE framework in order to project the world economy forward to the year 2035 and assess to what extent current trends in trade are expected to continue. Constructing fully traceable scenarios based on assumptions grounded in the literature, we are also able to isolate the relative impact of key economic drivers. We find that the stakes for developing countries are particularly high: The emergence of new players in the world economy, intensification of South-South trade and diversification into skill-intensive activities may continue only in a dynamic economic and open trade environment. Current trends towards increased regionalization may be reversed, with multilateral trade relationships gaining in importance. Hypothetical mega-regionals could slow down, but not frustrate the prevalence of multilateralism. Continuing technological progress is likely to have the biggest impact on future economic developments around the globe. Population dynamics are influential as well: For some countries, up-skilling will be crucial, for others labour shortages may be addressed through migration. Several developing countries would benefit from increased capital mobility; others will only diversify into dynamic sectors, when trade costs are further reduced.
Keywords: International trade, macroeconomic projections, CGE simulations
JEL classifications: E27, F02, F17, F47
*
PSE (University Paris 1) and CEPII, [email protected]
†
CEPII, [email protected]
‡
WTO Economic Research and Statistics Division, [email protected]
Disclaimer and acknowledgements: The opinions expressed in this paper are not meant to represent the positions or opinions of the WTO and its Members and are without prejudice to Members' rights and obligations under the WTO. The authors would like to thank Olivier Cadot, Lucian Cernat, Patrick Low, Marcelo Olarreaga, Frédéric Robert-Nicoud and Robert Teh as well as conference participants at the University of Geneva, University of Mauritius, European Commission and WTO for helpful comments on this paper. All errors and omissions remain our own.
I. INTRODUCTION
Over the past years - perhaps owing to perceptions of increased uncertainty in the wake of the Great Recession - a number of long-term economic projections have been made, ranging from a time horizon of several decades to almost one hundred years ahead, with some of these studies also touching upon the prospects for international trade.1 These include qualitative, multidisciplinary analyses, such as European Commission (2012), multi-sector partial equilibrium models, such as IMF (2011) as well as computable general equilibrium (CGE) models, such as World Bank (2007). While the studies make assumptions about productivity advances, which then shape sectoral developments, they do not employ an explicit model of economic growth. Other studies, such as OECD (2012), Asian Development Bank (2011), Fouré et al. (2010) and Duval and de la Maisonneuve (2010), provide economic growth projections over the long-term. Only a few papers have combined the two approaches, linking models of economic growth to sectoral simulations. Petri and Zhai (2012) use the growth projections by the Asian Development Bank (2011) as a baseline for their CGE model. They focus on the economic prospects of the Association of Southeast Asian Nations (ASEAN), China and India by the year 2030. Anderson and Strutt (2012) make predictions for Asia at the same time horizon (2030), supplementing the growth predictions from Asian Development Bank (2011) with the ones from Fouré et al. (2010) for countries not contained in the former study. Finally, Fontagné et al. (2013) combine CEPII's macroeconomic model (MaGE) with its multi-sectoral dynamic CGE model of the world economy (MIRAGE). This study considers economic prospects up to the year 2100, making some simplifying assumptions about key exogenous variables, and principally aims at providing a baseline for the evaluation of climate change policies, although some sectoral and trade issues are discussed as well.
Our paper seeks to extend this relatively small, but rapidly expanding body of literature in a number of ways: First, using the methodology described in detail in Fontagné and Fouré (2013), we combine an explicit economic growth model with a multi-sectoral model in order to construct scenarios for the world as a whole (around 150 countries) up to a maximum time horizon (year 2035), for which reasonable forecasts of a number of key variables (e.g. energy prices, demographics) can be obtained from specialized institutions (e.g. IEA (2011), UNPD (2011)). To the best of our knowledge, our study is the only exercise at this extensive geographic and time scale, while remaining grounded in realistic assumptions about key economic variables. Second, unlike other papers, we provide an entirely consistent modelling framework, which makes the macroeconomic scenarios fully traceable throughout the sectoral simulations. This is crucial in order to be able to identify the relative importance of key economic drivers of future developments. Third, we undertake to examine to what extent the main trends that have strongly altered the volume, composition, geography and nature of international trade in recent times (WTO, 2013) are likely to continue or reverse over the next decades. This is important in order to be able to identify challenges that may arise from possible changes to existing trade developments. Finally, given the wide scope of our simulations, we are able to determine the policy implications of different scenarios for different groups of countries, which may allow policy-makers to focus on the issues of principal concern to their constituencies and evaluate their options.
The paper is organized as follows: Section II briefly describes the macroeconomic and trade scenarios we implement and highlights key methodological advantages as well as limitations of our approach. Section III examines the relative impact of the main fundamental economic driving forces. In Section IV, we analyse whether, under these scenarios, major trends in trade are likely to continue. In both of these sections we discuss what the implications would be for different groups of countries. Section V concludes providing an overview of major policy challenges ahead and ideas for further work.
1
World Bank (2007), Fouré et al. (2010), ADB (2011), IMF (2011), OECD (2012), European Commission (2012).
II. METHODOLOGY AND SCENARIOS
First, this section discusses the advantages and limitations of our dynamic CGE approach. Second, the scenarios in terms of shocks to various economic and trade variables are introduced.
A. METHODOLOGY AND LIMITATIONS
This paper combines CGE modelling (MIRAGE) with the macroeconometric model MaGE in order to address the sectoral implications of the envisaged growth trajectory of national economies.2 The driving forces of the changes modelled with MIRAGE are the change in countries' GDP per capita, the (sectorally differentiated) gains in TFP by these countries, their changing comparative advantage and evolving country sizes. On the demand size, country size and GDP per capita determine the size of markets and demand composition. With the reshaping of the world economy the patterns of international demand will be affected profoundly. Meanwhile, the capabilities of countries will change, as developing economies accumulate human capital, invest in infrastructure and new production capacities and progressively catch up in terms of efficiency. Finally, markets will change as well as exporters, leading to a profound revamping of world trade patterns. MIRAGE is providing a detailed description of these changes for a given classification of countries and regions and a given sectoral aggregation of traded goods and services (see Appendix table 3). The transformations of bilateral and sectoral trade flows are driving changes in the sectoral value added in each country, which leads to a reallocation of resources and ultimately changes in factor prices. Last but not least, these reference trajectories will be "bent" by the shocks to trade costs or the migratory movements simulated in various scenarios.
In order to track these repercussions, CGE modelling is essential. The even bigger advantage of CGE analysis is its internal consistency: Markets are cleared, what is produced somewhere is bought elsewhere, available production factors bind the production capacities of countries, sectors must invest to produce, excess demand will be covered by net imports, the external account will be balanced by capital flows when needed or else the real exchange rate (country competitiveness) will have to adjust. Such intrinsic consistency is precious when it comes to addressing issues of an extremely high dimensionality, with many countries growing at different speeds, trading with each other in various sectors ranging from agriculture to business services. In our mind, this intrinsic consistency in the representation of the changing patterns of the world economy, when all factors of growth are combined at the country level, is an enormous asset in order to conduct large scale and medium term foresight activities. Still, it has limits which have to be kept in mind when interpreting the results. These limits are either common to any CGE model of this type, or specific to the version of MIRAGE used here.
Common to all CGE approaches are the simplicity of the functional forms describing agent behaviour and the rather aggregated representation of the world economy, both imposed by computational constraints. The downside of such aggregation is that models do not track what is happening within a given sector in a given region. Similarly, simple functional forms (e.g. the absence of intertemporal optimisation by individual agents) imply that the dynamics of the model are rather elementary – meaning sequential. The model is solved sequentially, on a yearly step, and transition from one period to the next relies on changes in capital depletion, the sectoral allocation of new capital as well as changes in the labour force, TFP and energy efficiency. Also, the parameterisation of key behavioural parameters is rather crude and hardly addresses individual countries' idiosyncrasies. As sectors are aggregated, models do not fully reflect what could happen within a sector affected by e.g. a tariff cut on one product. Changes in tariffs, as any obstacles to trade, are modelled at the sectoral level, even if shocked at the most detailed level before aggregation. This implies that the impact of changes in trade costs (which depends on the variance of the trade costs on the top of the mean) is not measured precisely and that the creation of new flows of exports, the so-called extensive margin of trade, is not
2
A methodological companion paper to the policy-oriented analysis presented here discusses the two modelling frameworks used in great depth. See Fontagné and Fouré (2013).
accounted for. In a nutshell, a country that does not export a category of goods will not begin to export these goods, when trade costs in the sector come down, as the trade elasticity is applied to a zero flow. Last but not least, CGE models generally are not confronted with historical data for validation. Partial remedies were considered in the current exercise, notably by making sure that MIRAGE reproduces the observed past response of trade to changes in world income. But not all limitations could be addressed: For instance, if decisions were to depend on the future state of the economy, and uncertainty to be taken into account, a different class of models (Dynamic Stochastic General Equilibrium models) would need to be used, which hardly allow for any sectoral or regional decomposition. Regarding the extensive margin of trade, or the more detailed representation of trade responses to shocks in trade costs, the large scale ambition of this exercise did not allow us to use modelling advances sometimes implemented in smaller scale models.3
We also faced specific computational or data constraints in our present endeavour that might be circumvented in other simulations. The first issue concerns the representation of competition among firms. Many CGE models fit imperfect competition, and this can also be done in MIRAGE. However, given the long term horizon of the exercise and the structural changes of the economies at stake, we were neither confident that the initial parameterisation of the model would fit well the development of these economies, nor were we convinced that the same parameterisation of market structures could apply in different economies. Combined with additional computing complexity, this led us to work with perfect competition. One important consequence of this choice is that our estimation of the gains from trade (via consumer demand or via producers' purchases of intermediate goods) is rather conservative, as it does not reflect variety gains, scale economies or firm selection. For the present endeavour, this is of lesser importance, as we do not focus on the gains from trade and specialization, but on trade patterns.
The next limitation relates to trade in services. Not all modes of supply (as defined by the WTO's General Agreement on Trade in Services (GATS) Art. I:2) are modelled in our exercise. We model services exported under mode 1 (cross-border trade) and mode 2 (consumption abroad) but modes 4 (presence of natural persons) and 3 (commercial presence) are absent. Quantitatively, this is not a major problem regarding mode 4, which is currently still small, although this might change substantially in the future. More importantly, the absence of services supply via commercial presence abroad is due to our decision not to activate the foreign direct investment (FDI) module in MIRAGE. We made this choice as a result of the lack of reliable information on future movements of FDI (although a snapshot of the current situation, which is usable for CGE modelling purposes, is provided by Guimbard et al., 2011). This limitation is linked to the more general problem regarding foreign presence. We do not have reliable information on the activity of foreign affiliates, with some exceptions (United States and, quite recently, EU member states). The reason for this lack of information is that FATS (Foreign Affiliate Trade in Statistics) are not collected systematically and that FDI stocks (when available) are a poor proxy for the activity of foreign affiliates (Fukui and Lakatos, 2012).
Besides these intrinsic limitations of CGE models and the specific choices made for this modelling exercise, CGE models are said not to take into account an important development of international trade patterns in recent times, namely the expansion of global value chains (GVCs), exemplified by "Factory Asia" (WTO-IDE-JETRO, 2011). The development of GVCs changes many aspects of trade patterns, how to analyse them and the way in which technology, services, investment and trade interplay (Elms and Low, 2013). For example, it can be shown that services are increasingly also traded indirectly through trade in goods (Stehrer, 2012). Baldwin (2011) provides a theoretical framework explaining why the fragmentation of production occurs. In order to understand the implications of global production networks for CGE modelling, it is important to recall that CGE modelling is in line with input-output studies à la Leontief, and, in addition, puts emphasis on prices, market clearing and substitution. Inter-industry relationships are instrumental for the construction of
3
See Gouel et al. (2011) for a development of MIRAGE at the product level and Balistreri et al. (2011) for an inclusion of firm heterogeneity.
CGE models and the origin (domestic or imported) of intermediate consumption is traced. As the results of changing trade patterns can be expressed in terms of value added (and this is what we do here), it is possible to say that GVCs are intrinsically embodied in CGE models, even if trade is not reported in value added terms in the simulations.4 This way of addressing the international fragmentation of production is still far from perfect. In MIRAGE, the geographic composition of the basket of intermediates applies overall and is not differentiated by importing sector. We can, for instance, track the various origins of imported steel in a country, but we cannot know the origin of steel imported by the car industry. We simply assume that the geographic origins of steel imports in that sector are similar to the overall distribution in the economy. Hence, GVCs de facto are present in CGE models, such as MIRAGE, but are not modelled as such owing to this proportionality assumption. Also, the activity of foreign affiliates is present in the database, but not identified as such, and the composition by country of origin of each imported intermediate product is present, but not at the level of the importing industry. Although trade is expressed in gross terms, changes in the value added of the sector mirrors the reaction of industries to trade shocks and take into account international input-output relations, albeit with less detail than in dedicated GVC studies.
B. ECONOMIC AND TRADE SCENARIOS
In order to simulate future trade patterns, assumptions about the principal drivers of economic activity and international trade need to be made. Given the time-frame envisioned here, these are subject to considerable uncertainty. While expert forecasts exist for certain variables, such as demography or energy prices, assumptions for other exogenous variables are based on historical experience, e.g. concerning productivity improvements. For population, we take United Nations Population Division (UNPD) projections, in particular the two contrasting scenarios “high fertility” and “low fertility” which are meant to encompass a range of possible demographic outcomes.5 In a similar manner, we rely on energy price projections by the American Energy Information Administration (EIA), who also provide alternative "high" and "low" oil price scenarios, as well as projections by the International Energy Agency (IEA) for the breakdown of energy prices between coal, oil and gas. The economic growth assumptions underlying these projections naturally are not identical to our growth model projections, but these differences are not very large for the default case.
As far as the other variables are concerned, the "reference case" is calibrated using econometric estimations over the period 1980-2010, therefore being in line with historical evidence. The shocks we propose are quite simplistic, yet mimic orders of magnitude observed in the data, or theoretical eventualities. For instance, we calibrated our TFP shock based on the fall of the USSR or the technological performance of Japan during the 1990s. Sensitivity to capital mobility can either reproduce current but geographically circumscribed practices (low correlation between savings and
4
This view is challenged by Koopman et al. (2013), who compare the impact of a US tariff on Chinese imports using data that explicitly takes account of GVCs (using a new USITC data base) to the impact using conventional data (GTAP database on which our simulations are based as well). The authors use two CGE models, one by the USITC and GTAP. In the former model, export processing zones (EPZ), e.g. in Mexico, are treated as separated economies, i.e. two "Mexicos" appear in the exercise, trading with their usual partners as well as with their twin. Another improvement in the USITC model relates to intermediate consumption, which differentiates intermediate goods according to the exporting country. The upshot of the model comparison is that a tariff faced by Mexico (but not by the Mexican EPZ) will hardly affect Mexican exports in the USITC model, while it does in the traditional model. The "price to be paid" by GVC-oriented studies for providing more information is the absence of substitution and price effects included in traditional CGE modelling. Koopman et al. (2013) show how this limitation can be overcome, but for a model that is much narrower in scope than our approach.
5
The two UNPD scenarios already embody migration assumptions ("normal migrations") that are calibrated by UN experts on a country by country basis. For these migrants, information on age, gender and education levels are not known and, thus, we consider them as natives. However, we consider migration to also be a source of uncertainty, and focus on the two main migratory flows towards the EU and the United States, which would roughly double the flows presumed by UNPD. These "additional" migrants (as opposed to the ones embedded in UNPD projections) are assumed to be characterized by the life expectancy of their destination, while keeping the age structure, gender repartition and educational level of their country of origin.
investment in non-OECD countries), or encompass the theoretical eventuality that countries progressively close their capital flows with the rest of the world. Finally, the trade opening scenario, even if extreme, is not out of touch with reality, such as the full liberalization scenarios used elsewhere (e.g. Anderson and Martin, 2006). For the lower bound as well, pre-Uruguay Round tariffs would simply imply making use of existing binding overhang between applied and bound ceiling rates for certain countries and products.6
Hence, we take uncertainty into account by developing two "extreme" trajectories: A "high" and "low" scenario (according to the expected impact on GDP) is designed for each main economic variable, which, when combined, result in an upper and lower projection. Combining positive and negative "shocks" in this manner not only provides a range in which future outcomes are likely to fall, but is also reasonable in the sense that economic downturns tend to be associated with negative developments for a range of economic variables, including protectionist responses, and vice-versa. Table 1 describes the scenarios chosen for each key economic variable.7
Table 1: Scenarios, by exogenous variable
Low High
Labour
Demography Reference case in high-income countries, low fertility (UNPD) in other
Reference case in high-income countries, high fertility (UNPD) in other
Education convergence 1.5 half-life time 0.5 half-life time
Female participation No improvements Reference case
Migration Reference case Additional migration from SSA and MENA to EU, and from SAM to the US
Capital
Capital mobility Convergence to I=S in 2050 Low Feldstein-Horioka correlation coefficient (as in non-OECD) for all countries
Natural resources
Energy price High price scenario (EIA) Low price scenario (EIA)
Energy productivity +50% in high-income countries, reference case in other
+50% for low and mid income countries, reference case in other
Technology
Total Factor Productivity -50% TFP growth rate for low and mid income countries, -25% for high-income
+50% TFP growth rate for low and mid income countries, +25% for high-income
Trade costs
Tariffs “Trade war”: return to pre-UR applied tariffs
“Trade opening”: -50% in applied tariffs
Other transaction costs on goods +50% cost in low and mid income countries, +25% for other
-50% cost in low and mid income countries, -25% for other
Services measures Reference case “Trade opening”: -50% in services non-tariff measures.
Notations: US stands for "United States", EU for "European Union", MENA for "Middle-East and North
Africa", SSA for "Sub-Saharan Africa" and SAM for "South America".
6
Trade costs are, of course, affected by a wide range of factors of considerable interest to policy-makers, including transportation costs and institutions. While the appropriate detail and disaggregation cannot be provided in a global model of this nature, there is still some indirect representation of such factors e.g. through changes in productivity and the assumptions on broader transaction costs. Trade costs related to transportation are also specifically taken into consideration via energy price developments and sector-specific productivity developments.
7
Although, for simplicity, these variables are grouped by supply side factors, namely endowments and technology, as well as trade costs, linkages exist, including on the demand side. For example, demographic developments are intimately linked to savings, the geographic distribution of which in turn is influenced by the assumptions about capital mobility. Again, scenarios have been developed based on forecasts and empirical evidence. Where alternative forecasts do not exist, the flipside of a chosen scenario may simply reflect its mirror image. For example, the lower bound scenario on technology is symmetric to the (empirically documented) higher bound scenario, which ensures that the interpretation of results is not unduly influenced by vastly differing assumptions on the up- and downside respectively.
Notes: Trade costs only vary in the trade scenarios. "Reference case" means that a variable is projected forward
on the basis of its estimated behaviour in the past, taking into account also interlinkages with other relevant variables. This is done for all countries in the model individually and may imply an improvement or deterioration depending on the estimated behaviour for the country in question. At the global level, in the reference case, MIRAGE is set to reproduce a conservative elasticity of world trade to income observed in the long run (with the exception of the 1990s, characterized by the expansion of global value chains and the surge of new big traders). Regarding educational convergence, half-life time is the time a country will take to reduce its difference with the initial position of the leader by half. Here, the leader is a virtual country composed of the leaders for each age group, level of education and time period. On capital, a lower Feldstein-Horioka correlation coefficient in OECD countries means that the correlation between domestic savings and domestic investment is assumed to be lower, as in non-OECD countries. This impacts the allocation of investment between countries, which is reduced in the former and increased in the latter.
III. MAIN DRIVING FORCES OF FUTURE ECONOMIC DEVELOPMENTS
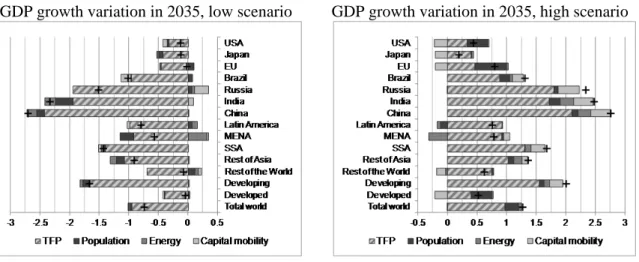
This section analyses the relative contribution of the fundamental economic factors simulated each at a time under the two different scenarios in MaGE. An overview showing the relative deviation from economic growth under the reference scenario attributable to each main economic driver is given in Figure 1.
Figure 1: Relative contribution of each key economic factor to deviations from GDP growth under the reference scenario between 2012 and 2035 (per cent)
GDP growth variation in 2035, low scenario GDP growth variation in 2035, high scenario
Notations: See Table 1.
Notes: See also Appendix tables 1 and 2 for a further decomposition of the aggregated topics "population"
(providing the relative contribution of changes in demography, educational attainment, female participation and migration) and "energy" (energy price and energy productivity). The "total" effect can be different from the sum of the components due to n-round effects.
Source: Author's calculations.
For all countries/regions/groups, variations in total factor productivity (TFP) have the largest impact by far on average GDP growth up to 2035. Developed countries can expect around one half of a per cent more or less average growth per year, amounting to around 9 per cent higher/lower GDP levels in 2035. For developing countries, and especially emerging economies, continued technological progress is crucial. Brazil can add/subtract about 1 per cent growth per year owing to TFP developments, which rises to roughly plus/minus 1.5 per cent for Sub-Saharan Africa, 2 per cent for India and over 2 per cent for China. As a result, projected GDP levels in 2035 would vary by about plus/minus 20 per cent in Brazil, 30 per cent in Sub-Saharan African, 40 per cent in India and more than 55 per cent in China compared to the reference GDP scenario. Developing countries as a group may face a more than 1.5 per cent difference in GDP growth per year depending on the path of technological progress, leading 30 to 40 per cent higher/lower levels in GDP by 2035 compared to the reference scenario.
TFP growth could thus make a strong contribution to convergence under the "optimistic" scenario, resulting in an about 6 per cent higher share in global GDP for developing countries and vice versa. For many countries demography has the second largest impact if not only the pure impact in terms of population numbers is taken into account, but possible improvements in education, female labour participation and migration as well. Population is bound to grow significantly in India and Sub-Saharan Africa. India's population is expected to overtake the current leader (China) by around 2035, with Sub-Saharan Africa surpassing China in 2045 at the latest, and possibly several years earlier, and ultimately becoming the largest region in terms of population numbers under the "high" scenario. However, despite these additions to the labour pool, the demographic effect on GDP is relatively small, increasing/lowering the reference GDP in 2035 by barely 1 per cent in India and even less in Sub-Saharan Africa. For these regions, improvements in education matter significantly. If India and Sub-Saharan Africa catch up faster in terms of educational attainment than under the reference scenario, GDP levels can be about 3 per cent higher in 2035. Similar results obtain for other developing countries in the Middle East and North Africa as well as Latin America. Increasing female participation in the labour force can make a similarly big impact, particularly in India and the Middle East and North Africa, where a lack of improvement would decrease GDP in 2035 by around 4 per cent compared to the reference case. For several developed countries as well as China population numbers are expected to decline having an unfavourable impact on labour force participation. Particularly for the European Union (EU), and to a lesser extent also for the United States, additional migration may have an important balancing impact. Additional migration not only affects the size and composition of the labour force, but can also play a positive role for savings/investment. Under such a scenario, per capita incomes in the EU and United States would be 2 per cent higher in 2035 compared to the reference case.8
For a range of developing countries, improvements in capital mobility will make as much or more of a difference. In an optimistic scenario, which would reduce the observed bias towards domestic investment, annual GDP growth in the developing world could be up to one third of a per cent higher than under the reference scenario. This would lead to 8 per cent higher levels in GDP in the Russian Federation in 2035, over 6 per cent in India and China and more than 4 per cent in Brazil, Sub-Saharan Africa and the developing world overall, with GDP in the Middle East and North Africa and the Rest of Asia still increasing by around 2 per cent. While if capital mobility is not increasing as much surplus developing countries (principally the Russian Federation, India and China) might still avert a negative deviation from reference growth rates, Brazil would be hardest hit with almost 4 per cent lower levels in GDP by 2035. Sub-Saharan Africa and Latin America would lose 1 per cent in GDP by 2035, bringing the average impact on developing countries to just above zero. Under any scenario of improved capital mobility, developed countries will obviously see lower investment for a given amount of savings. At most, high capital mobility could reduce GDP levels in 2035 by about 4 per cent for the EU, United States and Japan.
Finally, energy prices are of substantial importance to leading oil exporting nations on the one hand and to import-dependent countries, particularly those emerging and developing economies with high energy intensities (China, India, Sub-Saharan Africa), on the other. Higher energy prices, as forecasted by the United States Energy Information Administration (EIA), can reduce average annual GDP growth by up to a fifth of a per cent in China and India, reducing GDP in 2035 by almost 4 per cent in these countries. Exporters, such as the Russian Federation, parts of Latin America (Venezuela, Colombia and Mexico) and in particular the Middle East and North Africa, would benefit in such a scenario, with the latter adding up to one third of a per cent to their annual GDP growth and seeing almost 7 per cent higher GDP levels in 2035 compared to the reference case. These patterns would be reversed under a low price scenario, with oil exporters in the Middle East and North Africa being particularly hurt. However, energy prices may ultimately have hardly any effect on GDP if improvements in energy productivity are taken into account. Higher energy productivity (together
8
Per capita GDP cannot be read from the data presented here, but is easily calculated on the basis of projected GDP and population levels.
with substitution effects triggered by higher energy prices) would practically wipe out any negative economic effects in developed countries. Similarly, the impact of higher energy prices on economic growth in China, India and Sub-Saharan Africa, for instance, would be reduced by at least 40 to 50 per cent in the former two countries and completely compensated for by energy productivity improvements in the latter.
IV. TRENDS IN TRADE
The direction, composition and nature of international trade have changed substantially over the past couple of decades, and many of these trends may be related to the proliferation of GVCs. Emerging economies have gained a larger share in global trade and increasingly trade with one another. At the sectoral level, developing countries have diversified their exports and obtained a higher overall share in manufacturing trade. The importance of services trade has also risen. At the same time, much of "global" trade is actually concentrated at the regional level. In analysing country, sector and factor outcomes of our integrated MaGE and MIRAGE simulations in more detail, we will now examine to what extent these trends in trade can be expected to continue in the future.
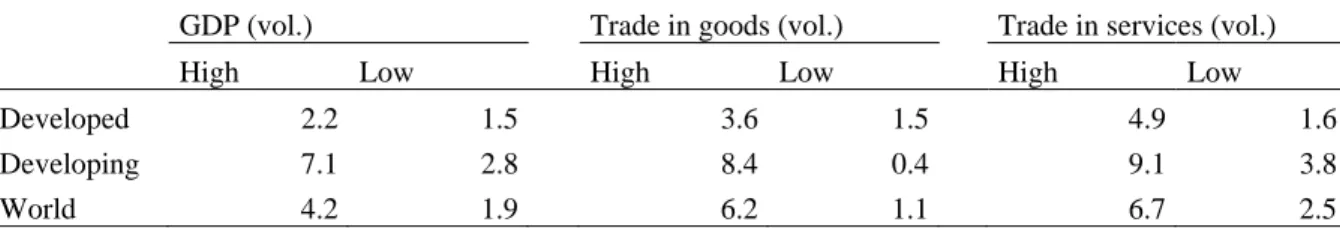
Table 2 gives an overview of the combined macroeconomic and trade simulations in terms of projected average annual growth rates of GDP and exports up to 2035. Exports are likely to vary more than GDP, exhibiting higher positive and negative growth rates under the respective scenarios. Whether a future scenario of key economic and policy variables is rather optimistic or pessimistic matters a lot more for developing than for developed countries, with the former being characterized by a much larger variation in outcomes than the latter. While growth rates are generally lower in a gloomy economic and trade environment across both groups of countries, the difference is barely three quarters of a per cent for developed countries' average GDP growth, but over 4 per cent for developing countries. Growth in GDP and services trade in developing countries is widely superior to growth rates in developed countries in the optimistic scenario, but much less so in a pessimistic scenario, where growth in goods trade could advance even more slowly than in developed countries. Examining specifically the trade cost component, it turns out that growth in developing countries would be about half a per cent higher/lower in an open/restrictive trade policy environment, while growth in developed countries would hardly be affected.
Table 2: Projected average annual growth rate of GDP, exports in goods and exports in services, 2012-2035 (per cent)
GDP (vol.) Trade in goods (vol.) Trade in services (vol.) High Low High Low High Low
Developed 2.2 1.5 3.6 1.5 4.9 1.6
Developing 7.1 2.8 8.4 0.4 9.1 3.8
World 4.2 1.9 6.2 1.1 6.7 2.5
Source: Authors' calculations.
The simulated growth rates imply that, in terms of GDP, China would be larger than the United States and the European Union by 2030 at the latest under the "high" scenario. India would reach China's current economic size by about 2025, but only under the "high" scenario, in which case it would also attain China's "low" scenario GDP level by 2035. Whether the future economic and policy outlook is rather optimistic or pessimistic is of considerable importance for Sub-Saharan Africa, whose GDP levels would practically stagnate under a "low" scenario, falling further behind the economic size of Brazil in 2035, but which could outperform the latter under a "high" scenario, and this already before the year 2030. The Russian Federation can stay ahead of these two regions only for an optimistic outlook, falling behind Sub-Saharan Africa and Brazil in terms of GDP levels in the adverse case. In sum, whether future developments are closer to the upper than the lower growth path makes a particularly big difference for developing countries. The resulting variation of around 2 per cent on either side around baseline GDP growth results in about one-third lower or 50 per cent higher per
capita incomes in this group of countries by 2035, with an even larger divergence for individual countries, notably China and India.
Trend 1: New players in the world economy
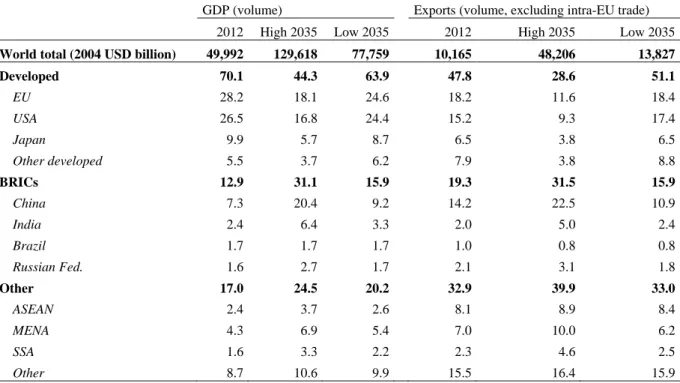
In Table 3 current and simulated shares in global GDP and exports are given for major countries and regions. Emerging economies, such as the BRICs group, have the possibility to further increase their share in both world GDP and exports under the "high" scenario. But the BRICs would also be particularly affected by a gloomy economic and trade policy outlook, in which case their share in global exports would fall below its current level, while the share of other developing countries would remain about unchanged. The possible difference in trade outcomes is particularly stunning for China, which could enlarge its share in world exports to almost one quarter under the "high" scenario, but would lose ground in the reverse case (in both relative and absolute terms). As far as China's GDP developments are concerned, it could more than double its share to reach one fifth of world GDP under the "high" scenario, but would only realize a modest increase compared to its present share (about 7 per cent) in the "low" scenario. While for developed countries, both export and GDP shares would decline under the "high" scenario, this does certainly not mean that they would lose out. To the contrary, the simulations show that developed countries would be better off realizing a smaller share of a "much larger pie" under the high scenario than vice versa in terms of both GDP and exports. Table 3: Country/regional shares in global GDP and exports (per cent)
GDP (volume) Exports (volume, excluding intra-EU trade) 2012 High 2035 Low 2035 2012 High 2035 Low 2035
World total (2004 USD billion) 49,992 129,618 77,759 10,165 48,206 13,827
Developed 70.1 44.3 63.9 47.8 28.6 51.1 EU 28.2 18.1 24.6 18.2 11.6 18.4 USA 26.5 16.8 24.4 15.2 9.3 17.4 Japan 9.9 5.7 8.7 6.5 3.8 6.5 Other developed 5.5 3.7 6.2 7.9 3.8 8.8 BRICs 12.9 31.1 15.9 19.3 31.5 15.9 China 7.3 20.4 9.2 14.2 22.5 10.9 India 2.4 6.4 3.3 2.0 5.0 2.4 Brazil 1.7 1.7 1.7 1.0 0.8 0.8 Russian Fed. 1.6 2.7 1.7 2.1 3.1 1.8 Other 17.0 24.5 20.2 32.9 39.9 33.0 ASEAN 2.4 3.7 2.6 8.1 8.9 8.4 MENA 4.3 6.9 5.4 7.0 10.0 6.2 SSA 1.6 3.3 2.2 2.3 4.6 2.5 Other 8.7 10.6 9.9 15.5 16.4 15.9
Notations: See Table 1. ASEAN stands for "Association of Southeast Asian Nations". Source: Authors' calculations.
The more prominent role of developing countries in international trade under an "optimistic" scenario would also entail a significantly higher share of "South-South" relationships, i.e. trade among developing countries, at 43 per cent of the global trade (currently at 19 per cent), which would then constitute the dominant direction of trade compared to 40 per cent of "North-South" and 17 per cent of "North-North" trade. By contrast, under the "low" scenario the situation would be practically inverted, with North-North and South-South trade in the year 2035 remaining approximately at their current shares of around 40 per cent and just below 20 per cent respectively. In absolute terms, despite the lower share, North-North trade would still be one quarter bigger under the "high" than under the "low" scenario.
As far as the product composition of trade is concerned, many studies have shown – often using the concept of Revealed Comparative Advantage (RCA) – that countries have become less specialized over time and diversified their range of export products. The reason for this may be that while countries continue to specialize in sectors based on comparative advantage, both technological and policy factors, such as advances in telecommunications and information technology and increased economic integration, have facilitated the diffusion of technology and movement of production factors across borders. Depending on how such factors evolve in the future, current patterns of specialization may change. A growing literature analyses the link between export diversification and economic growth and, hence, illustrates the particular importance of this trend for developing countries.9
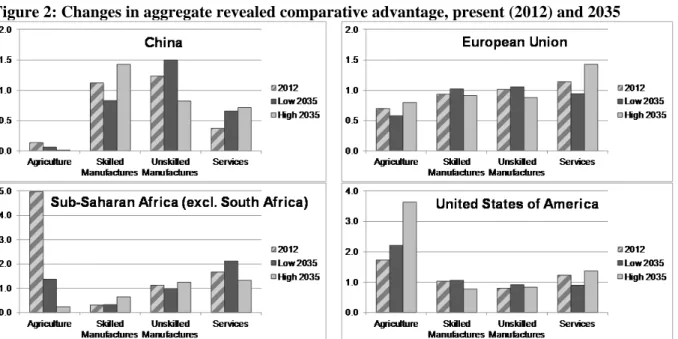
Figure 2 shows possible shifts in RCA for aggregate sectors under the different scenarios for a selection of countries/regions. The sectoral aggregation presented here illustrates the possibility that the current trend of increased specialization into skill-intensive sectors,10 particularly in emerging economies, such as China, may be reversed under an unfavourable trade cost scenario. In such a situation, China's RCA in skilled manufacturing, which currently stands at just above unity, would fall to about 0.8 as opposed to a further strengthening to almost 1.5 under an optimistic outlook on trade costs. At the more disaggregate sectoral level, this would imply a further RCA expansion for China in traditional unskilled-labour intensive sectors, such as textiles, under the "low" scenario, while RCA in skill-intensive sectors, such as electronics and machinery, would significantly retreat, threatening to fall back below unity in the latter sector and, hence, frustrating efforts to further diversify the country's export base. The opposite would occur in the "high" scenario, in which case China would also broaden its revealed comparative advantage into high skill-intensive sectors, such as transport equipment, where this is not presently the case. Two main drivers are behind these developments: On the one hand, the continued "up-skilling" of production (implicit in the education scenarios) substantially reshapes comparative advantage towards more skill-intensive activities, both directly as the skill premium decreases, and indirectly as up-skilling leads to higher total factor productivity, more revenues and ultimately a higher demand in services and skill-intensive goods. On the other hand, a negative trade policy outlook can modify this link between skills and comparative advantage. As far as tariffs are concerned, these are presently lower for skill-intensive sectors, but were on the same order of magnitude as non-skill intensive sectors before the Uruguay round. Therefore, skill-intensive sectors are comparatively more impacted by a confrontational trade policy scenario, moving China's specialization (which is particularly dependent on foreign demand in the "low" scenario) towards non skill-intensive sectors.
Similar drivers are at work for other regions, such as Sub-Saharan Africa, where, under the "low" scenario, a lack of trade policy cooperation would leave its RCA for all manufacturing below unity. Conversely, in the "high" case, Sub-Saharan Africa would gain in manufacturing RCA, making also progress in skill-intensive sectors. At the same time, being the worst performing region in terms of agricultural productivity in both crops and livestock, the "high" scenario would help Sub-Saharan Africa to significantly reduce its reliance on agriculture (and other primary commodities), which currently exhibits the by far largest RCA in the region. The situation and prospects in developed countries in this regard are quite different. In our estimations, the United States is and will continue to be the technological leader in the crops sector, being also very productive in the livestock sector. It can be expected to increase its RCA in the agricultural sector under any scenario, but much more so in the "high" case, including through an additional boost from trade opening. A favourable trade policy outlook would also further propel the United States' RCA in the area of services, where, in the
9
Cadot et al. (2013) provide an excellent guide to the literature on diversification and productivity. See particularly Feenstra and Kee (2007; 2008) for an empirical analysis of the endogeneous nature of this relationship and the importance of trade liberalization in that regard.
10
The categorization into "skilled" and "unskilled" manufacturing sectors was made on the basis of payroll data from the United States, taking the median of the skilled share as the dividing line. Unskilled sectors include for example textiles, food and metals, while skilled sectors comprise sectors, such as cars and trucks, transport equipment, electronics and machinery.
opposite case, its existing RCA may be lost. The two diverging scenarios make less of a difference for the United States in manufacturing, where the RCA risks remaining slightly sub-par in a number of sectors. Predicted RCA patterns for the EU are quite similar, with the exception of agriculture, where it is nowhere near the unity threshold under any scenario.
Figure 2: Changes in aggregate revealed comparative advantage, present (2012) and 2035
Note: In this figure, the energy sector is not shown separately, as results would be unduly influenced by poor
input-output accounting in certain regions and sectors, notably gas distribution and production.
Source: Authors' calculations.
Trend 3: Importance of services trade
Services account for an increasing share in global trade, in particular if measured in value added terms (World Trade Organization, 2013). The continued importance of services trade compared to goods applies to both scenarios. The increased share of services in global trade (about one quarter)11 under a "low" scenario is obviously influenced by possible negative trade policy developments in the area of goods. However, the share of services compared to goods also goes up in the "high" scenario, where symmetric improvements in trade costs for both goods and services are simulated, with the absolute value of services exports rising by a factor of between three and four in 2035 compared to the current situation. Developing countries as a group would capture a larger share of services trade under the "high" scenario, particularly owing to China, who would see its contribution to global services exports more than triple to account for 18 per cent in 2035. The higher involvement in services trade would not come at the expense of developing countries' exports of manufactures (see Table 4). Under the assumption of a bright economic and trade policy outlook, developing countries would continue to capture a larger market share in manufacturing exports as well. Again, China would be dominant in this regard, accounting for almost 30 per cent of global exports in manufactures under such a scenario. By contrast, if economic conditions were to deteriorate and countries flout on their trade policy commitments, developing countries would see their share in manufacturing trade fall, with China suffering the largest percentage decline. Larger manufacturing export shares for the European Union and the United States in such a scenario cannot conceal the fact that they too would lose in absolute terms.
11
Goods trade here comprises manufacturing, energy and agriculture. In the following, we concentrate on a comparison of trade in services and manufactures, which is particularly relevant from a development perspective.
Table 4: World exports of manufactured goods and services, country/regional shares in 2012 and 2035 (billion USD and per cent)
Manufactures Services 2012 High 2035 Low 2035 2012 High 2035 Low 2035 World total (2004 USD billion) 7,245 33,285 9,078 1,706 8,678 3,216
Developed 48.4 25.3 53.8 58.8 40.8 47.7 EU27 18.1 10.2 18.6 26.9 20.5 22.7 US 15.1 8.0 17.7 20.1 14.0 14.5 Japan 8.1 4.7 8.5 3.9 2.4 4.0 Other developed 7.1 2.4 9.0 7.9 3.9 6.5 BRICs 22.5 37.2 17.6 9.9 24.3 13.0 China 18.3 27.7 13.9 5.7 18.0 7.2 India 2.0 6.2 2.0 2.5 3.2 3.9 Brazil 0.9 0.6 0.5 0.6 0.3 0.4 Russian Fed. 1.3 2.8 1.1 1.1 2.7 1.6 Other 29.1 37.5 28.6 31.3 34.9 39.3 ASEAN 9.0 9.8 9.8 5.4 5.3 5.8 MENA 3.4 6.9 2.8 7.4 8.1 9.9 SSA 1.3 3.7 1.5 2.0 4.6 3.2 Other 15.4 17.0 14.4 16.5 17.0 20.4
Notations: See Table 1.
Note: Again, intra-EU trade is excluded. Source: Authors' calculations.
Trend 4: Regionalism
A major trend in trade policy has been towards the conclusion of preferential trade agreements, particularly at the regional level (World Trade Organization, 2011). In certain regions, particular Asia, intra-regional trade has persistently increased over the past two decades in both relative and absolute terms (World Trade Organization, 2013). Our model simulations until 2035, however, do not foresee this trend to continue unabated. Looking at some of the largest free trade arrangements, the relative share of trade taking place within these regions is expected to decline under the "high" scenario (see Table 5, which also indicates that no major changes would occur under the "low" scenario). The share of trade within the European Union would be particularly affected, falling more than a half, from 22 per cent to just 9 per cent of world trade, even though in absolute numbers intra-trade volumes would still increase. Similarly, the share of trade within the North American Free Trade Agreement (NAFTA) in global commerce would decline by more than half by 2035. By the same token, assuming no further preferential trade integration, extra-regional trade would vastly increase in importance, in both absolute and relative terms, accounting for 70 per cent at present and more than 85 per cent of world trade in 2035 under the "high scenario". While these predictions give strong support to further economic integration at the multilateral level, the possibility of intensified and enlarged preferential trade arrangements in the future cannot be discarded, especially in light of certain "mega-regional" deals already being under discussion today.
In order to assess the effect of further preferential trade integration on multilateral trade relationships, we introduce an additional, "extreme" policy shock in the "low" scenario (now called "low reg"), in which three purely hypothetical mega-regional trade deals are presumed to exist in the Americas, Asia and Europe-Africa. First, such mega-regional agreements could increase world trade by 16 per cent, partly compensating the downturns we observe in our "low" scenario. This set-up would obviously imply significant trade diversion from existing trade agreements, and the long term trend towards the importance of multilateralism would still prevail. By 2035, extra-regional trade relations would still account for 37 per cent of global trade even with the three hypothetical large free trade areas. These results also emphasize that the largest unexploited potential in regional integration remains in Asia,
since it would be the only region to register a significant increase in its share of global trade due to a mega-regional agreement, and this despite trade volumes increasing also in the other two hypothetical mega-regions. This relative increase would mainly be due to the high initial tariff levels in this region compared to EU-Africa and the Americas, and this trade potential is likely to be exploited as negotiations within Asia have already made progress, for instance, between the ASEAN and its regional partners (ASEAN+6) (Kawai and Wignaraja, 2013).
Table 5: Intra-regional and extra-regional trade as shares of global trade (including intra-EU trade), constant 2004 prices, by agreement and potential "mega-regional" free trade arrangement
2012 High 2035 Low 2035 Low Reg 2035 World total (2004 USD billion) 12,945 52,714 17,588 20,446 By current agreement
EU 21.5 8.6 21.4 17.8
NAFTA 6.5 3.3 8.2 7.0
ASEAN 1.3 1.7 2.1 1.6
MERCOSUR 0.7 0.7 0.5 0.6
By potential mega-regional agreement
EurAfrica 34.5 23.7 35.8 35.5
Americas 9.1 5.3 10.2 10.1
Asia 10.9 17.2 8.8 17.0
Notations: EU stands for "European Union", NAFTA for "North American Free Trade Agreement", ASEAN for
"Association of Southeast Asian Nations" and MERCOSUR for "Southern Common Market".
Source: Author's calculations.
V. CONCLUSIONS
This study has examined both major trends in trade, seeking to project these several decades into the future, and the forces that drive such developments. For that purpose, we have combined a macroeconomic growth model with a multi-sectoral CGE framework and constructed two extreme, internally consistent scenarios up until the year 2035 – one of further dynamic growth and trade integration and one of a worsening economic environment and slippage in trade cooperation. This has allowed us to chart out boundaries for possible future developments in international trade, based on existing forecasts and well-grounded assumptions about individual economic variables. Making the influence of each factor traceable throughout our model, we have also been able to assess the relative importance of individual policy areas for specific countries and regions.
A notable trend over the last two decades was the emergence of new players in the world economy. Under the "high" scenario, developing countries will continue to claim a growing share of global GDP and trade. In the reverse case, however, they might lose ground in trade and register only modest increases in their share of global GDP. Individual developing countries, notably China, appear to have particularly high stakes in the future economic and trade policy outlook, given the enormous difference in impact that the two scenarios can have. The emergence of developing countries in international trade in recent times has also been fuelled by South-South trade relations. While this could become the dominant direction of trade under a dynamic economic and open trade environment, the opposite is the case for a gloomy economic and confrontational trade policy scenario. Another trend in the direction of trade has been its increased regionalization, with the phenomenal growth in intra-Asia trade standing out. This trend is unlikely to continue under a "high" scenario, in which case trade relationships with countries around the globe would account for more than four fifths of total trade. The "low" scenario would leave the current state of regionalism practically unchanged, while "mega-regional" deals, some of which are already under negotiation, would foster international trade, but not necessarily along with further regionalization, with the exception of Asia, where intra-trade would continue its ascent. Even under such a scenario, trade outside the hypothetical regional blocs
would still comprise nearly 40 per cent of world trade, thus giving new emphasis to the importance of further multilateral trade opening.
As far as the product composition of trade and the related issue of factor intensity are concerned, an important trend has been the increased diversification of developing countries' export baskets into skill-intensive sectors. While this trend is likely to last for a continuing convergence in educational attainment and related total factor productivity improvements, it can be undermined in part by an unfavourable scenario on trade costs. Using revealed comparative advantage (RCA) as an indicator of specialization into various sectors, we find that under a "low" scenario, some of the emerging economies may be faced with a loss of RCA in skilled manufacturing sectors, such as electronics and machinery, and a fall-back onto an expanding RCA in non-skill-intensive sectors, such as textiles. Conversely, favourable developments on trade costs may not only help to expand the former, but also build RCA in further skill-intensive manufacturing sectors, such as transport equipment in the case of China. Sub-Saharan Africa would also benefit from a "high" scenario in order to diversify away from its heavy dependence on commodities towards manufactured exports. Services trade will continue to rise in importance, particularly for developing countries under a "high" scenario. A degree of divergence exists in this group, with regions, such as Sub-Saharan Africa, expanding their RCA in manufacturing rather than services in such a case.
The second objective of this study has been to assess the relative importance of key driving factors in different countries. Technology has the biggest impact on economic development for practically everyone. This includes continued improvements in energy productivity, which would be of considerable importance to both developing and developed countries to counter possible effects of persistently higher energy prices. For many developing countries, such as India, countries in the Middle East and Sub-Saharan Africa, population dynamics are an important consideration as well. These countries may benefit from a demographic dividend, but much will depend on education policy and the integration of women in the work force in order to take advantage of these developments. The reverse – a declining and ageing population – will be a challenge for China as well as most developed countries. Policies of openness to migration can provide some measure of relief to the EU and United States, depending also on the skill composition of additional labour resources as well as savings behaviour. For China, continuing the path of rapid accumulation of capital together with skill- and technology-upgrading can more than compensate for these effects. Most developing countries could benefit to a similar extent from improved capital mobility. In the adverse case, developing countries featuring a surplus (such as the Russian Federation, India and China) can cushion the consequences on economic growth, while others, notably Brazil, would be negatively affected. Finally, trade costs can have a significant impact on specialization patterns in developing countries. Unfavourable trade cost scenarios have the potential to disrupt the successful diversification process by emerging economies. Resource-rich countries, for instance in Sub-Saharan Africa and the MENA region, also need to reduce the "distance" to world markets in order to diminish their commodity export dependency and exposure to presumed price volatility e.g. in international energy markets.
This paper has sought to fill a gap in the existing literature by combining an explicit economic growth model with a multi-sectoral model at the world level and for a time horizon (year 2035) that is long enough in order to allow for fundamental macroeconomic factors to have an impact and yet is not too distant in order for reasonable assumptions on their future trajectories to be made. We have also shown some limitations that can be addressed in our further work. One extension would be to explicitly address the role of multinational firms in shaping world trade patterns. To do so, we need a database of foreign presence at the investor-host-sector level (Fukui & Lakatos, 2012) and to implement foreign presence in the CGE framework by splitting production by ownership of firms. Goods and services could then be differentiated by ownership of the firm, instead of being differentiated by region of production (an i-phone produced in China would then be a United States product) – an approach initiated by Petri (1997).12 A second extension would be to improve upon the
12
An example of this approach is provided by Lakatos & Fukui (2013) on a small scale (liberalization of retail services in India).
measurement of non-tariff measures and their trade restrictiveness and provide for a more detailed modelling of agreements aimed at tackling "behind the border protection". Finally, more work is needed regarding the energy and carbon content of trade flows, in order to take into account how major environmental policy concerns potentially affect future economic developments.
References
Anderson, K. & Martin, W. (eds.) (2006), Agricultural Trade Reform and the Doha Development
Agenda, Palgrave Macmillan and the World Bank, Washington, D.C.
Anderson, K. & Strutt, A. (2012), 'The changing geography of world trade: Projections to 2030',
Journal of Asian Economics 23(4), 303--323.
ADB (2011), 'Asia 2050: realizing the Asian century', Emerging Markets Forum, Asian Development Bank, Manilla.
Baldwin, R. (2011), 'Trade and Industrialisation after Globalisation’s 2nd Unbundling: How building and Joining a Supply Chain are Different and Why it Matters', NBER Working Paper No. 17716, National Bureau of Economic Research. Washington D.C.
Balistreri Edward J., Russel H. Hillberry, Thomas F. Rutherford (2011), Structural estimation and solution of international trade models with heterogeneous firms, Journal of International Economics 83(2): 95-108.
Cadot, O., Carrère, C. and Strauss-Kahn, V. (2013), 'Trade diversification, income, and growth: What do we know?', Journal of Economic Surveys 27(4): 790–812.
Duval, R. & de la Maisonneuve, C. (2010), 'Long-run growth scenarios for the world economy',
Journal of Policy Modeling 32(1), 64-80.
Elms, D.K. and Low, P. (2013), Global Value Chains in a Changing World, World Trade Organization, Geneva.
European Commission (2012), ‘Global Europe 2050’, Directorate-General for Research and Innovation, Socio-economic Sciences and Humanities, Brussels.
Feenstra, R. and Kee, H.L. (2007), 'Trade liberalisation and export variety: a comparison of Mexico and China', The World Economy 30(1): 5–21.
Feenstra, R. and Kee, H.L. (2008), 'Export variety and country productivity: estimating the monopolistic competition model with endogenous productivity', Journal of International Economics 74(2): 500–518.
Fontagné, L.; Fouré, J. & Ramos, M. P. (2013), 'MIRAGE-e: a General Equilibrium Long-term path of the Word Economy', CEPII Working Paper 2013-39, Centre d'Etudes Prospectives et d'Informations Internationales, Paris.
Fontagné, L. & Fouré, J. (2013), 'Opening a Pandora's Box: Modelling World Trade Patterns at the 2035 Horizon', WTO Staff Working Paper No. ERSD-2013-09, World Trade Organization, Geneva. Fukui, T., & Lakatos, C. (2012). ‘A global database of foreign affiliate sales’. United States International Trade Commission. Office of Economics Working Paper, (2012-08A), 112.
Gouel, C., Mitaritonna, C. & Ramos, M.P. (2011), 'Sensitive products in the Doha negotiations: The case of European and Japanese market access', Economic Modelling 28(6): 2395-2403.
IEA (2011), World Energy Outlook 2011, International Energy Agency, Paris.
IMF (2012), 'Changing patterns of global trade', International Monetary Fund, Washington, D.C. Kawai, M. and Wignaraja, G. (2013), 'Patterns of FTAs in Asia: A Review of Recent Evidence', Policy Studies No. 65, East West Center, Honolulu.
Koopman, R.B., Tsigas M., Riker D. & Powers, W. (2013), 'The implications of using value-added trade data for applied trade policy analysis', in: Elms, D.K. and Low P. eds. (2013): 109-134.
Lakatos, C. & Fukui, T. (2013), Liberalization of Retail Services in India: a CGE Model, USITC working papers, N° 2013-03, United States International Trade Commission, Washington D.C.
Petri, P. (1997). ‘Foreign Direct Investment in a Computable General Equilibrium Framework’. Conference, Making APEC Work: Economic Challenges and Policy Alternatives.
Petri, P. & Zhai, F. (2013), 'Navigating a Changing World Economy: ASEAN, the People's Republic of China, and India', ADBI Working Paper No. 404.
Stehrer, R. (2012), 'Trade in Value Added and the Valued Added in Trade, wiiw Working Papers No. 81, The Vienna Institute for International Economic Studies.
UNPD (2011), World Population Policies 2011, United Nations Population Division, New York. World Bank (2007), 'Global economic prospects: Managing the next wave of globalization', The World Bank, Washington, D.C.
WTO-IDE-JETRO (2011), Trade Patterns and Global Value Chains in East Asia: From Trade in
Appendix tables
Appendix table 1: GDP volume variation in 2035, MaGE population and energy “low” scenarios (per cent)
Population Energy Education Female participation Population TOTAL Energy price Energy productivity TOTAL
US 0.00 -0.04 0.01 -0.03 -0.02 0.02 0.00 Japan -0.01 -0.07 0.01 -0.07 -0.03 0.01 -0.02 EU -0.02 0.11 0.01 0.10 -0.03 0.01 -0.01 Brazil -0.04 0.17 -0.06 0.07 -0.01 0.00 -0.01 Russian Fed. -0.02 0.10 -0.02 0.06 0.05 0.00 0.05 India -0.05 -0.21 -0.04 -0.30 -0.18 0.00 -0.18 China -0.02 -0.05 -0.06 -0.13 -0.17 0.00 -0.17 Latin America -0.05 0.14 -0.03 0.07 0.09 0.00 0.09 MENA -0.05 -0.17 -0.01 -0.23 0.30 0.01 0.31 SSA -0.04 0.05 -0.03 -0.01 -0.06 0.00 -0.06 Rest of Asia -0.03 -0.09 -0.01 -0.14 -0.11 0.01 -0.10
Rest of the World -0.02 0.13 0.01 0.11 0.04 0.02 0.06 Developing -0.03 -0.04 -0.04 -0.11 -0.05 0.00 -0.05 Developed -0.01 0.03 0.01 0.03 -0.02 0.02 0.00 Total world -0.02 0.00 -0.01 -0.04 -0.03 0.01 -0.02
Notations: See Table 1.
Appendix table 2: GDP volume variation in 2035, MaGE population and energy “high” scenarios (per cent)
Population Energy Education Population Migrations TOTAL Energy price Energy productivity TOTAL
US 0.00 -0.01 0.35 0.34 0.03 0.00 0.03 Japan 0.02 -0.01 0.00 0.01 0.03 0.00 0.04 EU 0.07 -0.01 0.48 0.53 0.03 0.00 0.03 Brazil 0.12 0.06 0.00 0.17 0.01 0.03 0.04 Russian Federation 0.04 0.02 0.00 0.07 -0.09 0.09 -0.01 India 0.14 0.04 0.00 0.18 0.16 0.07 0.23 China 0.05 0.06 0.00 0.11 0.15 0.06 0.22 Latin America 0.13 0.03 -0.28 -0.12 -0.09 0.03 -0.06 MENA 0.13 0.02 -0.12 0.03 -0.35 0.03 -0.32 SSA 0.11 0.03 -0.13 0.00 0.02 0.08 0.10 Rest of Asia 0.08 0.02 0.00 0.09 0.10 0.04 0.14
Rest of the World 0.04 0.00 0.00 0.03 -0.04 0.01 -0.04 Developing 0.09 0.04 -0.05 0.08 0.04 0.05 0.09 Developed 0.03 -0.01 0.32 0.35 0.02 0.00 0.02 Total world 0.06 0.01 0.15 0.22 0.03 0.03 0.05
Appendix table 3: Regional and sectoral aggregation used in the simulations
Regions Sectors
Developed countries
European Union
European Free Trade Association US
Canada Japan
Australia and New Zealand
Developing/Emerging countries Brazil Russian Federation India China Republic of Korea
Association of Southeast Asian Nations Middle-East Turkey North Africa South Africa Mexico Rest of Africa Rest of Europe Rest of Latin America Rest of the world
Agriculture Crops Livestock Other Agriculture Energy Coal Oil Gas
Petroleum and coal products Electricity
Industry
Food Textile Metals
Cars and Trucks Transport equipment Electronic devices Machinery Other Manufacturing Services Transport
Finance, Insurance and Business services Public administration