HAL Id: hal-02309494
https://hal-amu.archives-ouvertes.fr/hal-02309494
Submitted on 9 Oct 2019
HAL is a multi-disciplinary open access
archive for the deposit and dissemination of
sci-entific research documents, whether they are
pub-lished or not. The documents may come from
teaching and research institutions in France or
abroad, or from public or private research centers.
L’archive ouverte pluridisciplinaire HAL, est
destinée au dépôt et à la diffusion de documents
scientifiques de niveau recherche, publiés ou non,
émanant des établissements d’enseignement et de
recherche français ou étrangers, des laboratoires
publics ou privés.
Full coverage infrared thermography diagnostic for
WEST machine protection
X. Courtois, Mh. Aumeunier, C. Balorin, J.B. Migozzi, M. Houry, K.
Blanckaert, Y. Moudden, C. Pocheau, A. Saille, E. Hugot, et al.
To cite this version:
X. Courtois, Mh. Aumeunier, C. Balorin, J.B. Migozzi, M. Houry, et al.. Full coverage infrared
thermography diagnostic for WEST machine protection. Fusion Engineering and Design, Elsevier,
2019, 146, pp.2015-2020. �10.1016/j.fusengdes.2019.03.090�. �hal-02309494�
Contents lists available atScienceDirect
Fusion Engineering and Design
journal homepage:www.elsevier.com/locate/fusengdes
Full coverage infrared thermography diagnostic for WEST machine
protection
X. Courtois
a,⁎, MH. Aumeunier
a, C. Balorin
a, J.B. Migozzi
b, M. Houry
a, K. Blanckaert
a,
Y. Moudden
a, C. Pocheau
a, A. Saille
a, E. Hugot
c, M. Marcos
c, S. Vives
a, WEST Team
a aCEA, Insvtitute for Research on Fusion by Magnetic confinement, 13108, Saint-Paul-Lez-Durance, FrancebJBM Optique, 11 avenue de la division Leclerc, 92310, Sèvres, France cAix-Marseille Univ., CNRS, CNES, LAM, Marseille, France
A R T I C L E I N F O
Keywords:
Infrared thermography Temperature monitoring Plasma facing component Safe operation
A B S T R A C T
The WEST platform aims at testing ITER like W divertor targets in an integrated tokamak environment. To operate long plasma discharges, IR thermography is required to monitor the main plasma facing components by means of real time surface temperature measurements, while providing essential data for various physics studies. To monitor the new divertor targets, the WEST IR thermography protection system has been deeply renewed, to match the new tokamak configuration. It consists of 7 endoscopes located in upper ports viewing the whole lower divertor and the 5 heating devices. Electronic devices and computers allow data storage of≈3 Gb/s IR images and real time video frames processing at 50 Hz rate, to ensure the protection of the main plasma facing components during plasma discharges by a feedback control of the power injected by the heating systems.
Each endoscope provides 2 views covering 2 divertor sectors of 30° (toroidally) and 1 view of a heating antenna. Each optical line is composed of a tight entrance window followed by a head objective which forms an image transported through the endoscope by a series of 4 optical relays and mirrors, up to a camera objective. Finally, 12 IR cameras specially developed for WEST environment capture the thermographic data, at the wa-velength of 3.9μm, with a 640 × 512 pixels frame size.
The paper describes the design constraints and diagnostic technologies: optics, mechanics, electronics, hard & software, cameras. Tvhe laboratory characterization procedures (Modulation Transfer Function, slit response, calibration), and the measurement performance results are given (spatial resolution, temperature threshold). Finally,first results obtained during experimental campaigns in WEST are presented.
1. Introduction 1.1. Context
There is a compelling need for fusion machine protection to mea-sure the surface temperature of Plasma Facing Components (PFC) in order to ensure their integrity and control plasma discharge injected power. This is the role devoted to infrared (IR) thermography.
Tore Supra (TS) was a Carbon-based limiter machine, operated with L-mode from 1988 to 2012. It has been upgraded to WEST, after 5 years of intensive work. WEST is now a full metallic environment tokamak, with an X-point divertor configuration. It is targeted at testing ITER like divertor prototypes made of actively cooled bulk tungsten units, in tokamak conditions during long pulse operation [1]. The divertor can be submitted to heat flux deposition in the range foreseen for ITER
(10–20 MW/m²) [1]. Thefirst plasma occurred in WEST at the end of 2016.
IR monitoring was routinely performed is TS since the‘90 s, and with a real time processing since 2005. This allowed plasma campaigns with long and high-power discharges for years. For WEST, the IR monitoring remains a priority to operate the machine safely, and to provide essential data for various physics studies involving high heat flux deposition on PFCs.
1.2. Infrared thermography diagnostics on WEST
The WEST IR thermography system consists of several different di-agnostics which all share the same data processing and acquisition system.
The main machine protection diagnostic, which is the object of this
https://doi.org/10.1016/j.fusengdes.2019.03.090
Received 25 September 2018; Received in revised form 21 January 2019; Accepted 14 March 2019
⁎Corresponding author.
E-mail address:[email protected](X. Courtois).
Available online 21 March 2019
0920-3796/ © 2019 Elsevier B.V. All rights reserved.
paper, is the result of a full refurbishment of the formers IR endoscopes used on TS. It consists of a set of 12 IR cameras mounted on 7 endo-scopes located in the upper ports of the machine and viewing down-ward. It brings a full coverage of the lower divertor, the baffle leading edge and the 5 heating devices: 3 Ion Cyclotron Resonance Heating (ICRH) antennas and 2 Lower Hybrid Current Drive (LHCD) launchers. New diagnostics were also developed for WEST: a wide angle tan-gential view of the inner chamber located in an equatorial port, a very high resolution view focused on the divertor with a 0.1 mm spatial resolution [2], and 2 complementary views of the divertor (direct view through a window) and of a LHCD launcher (tangential view through a fibre bundle).
This paper is focused on the set of 7 upper port endoscopes. The others diagnostics are described in [3].
2. Diagnostic description 2.1. Location and lines of sight
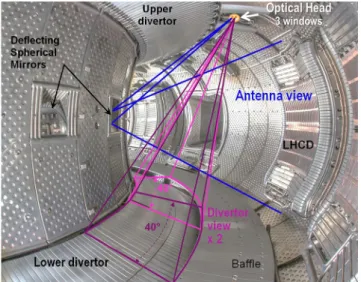
For machine protection, the main diagnostic is the set of 7 upper endoscopes spatially distributed on the machine upper ports, and cov-ering the full lower divertor (with some overlap) plus the 5 heating systems. In that aim, each endoscope has 3 optical lines enabling 2 divertor views and 1 antenna view (Fig. 1).
Previously in TS, the endoscopes were located closer to the inner wall, where the upper divertor is now installed. Consequently the en-doscopes were moved outward, and a direct view of the antennas was no longer possible since it would have led to a very low angle of in-cidence. Thus the endoscopes were spun 180° and the antenna is now viewed through a deflecting mirror located in the inner wall. This had a strong impact on the optical design of the antenna view.
2.2. Project constraints
The major project constraint was to reuse or revamp as much as possible existing parts of the 7 former IR endoscopes which contributed to the success of TS operation for more than 12 years [4]. This challenge concerned only mechanics and optics. All electronic components, i.e. data processing and acquisition system were fully renewed. The fore-most requirements and constraints on the design were the following:
•
Spatial resolution < 10 mm•
Real Time Monitoring: processing time < 100ms•
Wide temperature range up to W melting (3400 °C)•
Match with new machine configuration: new endoscopes location,new sight angles
•
Withstand heat loads during long pulses, i.e. feature actively cooled plasma facing parts2.3. Refurbishment and design description
The refurbishment of TS endoscopes lasted 3 years (2016–2018), including studies, manufacturing and assembling. Some modifications were required on the mechanics, flanges and bodies, to match new machine interfaces. The most important modifications concern the optics and opto-mechanics (Fig. 2). The modification of the optical design was done withZEMAXsoftware, at a wavelength of 3.9μm, si-milarly to the former one, in order to keep as many lenses as possible unchanged. The new optical parameters are given inTable 1:
From bottom to top, the modifications concern: 2.3.1. Deflecting mirror
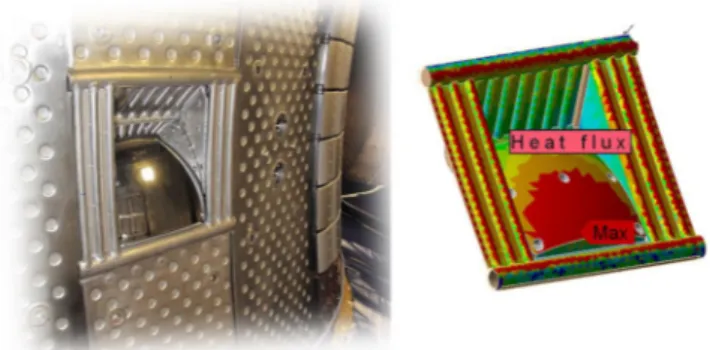
The deflecting mirror is a new component imposed by the endo-scope relocation. It is a 170 x 170 mm bulk molybdenum part, un-coated, with a convex spherical surface (radius of curvature = 250 mm). It was polished by conventional methods, with a roughness of ≈10 nm, and spherical defect < 100 nm RMS.
The advantages of using Mo are a good erosion resistance [5] and a high conductivity ensuring homogeneous temperature and deformation fields. The drawback is a challenging polishing due to the toughness and fragility of the material. The mirror is mounted in a protecting niche, and screwed onto a supporting plate which is cooled by pres-surized waterflow. The maximum heat flux deposition on its surface for the most radiating plasma scenario (130 kW/m2) leads to a maximum
temperature of 200 °C (Fig. 3). At this temperature, the spherical
Fig. 1. upper port endoscopefields of view (FoV) in WEST.
Fig. 2. Upper endoscopes for antennas and divertor views. Left = engineering view, right = optics principle.
Table 1
Main optical parameters.
View FoV Aperture Focale length Divertor 48° F2.4 9.8 mm
Antenna 9 × 12° (on mirror) F3.6 45.7 mm (w/o mirror) X. Courtois, et al. Fusion Engineering and Design 146 (2019) 2015–2020
surface deformation is in the order of the manufacturing tolerances, and the parasitic IR radiation increases the temperature of about +10% for a target @200 °C, and +3% @300 °C (luminance temperature) ; it is then considered acceptable, all the more this only concerns exceptional very high energy plasma scenario.
2.3.2. Optical head
In order to match the new FoVs and sight angles, a new optical head has been designed. A CuCrZr body ensures the protection (Fig. 4) from the incoming heatflux. It is cooled by pressurized water at machine temperature by inner channels to withstand up to 1.3 kW of plasma radiation. An additional front tube provides a shield against the elec-trons losses trapped in the magneticfield ripple propagating upward with a zigzag trajectory (up to 3 kW). It is made of Nickel to offer high thermal conductivity and pressure resistance, while remaining easy to manufacture by bending. The 3 windows have a double sapphire disc: thefirst disc is brazed in a CuCrZr ring which is electron beam welded onto the body, and ensures the tightness. The second disc is held by a screwed washer. It protects the brazed disc in case of pollution, and can be easily replaced or cleaned during maintenance shutdown.
Behind the body is the optical part (Fig. 5). It consistsfirst of 3 Silicone prisms which deviate the optical axis. Then a group of lenses makes thefirst image plane. Materials are ZnSe, Ge or Si for lenses, peek for spacers and Al for mechanical parts. The lenses barrel is screwed and centered onto the prims cage. One divertor module lens is asphe-rical diffractive.
2.3.3. Optical relays
Each image formed by the optical head is propagated along the optical tube by 4 successive optical relays, with 4 lenses per relay, made of Si and Ge. This part is highly constrained by the 110 mm tube dia-meter, which leaves a maximum diameter of 36 mm for the lenses. The optical design effort allowed saving about 80% of the existing lenses, which was valuable given that lenses usually dominate the cost in an optical system. However, the disassembly and reassembly of some un-changed lenses were necessary, due to required modifications of
opto-mechanical pieces, but with a low impact on manufacturing costs. 2.3.4. Optical console
The recombination console dispatches the antenna line on thefirst camera, and gathers the 2 divertor lines on the second camera, thanks to a set offlat gold coated silica mirrors. These mirrors also enable the differential focus adjustments. All the existing mirrors were degraded and have been replaced identically. However, the mechanical mounting of the mirror was significantly modified to adapt to the new sight an-gles.
2.3.5. Camera
12 homemade IR cameras based on InSb detectors were developed for this diagnostic (Fig. 6). These cameras are describes in [3] 3. Temperature calculation and monitoring
3.1. Principle
The temperature calculation procedure is similar to that used for TS [7], with the mirror as new component. It is performed in real time by a FPGA board (§3.2). It takes into account the laboratory camera cali-bration, and the transmission loss of all the optical lines. For this pur-pose, the optical system is divided in 3 independent parts, which are considered at different temperature: the mirror (for antenna view) @ 90 °C, the optical head window @90 °C, and the optical relays and console @20 °C. The camera lens and thefilter are taken into account in the camera calibration. The following calculation is performed in lu-minance: for each above mentioned optical part, starting by the top of the system (camera side), the parasitic signal radiated by the optical part (stray light) at its given temperature is subtracted to the luminance signal measured by the camera, and the transmission loss is then ap-plied (i.e. the signal is divided by the transmission coefficient). The next optical part is calculated afterward. At the end, the estimated radiation luminance on the component is obtained and converted in temperature using the camera calibration curves.
Fig. 3. Left: Mirror mounted in the inner wall of WEST - Right: calculated heat flux deposition pattern from plasma radiation (max = 130 kW/m2).
Fig. 4. picture of the optical head. Left = the body from inner vacuum vessel, Right = front optics behind the body.
Fig. 5. Divertorfirst optical module: prims and lenses (white spots), spacers (gray spots) and mechanical assembling parts (black spots).
Thanks to this method, cameras or optical relay tubes can be re-placed or switched without recalibration of the full optical line since the calculation takes into account these parts individually. This method also gives practical advantages speaking calibration procedure (§4.1). 3.2. Temperature monitoring
The data architecture of the diagnostic is described in [3] and the data handling is resumed in (Fig. 7).
The maximum temperature in each predefined Region Of Interest (ROI) of the monitored components surface is passed via a fast network, to the Plasma Control System, which reduces the injected power when a temperature approaches the temperature threshold [6]. In case of overheating, a hard outputflag is emitted to the interlock system which causes a soft plasma landing.
It is obvious that emissivity is a key parameter for IR temperature measurement. This parameter is a complex issue since emissivity may vary with temperature, surface roughness, material ageing and in-cidence angle. As a consequence, regarding real time machine protec-tion, the temperature considered is always the luminance temperature, i.e. with emissivity = 1. The temperature threshold applied in each ROI of the monitored components is the maximum acceptable temperature converted in luminance temperature. For a safe monitoring, the lumi-nance temperature threshold is estimated with the lowest know emis-sivity of materials, which is initially determined either from biblio-graphy, material test bed or experience. For example, the threshold is set at 600 °C for SS parts which corresponds to an utmost acceptable temperature of 1000 °C for a 0.3 emissivity.
For post pulse analysis, emissivity < 1 can be applied on the IR data. Pre and post pulse analysis tools and detailed simulations are developed in parallel to better analyse and understand the impact of variable emissivity and reflections on measured temperature [8,9]. 4. Laboratory characterization
4.1. Calibrations and optical transmissions
All calibrations and optical transmissions are measured in labora-tory at room temperature for each endoscope, using black bodies (BB), with similar the procedure as used for the former TS diagnostic [10]. The camera and its lens are calibrated separately, with a small BB featuring reference temperature up to 1600 °C. Extrapolation is per-formed for higher temperatures, after taking into account the trans-mission calculation (§3.1), thanks to a good linearity of the detector. A dedicated test bed reproduces the machine configuration with divertor and antenna mock-ups and serves to tune the focus of the overall optical line, and adjust the mirrors for the correct recombination of the 2 di-vertor lines.
A large BB covering the wide FoV of the divertor view is only ne-cessary for transmission measurement at mid-temperature (< 400 °C). The total measured transmission coefficient in the field centre was measured at about 0.4 for the divertor view, and 0.3 for the antenna view, plus 0.76 for the double sapphires window.
The impact of in-situ operating temperature on signal is dealt by computations taking into account transmission coefficients and tem-perature of front-end optics (90 °C–120 °C for sapphire windows). Such temperature calculation and calibration methods make possible the calibration at laboratory room temperature. A post verification of the calibration process on the whole system discloses an overall accuracy of about ± 25 °C.
4.2. Optical performances
The optical performances can be expressed in different ways which are given here after. The optical performances are summarised in Table 2.
4.2.1. Pixel resolution
The pixel resolution is the projection of a pixel size in the object plane. It varies significantly for the divertor, due to the inclination of the line of sight from 2.3–5.6 mm/pixel. For antennas, values rank from 3.9 to 4.4 mm/pixel.
4.2.2. Imaging spatial resolution
The modulation transfer function (MTF) is a conventional method to characterize the response of an optical system, and gives the imaging spatial resolution.
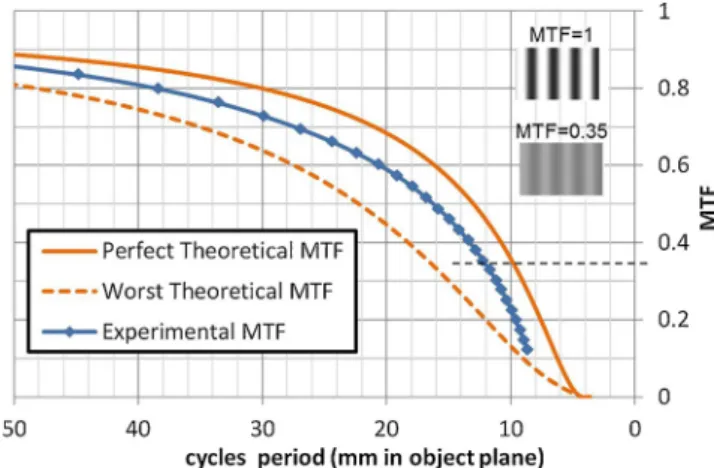
The measured MTF is compared to the theoretical MTF which is the product of the optical MTF computed byZEMAXand the MTF of the pixel size. The measured MTF (Fig. 8) is between the perfect case (all the lenses are perfectly machined and mounted) and the worst expected case (case for which the probability to have a bad combination of the tolerances, within those allocated for manufacturing and mounting, is less than 10%), which is a satisfying result. The lowest acceptable imaging resolution is commonly done for 35% MTF, given inTable 2. Fig. 7. data handling architecture.
Table 2
Optical performances measured in lab. Note: vertical slit give horizontal re-solution, and reciprocally.
Resolution (mm) Pixel projection * MTF 35% SRF 80% Divertor Vert. 2.7 9.4 5.4 Antenna Vert. 4.3 12.0 7.6 Antenna Horiz. 3.9 10.4 6.1
* at MTF and SRF measurement location onFigs. 10 and 11.
Fig. 8. Antenna view MTF for horizontal slit. A cycle is a black/white lines alternation (example: MTF = 1 and 0.35).
X. Courtois, et al. Fusion Engineering and Design 146 (2019) 2015–2020
4.2.3. Quantitative spatial resolution
The MTF is inadequate to qualify thermal measurement perfor-mances; thus the Slit Response Function (SRF) was measured to quan-tify thermal spatial resolution (Fig. 9). This method allows determining the correction to be applied to the measurement of small objects which are spatially under-resolved. This is the case for example for the gaps between divertor targets, or thin plates between LHCD antenna wave guides.
For the divertor view, the horizontal and vertical directions (re-garding the image aspect) are equal, which is not the case for the an-tenna view due to the deflecting mirror inclination. The SRF is given in Table 1 for 80% of luminance modulation which corresponds to a measurement error of 10% @1000 °C, for a 3.9μm wavelength. This result is consistent with the theoretical SRF extracted fromZEMAXwith an accuracy of less than 10% for antenna view, and≈40% for divertor view. The latter is probably the result of a defocus due to an imperfect adjustment of console mirrors.
These results are in line with the project requirements. 4.2.4. Minimum measurable temperature
The minimum measurable level is determined for a level sig-nificantly higher than the background noise, typically 100 Digital Level. This level is approximately 150 °C for the divertor view and 200 °C for the antenna view. Images can be observed under these thresholds, but the temperature measurement is not reliable, i.e. the uncertainty in-creases significantly due to stray light and uncertainties due to cali-bration.
5. Plasma operation andfirst results
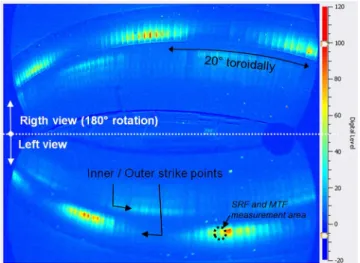
The system was under operation early 2018, with 2 endoscopes providing 2 antenna views and 4 divertor views; it is planned to be fully installed mid-2019. The figure Fig. 10 shows 2 divertor views re-combined on one detector. They are in good qualitative agreement with simulations of heat load deposition on the WEST divertor using the PFCflux code [11]. The periodic pattern corresponding to WEST mag-neticfield ripple (1 toroidal coil per 20° [12]) is clearly visible.
ThefigureFig. 11presents an IR image of an ICRH launcher during a disruption. The IR signal mainly comes from the wide spectrum plasma radiation reflecting on the metallic surfaces.
6. Conclusion
The IR system for WEST is a set of diagnostics dedicated to PFCs protection and machine operation, but it is also an essential support to physics investigations.
Seven endoscopes located in upper ports viewing the whole lower divertor and the 5 heating systems have been upgraded and manu-factured. Their optical performances are in line with project and design requirements. The endoscopes are progressively installed on WEST. The
total renewing of the cameras and of the data processing and acquisi-tion system is achieved and gives satisfying results in operaacquisi-tion.
Some upgrades are foreseen
•
Manufacturing new camera lenses for divertor view to enhance the resolution•
Developpment of an embedded black body on WEST articulated inspection arm for in-situ calibration under vacuum and tempera-ture conditions.•
Improvement of temperature calculation by measuring auto-matically thefirst optics temperature during pulses.•
Development of an inovative machine protection software to opti-mise the safe operationnal domain.Acknowledgments
This work has been carried out within the framework of the EUROfusion Consortium and has received funding from the Euratom research and training programme 2014-2018 under grant agreement No633053. The views and opinions expressed herein do not necessarily reflect those of the European Commission.
Fig. 9. Slit Response Function: luminance of a variable width slit which is il-luminated from behind.
Fig. 10. Port 6 divertor IR image during pulse #53,223 (LH + IC power = 2 + 0,6 MW Ip = 500 kW). Color scale is the luminance in arbitrary unit.
Fig. 11. Port 2 ICRH antenna IR image during pulse #53,132 on plasma dis-ruption. Color scale is in arbitrary unit.
References
[1] J. Bucalossi, et al., Fusion Eng. Des. 89 (2014) 907–912.
[2] M. Houry, et al., To be published in SOFT-30thconference proceeding, Fusion Eng. Des. (2019).
[3] X. Courtois, et al., Fusion Eng. Des. 136 B (2018) 1499–1504. [4] D. Guilhem, et al., Fusion Eng. Des. 74 (2005) 879–883. [5] B. Eren, et al., J. Nucl. Mater. 438 (SUPPL) (2013) S852–S855.
[6] P. Moreau, et al., Fusion Eng. Des. 82 (2007) 1030–1035. [7] D. Guilhem, et al., QIRT J. 2 (2005) 77–96.
[8] M.H. Aumeunier, et al., Rev. Sci. Instrum. 81 (2010) 10E524. [9] M.H. Aumeunier, et al., Nucl. Mater. Energy 12 (2017) 1265–1269.
[10] C. Desgranges, et al., Nuclear. Ints. & Methods in Physics Research, A 879 (2018) 121–133.
[11] M. Firdaouss, et al., Fusion Eng. Des. 98-99 (2015) 1294–1298. [12] R. Mitteau, et al., Fusion Sci. Technol. 56 (3) (2009) 1353–1365.
X. Courtois, et al. Fusion Engineering and Design 146 (2019) 2015–2020