HAL Id: hal-01203276
https://hal-mines-paristech.archives-ouvertes.fr/hal-01203276
Submitted on 22 Sep 2015HAL is a multi-disciplinary open access archive for the deposit and dissemination of sci-entific research documents, whether they are pub-lished or not. The documents may come from teaching and research institutions in France or abroad, or from public or private research centers.
L’archive ouverte pluridisciplinaire HAL, est destinée au dépôt et à la diffusion de documents scientifiques de niveau recherche, publiés ou non, émanant des établissements d’enseignement et de recherche français ou étrangers, des laboratoires publics ou privés.
Charbel Moussa, Marc Bernacki, Rémy Besnard, Nathalie Bozzolo
To cite this version:
Charbel Moussa, Marc Bernacki, Rémy Besnard, Nathalie Bozzolo. About quantitative EBSD analysis of deformation and recovery substructures in pure Tantalum. 36th Riso International Symposium on Materials Science, Sep 2015, Riso, Denmark. pp.012038, �10.1088/1757-899X/89/1/012038�. �hal-01203276�
About quantitative EBSD analysis of deformation and
recovery substructures in pure Tantalum
C Moussa1, M Bernacki1, R Besnard2 and N Bozzolo1 1
MINES ParisTech, PSL - Research University, CEMEF - Centre de mise en forme des matériaux, CNRS UMR 7635, CS 10207 rue Claude Daunesse 06904 Sophia Antipolis Cedex, France.
2
CEA DAM Valduc, F-21120 Is-sur-Tille E-mail: charbel.moussa@mines-paristech.fr
Abstract. The aim of this work is to present a quantitative analysis of features involved in
recovery during annealing of deformed Tantalum. In pure metals where crystalline defects usually have high mobility, dislocation annihilation and rearrangement occur to a great extent prior to recrystallization. Therefore a complete understanding of recrystallization cannot be accomplished without an advanced knowledge of the recovery phenomenon. Depending on whether dislocations induce a measurable curvature in the crystal lattice or not, they are called Geometrically Necessary Dislocations (GNDs) or Statistically Stored Dislocations (SSDs) respectively. In the present work only GNDs are considered. For this purpose electron backscatter diffraction (EBSD) is an advantageous technique to obtain statistically representative results when compared to Transmission Electron Microscopy (TEM). However, a quantitative analysis of GNDs from EBSD data is not straightforward. Since local misorientations are induced by the curvature of the crystal lattice caused by GNDs, GNDs analysis can be done using local misorientations. However the values obtained from this analysis are step size dependent and influenced by the measurement noise. Reasoning on the basis that when the step size tends to zero, local misorientation should also tend to zero, measurement noise can be estimated [1]. The measurement noise appears to notably be very much dependent on the amplitude of local misorientations, which must be considered in the perspective of GND density calculation.
1. Introduction
When a crystalline material undergoes a plastic deformation, the crystalline lattice rearranges itself to compensate the geometric changes in the material, which in most cases introduces line defects called dislocations. Plastic deformation of a polycrystal may appear homogenous at a macroscopic scale but can be very inhomogeneous when comparing two different grains [2] and even inside one grain [3].
The free energy of a crystalline material increases by the presence of dislocations [4] and therefore, dislocations do not only play a major role in plastic deformation but also in recovery and recrystallization phenomena. Knowledge of the density and distribution of dislocations is then necessary for the understanding of many physical mechanisms. Several methods allow for observing dislocations. A good review of these methods is presented in the book entitled “introduction to dislocations” [5], Transmission Electron Microscopy (TEM) and X-Ray diffraction are the most used. The major drawback of TEM methods is their local nature; they may lead to relatively high accuracy
results but with only poor statistical relevance because they work at the nanoscale and the microscale. This can be a major issue since, at the polycrystal scale, deformation and dislocations distribution are inhomogeneous. With X-ray diffraction methods, dislocation densities are indirectly estimated from the shape of the diffraction peaks based on models, and their topological distribution can not be assessed.
Dislocations can be separated into two families, Geometrically Necessary Dislocations (GNDs) and Statistically Stored Dislocations (SSDs). When plastic deformation occurs, some dislocations allow for accommodating the lattice curvature [6,7] which develops as a result of non-uniform strain at the crystal scale, those are called GNDs by Ashby [8,9]. The SSDs are on the contrary dislocations with no cumulative effect on the crystal lattice curvature. From a practical point of view, the lattice curvature corresponds to the measurable local intragranular misorientation. It is worth pointing out that the accuracy of the orientation measurement and the spatial resolution have thus a direct influence on the discrimination between GNDs and SSDs.
The present study is a preliminary step before investigating static recovery during the annealing of a cold deformed Tantalum. As a BCC material, Tantalum exhibits a total of 48 slip systems: 12 {110} planes, 12 {112} planes and 24 {123} planes with <111> slip directions and a Burger vector magnitude b=2.8610-10m. In pure metals where crystalline defects usually have high mobility,
dislocation annihilation and rearrangement occur to a great extent prior to recrystallization. Tantalum has a relatively high stacking fault energy, 220 mJ.m-2 [10], and recovery phenomena occur before recrystallization. Therefore a complete understanding of recrystallization cannot be accomplished without an advanced knowledge of the recovery phenomenon. For this purpose it is necessary to describe the dislocation substructures in the plastically deformed material and their evolution during subsequent annealing. In the present study, Electron BackScatter Diffraction (EBSD) technique is used to estimate the GNDs density and distribution.
2. Estimating GND density from EBSD data
The EBSD technique has been automated and intensively developed during the two last decades in terms of indexing speed and accuracy [11]. Local misorientations are induced both by the curvature of the crystal lattice associated with GNDs and by the effect of the elastic strain field. Since the effect of the elastic field is much smaller than the lattice rotation [12], one can assume that it is negligible and therefore the lattice curvature can be related to the presence of GNDs only. EBSD is an advantageous technique to estimate GND density based on the analysis of intragranular misorientations. A quantitative analysis of GNDs from EBSD data can be done with two main approaches.
The first approach is based on the calculation of the dislocation density tensor proposed by Nye [6]. From EBSD data obtained from a 2D section of the microstructure, it is possible to calculate directly three components of the Nye’s tensor and to estimate two other components [13]. The four remaining components that are not experimentally accessible can then be estimated by minimizing the overall dislocation density [13–17]. The main drawback of this method is that multiple solutions can be found and the minimization of the total dislocation density to estimate the full Nye’s tensor may be time consuming.
The second approach is simpler, based on the estimation of the GND density from the misorientation angle between measuring points located at a given distance x from each other. Based on the strain gradient model proposed by Gao et al. [18], Kubin and Mortensen [19] considered the case of a simple torsion and related the misorientation angle θ to GND density with the following equation:
(1)
where x is unit length and α is constant equal to 2 in the considered case. This formulation was also proposed by Liu et al. [20] with α equals 2 for a pure tilt boundary or 4 for a pure twist boundary (since a tilt misorientation can be accommodated by one set of edge dislocations while two sets of
screw dislocations are necessary for a twist configuration). It is worth mentioning here that since the α parameter is used for estimating a 3D value (GND density) from a 2D data set (EBSD map), it implicitly encompasses also topological assumptions. The Kernel Average Misorientation (KAM), which is easily obtained from EBSD data, is the average misorientation angle of a given point with all its neighbors. KAM is generally used for the misorientation angle value θ in equation (1), it must then be calculated with a fixed neighbor distance, and not including all points of the kernel.
Comparisons between results obtained with the two approaches can be found in the literature, and results obtained with the second approach tend to slightly underestimate the results obtained with the first approach [21,22]. However, the second approach gives a more even distribution of GNDs [21]. This may be explained by the better statistics associated with the second approach. In fact, the maximum number of orientation gradients used to determine Nye’s tensor are 3 as for KAM it is calculated as the average misorientation of 4 to 16 values depending on the choice of the neighboring regions [21].
The major drawback of estimating GND density from EBSD data is that the 3D information is calculated from a 2D measurements. However, comparing between EBSD 2D and 3D, Calcagnotto et
al. [21] reported that GND estimation from EBSD 2D data is a reasonably reliable method. A second
drawback is that the results are step size dependent and can sometimes be on the order of magnitude than the measurement noise. The measurement noise is closely linked to the quality of the Kikuchi patterns from which the orientation is determined. Among the most obvious factors controlling that quality, the material itself, the crystal orientation and misorientations, the quality of the sample surface preparation can be listed. EBSD acquisition settings also condition the pattern quality and the accuracy of the Kikuchi band detection: e.g. integration time, number of frames per point, resolution of the Kikuchi pattern image and resolution of the Hough space. The step size and the measurement noise influence are treated in the present study, for fixed acquisition settings.
3. Material, EBSD acquisition stings and data processing details
The studied material is a high purity Tantalum. Two samples were used. The first one, “Tantalum a”, was submitted to a compression test at room temperature up to a strain of 36% and then annealed at 900°C for 2 hours. The second one, “Tantalum b”, was cold-rolled to 92% reduction. The samples surfaces were prepared by standard mechanical polishing with 800, 1200, 2400 and 4000 grit SiC paper. Mechanical – chemical polishing was done using a colloidal silica solution with an average diameter of silica particles of 20 nm. Finally, vibration polishing for 2 hours was done using the same solution. EBSD maps were acquired using a QUANTAX EBSD system from the Bruker company (with a e-FlashHR EBSD detector controlled by the ESPRIT software package), mounted on a Zeiss Supra40 FEG SEM operated at 20 keV.
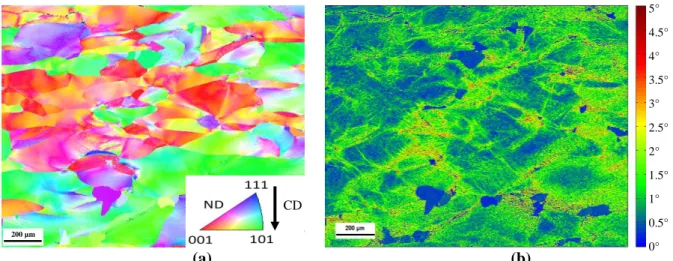
The EBSD map of figure 1 (a) was obtained on “Tantalum a” with a step size of 1.44µm and an indexing rate of 98%. It reveals a recovered and partially recrystallized microstructure. KAM can be calculated using the first, the second …order neighbors. For the calculation of KAM only neighboring pixels with a misorientation angle lower than a threshold are considered in the calculation in order not to include misorientations due to grain boundaries. KAM with a 5° threshold angle is presented in figure 1(b). KAM is a good indicator of the local misorientation and, hence, of GND density. Even though the θ value of equation (1) is divided by the unit length, the choice of the kernel radius may have a big influence on the calculated GND density, depending on the characteristic length of the intragranular substructures. For quantitative GND analysis, a kernel size should be chosen even though that choice can hardly be a priori justified.
(a) (b)
Figure 1. (a) Orientation color-coded EBSD map of a partially recrystallized Tantalum (normal direction to the analyzed section projected onto the standard triangle) and (b) kernel average misorientation to the 1st neighbor with 5° threshold angle.
Kamaya [1] proposed an interesting method for estimating the measurement noise. If the measurement noise is zero, local misorientation is only induced by the orientation gradient. The local misorientation should then tend to zero when the step size tends to zero. Using the EBSD data presented in figure 1(a), the average KAM values of all measurement points are calculated for the first five neighbors and presented as a function of the absolute kernel radius value in figure 2.
Figure 2. Average KAM as a function of the kernel radius (first to fifth neighbors).
The variation of the average KAM values with the kernel radius is linear and intersects the axis at 0.89° which is different from zero. This value can be considered as an estimate of the average measurement noise. For a fully recrystallized pure Tantalum sample, this value was determined to be about 0.5° under the same EBSD acquisition settings, which is fully consistent with the classical value for the EBSD angular resolution. It is worth mentioning that the variation of θ with x is not always linear. It is linear if the orientation gradient is regular at the kernel length scale. If dislocations form substructures that are smaller than the maximal considered kernel radius, then the KAM value may vary non-evenly with x. The slope of the linear evolution is the misorientation per unit length ⁄ and can be used in equation (1) to replace θ/x. Thus no assumption is required for choosing the considered neighborhood range. Even more, Kamaya [1] demonstrated that ⁄ is not affected by the step size of the EBSD map. The observation made in figure 2 is also valid on a local basis for each
5° 4.5° 4° 3.5° 3° 2.5° 2° 1.5° 1° 0.5° 0° 200 µm CD 4
measurement point. Using equation (1) with α=2, the GND density can be estimated, as an average value for the whole map, or as values associated to each individual pixel to build a GND density map. 4. Estimation of the GND density with removal of the measurement noise contribution
The measurement noise and GND density maps are presented in figure 3 (a) and (b) respectively. The minimal values of the measurement noise and GND density correspond to the few recrystallized grains (some arrowed on figure 3), as expected since the measurement noise is drastically affected by the crystalline lattice distortions, minimal in recrystallized grains. As it can be seen in Figure 3 (a) the measurement noise can go up to several degrees where the crystalline lattice is highly distorted.
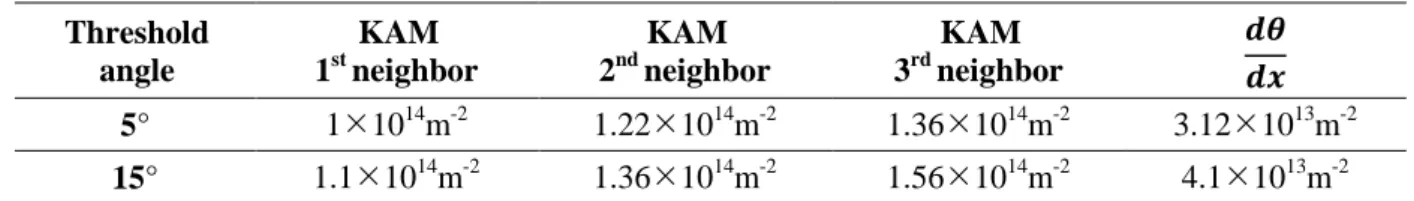
The average GND densities calculated using eq. (1) with α=2 and KAM (considering the first, second or third neighbors) or using Kamaya's method are presented in table 1. From these values, the influence of the choice of the kernel radius without applying Kamaya's method is obvious. On the other hand, the result obtained with Kamaya's method is smaller than the one calculated with KAM. This difference is mainly due to the measurement noise that leads to overestimating GND densities if not considered, and this is especially true when the crystal lattice is highly distorted due to a high GND density. The threshold angle has also an influence on the GND density as presented in table 1. This parameter should be chosen carefully, in our case with 15° exclusion angle some grain boundaries was accounted for intragranular misorientation which tends to increase GND density.
(a) (b)
Figure 3. (a) measurement noise and (b) GND density maps. Table 1. GND densities calculated using either KAM or Kamaya's method. Threshold angle KAM 1st neighbor KAM 2nd neighbor KAM 3rd neighbor 5° 11014m-2 1.221014m-2 1.361014m-2 3.121013m-2 15° 1.11014m-2 1.361014m-2 1.561014m-2 4.11013m-2
Hall-Petch analysis on an annealed Tantalum was done by Stüwe et al. [23]. The authors reported a critical dislocation density for spontaneous nucleation of 31014 m-2. In figure 3 (b) we can see that the maximal GND densities are around 1.51014 m-2 which is in the same order of magnitude of the critical value reported by Stüwe et al..
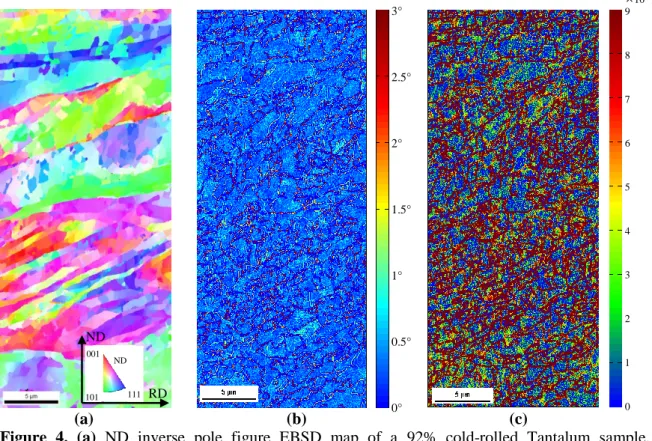
In order to verify the ability of Kamaya’s method to characterize the GND cell structures, it is applied on “Tatalum b”. An EBSD map was acquired with a step size of 38 nm and an indexing rate of 99%, see figure 4 (a). The corresponding measurement noise and estimated GND density are presented in figure 4 (b) and (c) respectively. The threshold angle was set to 15° in this case because of the highly disoriented cell structures that should be considered as intragranular. The cell structures can be 1013m-2 15 10 5 0 3° 2.5° 2° 1.5° 1° 0.5° 0°
clearly observed in figure 4 (b) and (c). The cell walls are regions with a high disorientation and high GND density, see figure 4 (c). Consistently, the cell walls are the regions with the highest measurement noise, see figure 4 (b). From figure 4 (c) one can see that the shape and size of cell structures is non-homogenous and depends on the grain orientation, as a result of crystal plasticity anisotropy. Once again we can see that the measurement noise can locally be much higher than the classical value of 0.5° for EBSD angular resolution and should be considered for a better accuracy of GND density estimation. A great advantage of Kamaya’s method is that the measurement noise is estimated locally for each measurement point and not assumed to be uniform over the whole EBSD map.
(a) (b) (c)
Figure 4. (a) ND inverse pole figure EBSD map of a 92% cold-rolled Tantalum sample, (b) measurement noise and (c) GND density maps
5. Conclusions
The present work evaluates the advantage of applying Kamaya's method for estimating GND densities from EBSD maps, in the frame of a further research work dedicated to recovery in pure Tantalum. This method is independent on step size and avoids the contribution of the measurement noise to be taken into account in the GND density calculation. The quantification of the GND density remains dependent on the choice of the factor α in equation (1), which corresponds to an assumption on the dislocation types. Nevertheless, the estimated values of critical dislocation density for nucleation of recrystallized grains in Tantalum are in good agreement with those reported in the literature.
References
[1] Kamaya M 2011 Ultramicroscopy 111 1189
[2] Sun S, Adams B L and King W E 2000 Phil. Mag. A 80 9
[3] Schwarts A J et al 1999 Journal of Engineering Materials and Technology 121 178
[4] Humphreys F J and Hatherly M 2004 Recrystallization and Related Annealing Phenomena Elsevier Ltd (second edition) chapter 6 p 169
[5] Hull D and Bacon D J 2001 Introduction to dislocations ed BH (fourth edition) chapter 2 p 22
3° 2.5° 2° 1.5° 1° 0.5° 0° 1014m-2 9 8 7 6 5 4 3 2 1 0 ND RD 101 001 111 ND 6
[6] Nye J F 1953 Acta Metall. 1 153
[7] Kröner E 1958 Kontinuumstheorie der Versetzungen und Eigenspannungen (Berlin: Springer) [8] Ashby M F 1970 Phil. Mag. 21 399
[9] Gao H Huang Y 2003 Scripta Mater. 48 113 [10] Pegel B 1968 Physica Status Solidi (b) 28 603 [11] Dingley D 2004 Journal of Microscopy 213 214
[12] Wilkinson A J and Randman D 2010 Phil. Mag. 90 1159 [13] Pantleon W 2008 Scripta Mater. 58 994
[14] Beausir B and Fressengeas C 2013 Int. J. Solids Struct. W 2008 Scripta Mater. 50 137 [15] Demir E, Raabe D, Zaafarani N and Zaefferer S 2013 Acta Mater. 57 559
[16] Field D P, Merriman C C, Allain-Bonasso N and Wagner F 2012 Modelling Simul. Mater. Sci.
Eng. 20 024007
[17] Ruggles T J and Fullwood D T 2013 Ultramicroscopy 133 8
[18] Gao H, Huang Y, Nix W D, and Hutchinson J W 1999 J. Mech. Phys. Solids 47 1239 [19] Kubin L and Mortensen A 2003 Scripta Mater. 48 119
[20] Liu Q, Juul Jensen D, Hansen N 1998 Acta Mater. 46 5819
[21] Calcagnotto M, Ponge D, Demir E and Raabe D 2010 Mater. Sci. Eng. A 527 2738 [22] Jiang J, Britton T B and Wilkinson A J 2013 Ultramicroscopy 125 1