HAL Id: tel-02187996
https://tel.archives-ouvertes.fr/tel-02187996
Submitted on 18 Jul 2019
HAL is a multi-disciplinary open access archive for the deposit and dissemination of sci-entific research documents, whether they are pub-lished or not. The documents may come from teaching and research institutions in France or abroad, or from public or private research centers.
L’archive ouverte pluridisciplinaire HAL, est destinée au dépôt et à la diffusion de documents scientifiques de niveau recherche, publiés ou non, émanant des établissements d’enseignement et de recherche français ou étrangers, des laboratoires publics ou privés.
regions in Ukraine
Svitlana Poniakina
To cite this version:
Svitlana Poniakina. Causes and evolution of mortality disparities accross regions in Ukraine. Sociol-ogy. Université Panthéon-Sorbonne - Paris I, 2014. English. �NNT : 2014PA010663�. �tel-02187996�
UNIVERSITE PARIS I – PANTHÉON SORBONNE École Doctorale de Géographie
T H È S E
pour obtenir le grade de
DOCTEUR DE L’UNIVERSITE PARIS I - PANTHÉON SORBONNE Discipline : démographie
Présentée et soutenue publiquement par
Svitlana PONIAKINA
5 décembre 2014
CAUSES ET ÉVOLUTION DES DISPARITÉS RÉGIONALES DE
MORTALITÉ EN UKRAINE
Sous la direction de :
Alexandre AVDEEV et France MESLÉ
JURY :
Directeur de thèse : Prof. Alexandre AVDEEV,
Professeur à l’Institut de démographie de l’Université de Paris 1- Panthéon Sorbonne (IDUP)Co-directeur : Dr. France MESLÉ,
MD, MSc, Directrice de recherche, Institut national d’études démographiquesProf. Ella LIBANOVA (rapporteur) : - Membre de l’Académie des sciences de l’Ukraine, Directrice de l’Instit de démographie et d’études sociales de l’Académie Nationale des Sciences de l’Ukraine
Dr. Jacques VALLIN (rapporteur) : Directeur de recherche émérite, Institut national d’études démographiques
Dr. Vladimir SHKOLNIKOV : Directeur de Data Laboratoire, Institut Max Planck pour les études démographiques
Dr. Stéphane RICAN : Maître de conférences, Université Paris Ouest Nanterre la Défense, Département de Géographie
CAUSES AND EVOLUTION OF MORTALITY DISPARITIES ACROSS
REGIONS IN UKRAINE
Abstract
The aim of this study was to investigate regional mortality differences in Ukraine, cause-of-death patterns and trends at different spatial scales.
First of all, general contrasts were established: for males between the west and east of Ukraine, while for females between the west and south-east. Study of regional disparities in respect of different age groups revealed that regions that succeeded the most are those characterized by decreased mortality at older ages.
As for big cities, for the most of cases of death (except cancer and infectious diseases) living in a big metropolis is an advantage to surviving. The special case of the city of Slavutych that suffered the most from Chernobyl accident was studied.
Second, special attention was given to regional patterns of mortality for different medical cause of death, and which showed that Ukrainian regions are at different stages in the fight against man-made and degenerative diseases.
Lastly, peculiarities of dynamics over last two decades were investigated. During this period life expectancy has experienced a sharp decrease, followed by stagnation, and recovery. This evolution was accompanied by transformation of regional cause-specific mortality patterns.
These changes, larger and smaller, were not actually accounted for by public authorities and no important breakthroughs happened in any Ukraine region. There were no efficient strategies, measures or reforms implemented that would allow substantial improvements in the health of the population.
Key words: mortality analysis, spatial analysis, regional differences, lifespan disparity, causes of death, Eastern Europe, Ukraine, post-Soviet countries.
Résumé
L’objectif de cette étude était d'étudier les différences de mortalité régionales en Ukraine, les structures par causes de décès et les tendances à différentes échelles spatiales.
Tout d'abord, des contrastes géographiques nets ont été mis en évidence : pour les hommes, entre l'ouest et l'est de l'Ukraine, et pour les femmes - entre l'ouest et le sud-est. L’étude des disparités régionales en fonction de l’âge révèle que les régions les plus avancées sont caractérisées par une diminution de la mortalité chez les personnes les plus âgées.
Dans les grandes villes, pour la plupart des causes de décès (à l'exception du cancer et des maladies infectieuses) vivre dans une grande métropole est un avantage pour survivre. Le cas de la ville de Slavoutytch qui avait particulièrement souffert de l'accident de Tchernobyl a fait l’objet d’une analyse spécifique.
Deuxièmement, une attention particulière a été portée aux schémas régionaux de mortalité par causes médicales de décès et a montré que les régions ukrainiennes se trouvent à différents stades de la lutte contre les maladies dégénératives.
Enfin, les particularités de la dynamique de deux dernières décennies ont été étudiées. Pendant cette période l'espérance de vie a connu une forte baisse, suivie d’une stagnation, puis d’un début de reprise. Ces évolutions se sont accompagnées d’une transformation des schémas régionaux de mortalité par cause.
Ces changements, qu’ils soient majeurs ou plus modestes n’ont pas été réellement identifiés par les pouvoirs publics et aucune avancée sanitaire décisive ne s’est produite dans aucune des régions de l'Ukraine. Il n'y a eu ni stratégies, ni mesures ou réformes efficaces mises en œuvre pour permettre une amélioration substantielle de la santé de la population.
Mots clés : analyse spatiale, différences régionales, disparité de durée de vie, causes de décès, Europe de l'Est, Ukraine, les pays post-soviétiques.
Acknowledgments
This research was realized at the Institut national d’études démographiques in the research unit “Mortalité-Santé-Epidémiologie”. The financial support provided by the Institute, together with remarkable academic and social environment provided by my colleagues, was the key factors in the successful completion of this thesis.
It is impossible to express enough my deepest gratitude to my supervisor, France Meslé, for giving me a chance to come to France to do my PhD project. I am very grateful to her for giving me continuous support, for her guidance throughout the thesis, careful numerous revising of chapters, wise advises, unmistakable intuition in resolving problems, inexhaustible knowledge, which she was willingly sharing with me. It was an immense honor to work with her and it was an unmerited chance to profit from her amicable concern with my daily matters.
I would like to express my sincere thankfulness to the director of my thesis, Alexandre Avdeev, for his deep knowledge, rich experience, and devotion to the science. His enthusiastic ideas helped to develop my research and to look at problems from different angles. I very much appreciate rigorous strict approach to performing tasks of my directors and their competent influence on my coming into being a demographer.
I express my gratitude to the reviewers of my thesis manuscript, Jacques Vallin and Ella Libanova, for their thoughtful reading and detailed comments. I also would like to thank the members of Jury, Vladimir Shkolnikov and Stéphane Rican, for their acceptance to examine the results of my PhD thesis. I do appreciate the efforts of those who sacrified their time, and who travelled in order to come to my defense.
I would like to take an opportunity and to thanks to colleagues from the Institute of Demography and Social Studies in Kyiv, from where I started my path, and which opened me the door to studies abroad. The responsiveness of Ukrainian colleagues for the need of data and materials was priceless, especially of Natalia Levchuk, Pavlo Shevchuk, Oleksandre Gladun and Omelian Rudnitskii.
Over the last years I had a privilege and a pleasure to enrich my knowledge at the Max Planck Institute for Demographic Research and I thank every member of the Laboratory of Demographic Data.
I would like to extend my appreciation to my colleagues and friends from INED and UR5. I admire Heads of our research unit: Myriam Khlat, Emmanuelle Cambois, Sophie le Cœur, and Aline Désesquelles. I thank to Markéta Pechholdová, Geraldine Duthé, Giancarlo Camarda,
Nadine Ouellette, Bénédicte Garnier, Meoin Hagege, and etc. for their cooperation; to all the doctorants of INED and students of the European Doctoral School of Demography for their friendship, to the INED administration, library staff and IT group for their professionalism.
Finally, I would like to thank to my family of Poniakin and Dudka for their faithful support and patience, and especially to my dear husband Andrii, and my hardworking and wise mother Maria, who taught me to love knowledge.
Content:
List of abbreviations: ... ix
List of tables: ... x
List of figures: ... xii
Introduction ... 1
Chapter 1. Justification of the study ... 5
1.1
Historical and geographical context ... 5
1.2
Peculiarities of the economic and political situation ... 8
1.3
Peculiarities of the health care system ... 9
1.4
Peculiarities of the demographic situation ... 10
1.4.1
General trends ... 10
1.4.2
Age structure...12
1.4.3
Fertility ... 14
1.4.4
Migration... 15
1.5
Mortality patterns and justification for a study ... 17
1.6
Research framework ... 24
Conclusions ... 25
Chapter 2. Literature review ... 27
2.1
Historical perspective ... 27
2.2
General trends after WW2...30
2.3
Recent studies on interregional trends ... 33
2.4
Similar studies in Europe ... 37
Conclusions ... 39
Chapter 3. Data and its assessment... 41
3.1
Arrangement of territorial division ... 41
3.2
Data sources, availability and quality ... 47
3.2.1
Population number ... 47
3.2.2
Vital events...55
3.2.3
Cause-of-death data ... 58
3.2.4
Socio-economic information ... 62
3.3
New estimates and correction... 63
3.3.1
Population estimation in the intercensal period for districts ... 63
3.3.2
Correction of infant mortality ... 64
3.3.3
Correction of cause of death data ... 71
Chapter 4. Methodology and techniques ... 79
4.1
Rates and ratios ... 79
4.1.1
Age-specific death rates ... 79
4.1.2
Standardized Death Rate ... 87
4.1.3
Standardized Mortality Ratio ... 88
4.1.4
Proportionate Mortality Ratio ... 90
4.1.5
Trade-off between PMR and SMR ... 91
4.2
Estimating indicators from the life table ... 93
4.2.1
Life expectancy ... 93
4.2.2
Lifespan disparity ... 96
4.3
Decomposition ... 96
4.4
Some measures of variation ... 97
4.5
Spatial analysis ... 97
4.6
Principal component and correspondence analysis ... 99
Chapter 5. Geographical patterns of mortality at the turn of the XXI century ... 101
5.1
Level of mortality and age-sex patterns ... 101
5.1.1
Life expectancy ... 101
5.1.2
Age regrouping ... 105
5.1.3
Age decomposition ... 108
5.2
Mortality by causes of death ... 111
5.3
Mortality by age and causes of death ... 117
5.3.1
Infant mortality ... 120
5.3.2
Mortality at age 1-19 years ... 122
5.3.3
Mortality at age 20-44 years ... 124
5.3.4
Mortality at age 45-59 years ... 128
5.3.5
Mortality at age 60-74 years ... 132
5.3.6
Mortality at age 75 years and more... 134
5.4
Mortality from particular causes... 137
Conclusions ... 141
Chapter 6. From Soviet times to independence ... 143
6.1
General mortality ... 143
6.1.1
Trends and recent upturns in life expectancy ... 143
6.1.2
Lifespan disparity ... 150
6.1.3
Dispersion measure of mortality ... 152
6.2
Hierarchy of causes of death in three periods ... 153
6.2.1
Circulatory system diseases ... 159
6.2.2
Neoplasms ... 161
6.2.3
External Causes ... 163
6.2.4
Respiratory system diseases ... 165
6.2.5
Digestive system diseases ... 166
6.2.6
Infectious and parasitic diseases ... 167
Conclusions ... 171
Chapter 7. Analysis of mortality across districts ... 173
7.1
Description of districts ... 173
7.2
Infant mortality ... 175
7.3
Cause-of-death analysis ... 194
7.4
The situation in big cities ... 201
7.5
Spatial analysis ... 204
7.6
Mortality in a region which suffered from the Chernobyl accident... 207
Conclusions ... 218
General conclusions ... 221
Bibliography ... 229
List of abbreviations:
AIDS Acquired Immunodeficiency Syndrome
AR Crimea Autonomous Republic of Crimea
ASDR Age-Specific Death Rate
CA Correspondence Analysis
CI Confidence Interval
CNPP Chernobyl Nuclear Power Plant
CSD Circulatory System Diseases
CVD Cardiovascular Diseases
DHS Demographic and Health Survey
DMM Dispersion Measure of Mortality
ESDA Exploratory Spatial Analysis
EU European Union
ICD International Classification of Diseases
IHD Ischaemic Heart Disease
IMR Infant Mortality Rate
LE Life Expectancy
LISA Local Indicator of Spatial Association
MOH Ministry of Health
NMR Neonatal Mortality Rate
PMR Proportionate Mortality Ratio
PNMR Post-Neonatal Mortality Rate
SDR Standardized Death Rate
SMR Standardized Mortality Ratio
SSS State Statistics Service
TB Tuberculosis
TFR Total Fertility Rate
UNDP United Nations Development Program
UNICEF United Nations Children's Fund
URHS Ukrainian Reproductive and Health Survey
USSR Union of Soviet Socialist Republics
WHO World Health Organization
List of tables:
Table 2.1: Crude death rate, infant mortality rate and estimated per-capita income by large
regions of Ukraine, 1926-1927 ... 29
Table 3.1: Administrative and territorial structure of Ukraine and some characteristics of regions at 2001 census ... 45
Table 3.2: Availability of information on population, Ukraine ... 48
Table 3.3: Availability of information on death counts, Ukraine ... 57
Table 3.4: Availability of information on death counts, Ukraine ... 58
Table 3.5: Availability of information by causes of death by regions ... 59
Table 3.6: List of causes available for regions for 1990-1994, Soviet Classification ... 60
Table 3.7: Availability of socio-economic information ... 63
Table 3.8: Time intervals according to which correction of infant mortality was made ... 67
Table 3.9: Minimum and maximum correction coefficients for correcting infant mortality among regions in Ukraine, 1989-2006 ... 69
Table 3.10: Proportion of ill-defined deaths in tree periods, Ukraine ... 73
Table 4.1: Effects from applying different techniques to life expectancy, average difference for 1988-2010, in years ... 87
Table 4.2: Formulas for calculating standard error for confidence intervals depending on the number of observed deaths ... 89
Table 4.3: A scheme of tabulated numbers of deaths by causes and by district ... 91
Table 4.4: Calculation of separation factor ax for males and females for age 0 and 1 years ... 94
Table 5.1: Some measures of variation of life expectancy at different ages, Ukraine, 2000-2003 ... 104
Table 5.2: Matrix of Pearson correlation coefficients by age, 2000-2003, Ukraine ... 106
Table 5.3: Mortality structure by causes of death for total Ukraine, average for 2000-2003 .... 112
Table 5.4: Mortality rate at age 0, per 100 000 of standard population, Ukraine, 2000-2003 .. 121
Table 5.5: SDR for 1-19 years, per 100 000 of standard population, Ukraine, 2000-2003 ... 123
Table 5.6: SDR for 20-44 years, per 100 000 of standard population, Ukraine, 2000-2003 ... 126
Table 5.7: SDR for 45-59 years, per 100 000 of standard population, Ukraine, 2000-2003 ... 129
Table 5.8: SDR for 60-74 years, per 100 000 of standard population, Ukraine, 2000-2003 ... 133
Table 5.9: SDR for 75 years and more, per 100 000 of standard population, Ukraine, 2000-2003 ... 135
Table 5.10: Selected causes of death in the mortality structure, Ukraine, 2000-2003 ... 138
Table 7.2: Regression models of IMR for Ukraine, 2005-2010 ... 190 Table 7.3: Infant mortality rate actual and predicted by the model, average for 2005-2010 ... 193 Table 7.4: Some demographic indicators of Slavutych in comparison with selected towns and Ukraine as a whole ... 217 Table 7.5: Standardized Mortality Ratios for selected towns by causes of death, 2005-2010 .... 218
List of figures:
Figure 1.1: Map of Europe ... 7
Figure 1.2: Landscape of Ukraine...7
Figure 1.3: Ukraine’s population forecast (2011- 2050) based on current trends (1988-2010) . 11 Figure 1.4: Crude birth rate and crude death rate, 1975-2005 ... 11
Figure 1.5: Age-sex pyramid for population of Ukraine in 2001 and 2010 ... 12
Figure 1.6: Mean age of population, census of 2001 ... 13
Figure 1.7: Total fertility rate in Ukraine, 1988-2009 ... 14
Figure 1.8: Total fertility rate by region, 2002 ... 15
Figure 1.9: Net migration in Ukraine, 1990-2007 ... 16
Figure 1.10: Life expectancy at birth for males and females, 1959-2009, Ukraine ... 18
Figure 1.11: Life expectancy at birth in Ukraine and selected countries, both sexes, 1980-2010 19 Figure 1.12: Difference in life expectancy at birth between males and females in Ukraine and selected countries, 1980-2009 ... 20
Figure 1.13: Life expectancy at birth in Ukraine, 2001 ... 22
Figure 1.14: Life expectancy at birth in Ukraine, 1989 and 2001 ... 23
Figure 1.15: Visualization of three time periods used for the analysis ... 25
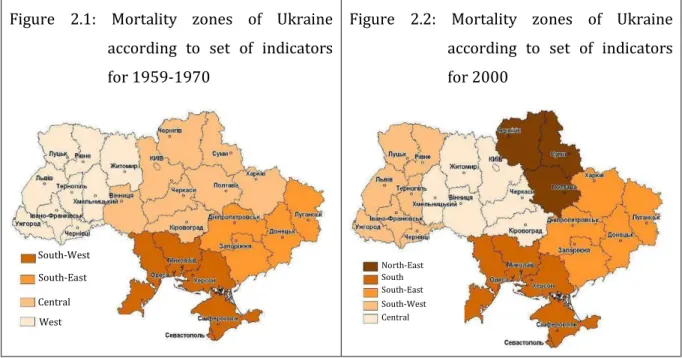
Figure 2.1: Mortality zones of Ukraine according to set of indicators for 1959-1970 ... 34
Figure 2.2: Mortality zones of Ukraine according to set of indicators for 2000 ... 34
Figure 2.3: Zones of Ukraine according to modern mortality profile ... 35
Figure 3.1: Administrative and territorial division of Ukraine at the moment of census 2001 ... 42
Figure 3.2: Percent of urban population and population density by regions, 2001 census ... 46
Figure 3.3: Simplified territorial division ... 46
Figure 3.4: Dynamics of net migration in 1989-2002 for the whole Ukraine (according to population registers)... 50
Figure 3.5: Net migration for Lviv region, 1989-2002 ... 51
Figure 3.6: Regions with rather negative net migration during the period of 1989-2002 ... 52
Figure 3.7: Regions with sharp changes in net migration during the period of 1989-2002 ... 53
Figure 3.8: Regions with rather positive net migration over the period of 1989-2002 ... 54
Figure 3.9: Dynamics of IMR in Ukraine’s regions before and after the definition change ... 65
Figure 3.10: Infant mortality rate estimates from registration system, 2007 UDHS, and 1999 URHS (with confidence intervals) ... 66
Figure 3.11: Infant mortality rate registered and corrected for Ukraine, 1980-2011 ... 68
Figure 3.12: Infant mortality rate registered and corrected, Odeska oblast, 1989-2011 ... 68
Figure 3.13: Infant mortality rate registered and corrected for Kharkivska oblast, 1989-2010 .. 69
Figure 3.14: Correction coefficients by regions of Ukraine, 2001-2004 ... 70
Figure 3.15: Annual number of deaths classified under “senility”, “symptoms and other unspecified conditions”, and “sudden infant death syndrome”, Ukraine ... 72
Figure 3.16: Annual number of deaths classified as “ill-defined”, Ukraine ... 72
Figure 3.17: Proportion of ill-defined deaths in tree periods, Ukraine ... 73
Figure 3.18: Deaths from ill-defined causes in Volynska oblast and Ukraine, 1988-2004 ... 75
Figure 3.19: Trends in standardized death rate from neoplasms and diseases of circulatory system before and after redistributing deaths from ill-defined causes, 1988-2004 ... 77
Figure 4.1: Fragment of Lexis diagram portraying A-sets of deaths ... 81
Figure 4.2: Life expectancy at birth in Ukraine calculated by different methods, 1998-2008 ... 84
Figure 4.3: Age-specific death rates: initial and smoothed by different methods, 1989 ... 85
Figure 4.4: Illustration of the Proportionate Mortality Ratio ... 90
Figure 4.5: SMR vs. PMR for respiratory system diseases in Ukraine, 2005-2010 ... 92
Figure 4.6: SMR vs PMR for external causes in Ukraine, 2005-2010 ... 92
Figure 5.1: Life expectancy at birth for males and females, Ukraine, average for 2000-2003 .... 103
Figure 5.2: Life expectancy at birth, at age 25 and 65 years for males and females, Ukraine, average for 2000-2003... 104
Figure 5.3: Biplot of principal component analysis of mortality by age, 2000-2003 ... 106
Figure 5.4: Biplot of principal component analysis of mortality by age and region, 2000-2003 107 Figure 5.5: Contributions of age-groups to the differences in life expectancy between each region and average for Ukraine, 2000-2003 ... 109
Figure 5.6: SDR for main causes of death in Ukraine regions, average for 2000-2003 ... 113
Figure 5.7: SDR for selected groups of causes in Ukraine regions, average for 2000-2003 ... 115
Figure 5.8: Contributions of different causes of death to the difference in life expectancy between each region and average for Ukraine, average for 2000-2003 ... 116
Figure 5.9: Age-specific death rates from main causes of death, for total Ukraine, average for 2000-2003 (circulatory system diseases – second axis) ... 118
Figure 5.10: Mortality structure according to SDR from different causes of death for selected age groups, for males and females, total Ukraine, average for 2000-2003 ... 119
Figure 5.11: Infant mortality rate for males and females, Ukraine, 2000-2003 ... 120
Figure 5.12: SDR for age group 1-19 years from all causes, Ukraine, average for 2000-2003 .... 122
Figure 5.14: SDR for age group 45-59 years for males and females, Ukraine, 2000-2003 ... 128
Figure 5.15: SDR for age group 60-74 years for males and females, Ukraine, 2000-2003 ... 132
Figure 5.16: SDR for age group 75 andover for males and females, Ukraine, 2000-2003 ... 135
Figure 5.17: Correspondence analysis of cause-specific death rates in Ukraine’s regions, both sexes combined, 2000-2003 ... 139
Figure 6.1: Life expectancy at birth for males and females, Ukraine 1988-2010 ... 144
Figure 6.2: Life expectancy at birth for males and females observed in Donetska and Ternopilska oblast, 1988-2010... 145
Figure 6.3: Contribution of age-specific mortality to differences in life expectancy between Ternopilska and Donetska oblasts, 1988-2010 ... 145
Figure 6.4: Life expectancy at birth for males and females, by regions of Ukraine, comparison of three periods ... 147
Figure 6.5: Life expectancy at birth for males and females, by regions of Ukraine, correlation between situations in 1988-1991, 2000-2003, and 2007-2010 ... 148
Figure 6.6: Lifespan disparity versus life expectancy in two oblasts, 1988-2010 ... 151
Figure 6.7: DMM across regions of Ukraine for life expectancy at birth, 1988-2010... 152
Figure 6.8: Nosological structure of mortality in Ukraine according to standardized death rates, comparison among three periods ... 156
Figure 6.9: Trends of SDR from circulatory system diseases by regions, 1988-2011 Ukraine ... 160
Figure 6.10: Geographical patterns of SDR from circulatory system diseases, Ukraine... 160
Figure 6.11: Trends of SDR from neoplasms by regions, 1988-2011 Ukraine ... 162
Figure 6.12: Geographical patterns of SDR from neoplasms, Ukraine ... 162
Figure 6.13: Trends of SDR from external causes by regions, 1988-2011 Ukraine ... 163
Figure 6.14: Geographical patterns of SDR from external causes, Ukraine ... 164
Figure 6.15: Trends of SDR from respiratory system diseases by regions, 1988-2011 Ukraine 165 Figure 6.16: Geographical patterns of SDR from respiratory system diseases, Ukraine ... 166
Figure 6.17: Trends of SDR from digestive system diseases by regions, 1988-2011 Ukraine .... 167
Figure 6.18: Geographical patterns of SDR from diseases of the digestive system, Ukraine ... 167
Figure 6.19: Trends of SDR from infectious and parasitic diseases by regions, 1988-2011 Ukraine ... 168
Figure 6.20: Geographical patterns of SDR from infectious and parasitic diseases, Ukraine ... 168
Figure 6.21: Trends of SDR from alcohol-related causes by regions, 1988-2011 Ukraine ... 170
Figure 6.22: Geographical patterns of SDR from alcohol-related causes, Ukraine ... 170
Figure 7.1: Frequency distribution according to the population size, census data (2001) ... 174
Figure 7.3: Regional variation of infant mortality in Ukraine, 2010 ... 179
Figure 7.4: Infant mortality rate for total, urban, and rural population of Ukraine, average for 2005-201 ... 183
Figure 7.5: Box plot for IMR according to the type of place of residence, Ukraine, 2005-2010 . 185 Figure 7.6: Climatic conditions in Ukraine ... 187
Figure 7.7: Graphs visualizing diagnostic for normality ... 189
Figure 7.8: Statistical and geographical distribution of residuals ... 192
Figure 7.9: SMRs from all causes, average for 2005-2010, Ukraine ... 196
Figure 7.10: SMRs from circulatory system diseases, average for 2005-2010, Ukraine ... 196
Figure 7.11: SMRs from neoplasms, average for 2005-2010, Ukraine ... 197
Figure 7.12: SMRs from external causes, average for 2005-2010, Ukraine ... 197
Figure 7.13: SMRs for certain causes of violent mortality, average for 2005-2010, Ukraine ... 198
Figure 7.14: SMRs from respiratory system diseases, average for 2005-2010, Ukraine... 199
Figure 7.15: SMRs from digestive system diseases, average for 2005-2010, Ukraine ... 200
Figure 7.16: SMRs from infectious and parasitic diseases, average for 2005-2010, Ukraine ... 200
Figure 7.17: SMR for different causes of death for regions where excluding big cities from the data produced positive changes, Ukraine 2005-2010 ... 202
Figure 7.18: SMR for different causes of death for regions where excluding big cities from the data produced negative changes, Ukraine 2005-2010 ... 203
Figure 7.19: LISA Index by Ukraine districts, 2005-2010, all causes... 205
Figure 7.20: LISA index by districts of Ukraine for different causes of death, 2005-2010 ... 206
Figure 7.21: Accumulated contamination of caesium-137, kBq/m2, 1986 ... 211
Figure 7.22: Blind map of selected units ... 211
Figure 7.23: Age-sex pyramids for the populations of Slavutych and Ukraine as a whole according to census data (end of 2001) ... 212
Figure 7.24: Age-sex pyramids for populations of Slavutych, Netishyn and Kirovske according to census data (end of 2001) ... 213
Figure 7.25: SMR from all causes of death for selected districts and Slavutych, 2005-2010 ... 214
Introduction
After World War II, the massive spread of antibiotics and generalized immunization improved health everywhere in Europe. In the mid-60s, all the countries had completed the stage of fighting against infectious mortality and entered the stage in which mortality became more prevalent from man-made and degenerative diseases, i.e., the diseases of the circulatory system, alcoholism, traffic accidents, etc. (Meslé, 2002). On the Western side, countries managed to achieve some success in reversing trends in these diseases; while in all the Eastern European countries, life expectancy - which is a summary mortality measure - began to plateau or even decrease.
This divergence was not only a matter of trends in the levels of life expectancy, but a result of important changes in age structure and cause-of-death structure as well. In most of the region, this crisis caused a number of avoidable deaths and threatened to erode social stability. The worst case was observed in the republics of the former USSR, namely: Estonia, Latvia, Lithuania, Russia, and also in Ukraine (Meslé, 2002).
Mortality crises of various intensities are not new to the region. In 1932-1933, Ukraine was hit by a severe famine, which took the lives of between 2.4 to 7.5 million Ukrainians, according to different estimates. There was another major Soviet famine of 1946-1947, which impacted grain-producing countries the most, such as occurred in Ukraine. The Second World War caused between 2.5 and 5.5 causalities in Ukraine, which makes 40-44% of total loses of Soviet Union.
The recent surge in mortality occurred in peacetime and has not been accompanied by outbreaks of death by starvation, infection, and exhaustion (Cornia and Paniccia, 2004; UNICEF, 1994). The increase in mortality in Ukraine was combined with a decrease in fertility, which took on a spontaneous character and led to a demographic crisis. The main consequence of this was depopulation – a sharp decrease in the population number. The mean annual natural decline in population in 1990-2010 amounts to approximately the size of a city like Strasbourg
or Bordeaux - around 280 thousand people. In addition, for many years (up to 2004), emigration exceeded immigration and caused further losses in population.
Known for being the second largest country in Europe in terms of total area (603 700 km2),
Ukraine once occupied only the sixth place in terms of population number (after Russia, Germany, France, UK and Italy). In 2009, Ukraine moved to even seventh position as Spain surpassed it, even though the Ukrainian population exceeded that of Spain by 13 million only two decades before. At the moment it declared independence from the Soviet Union in 1991, the population of Ukraine was roughly 52 million, while at the beginning of 2014 it amounted to only 45.2 million people (a loss of 13%).
Ukraine is by no means a new nation. With a millennium-long history, a distinct language, literature, architecture, and church institutions, together with bouts of short-lived independence, the Ukrainians rank among the oldest peoples of Europe (Wolchik and Zviglyanich, 2000). Ukrainian history lays exclusive claim to Kyiv Rus as a proto-Ukrainian state, based on ethno-cultural and territorial reasons (Kuzio, 2006). However, the process of building an effective Ukrainian state has been complicated by the country’s ethnic composition and history of foreign domination (Wolchik and Zviglyanich, 2000). The standard Soviet nationality doctrine permitted only some limited recognition of Ukrainians, while the Russophile school denies the very existence of Ukrainians as a separate ethnic group (Kuzio, 2006). For the Ukrainians, whose culture and identity have been threatened by Russia for centuries, independence has fuelled the process of rediscovering their national identity as Ukrainians.
History matters to historians as well as to politicians or sociologists since it has a direct impact on a country’s integrity, domestic politics, foreign policy orientation, and on its demographic development. Because Ukraine was a large country partitioned by its neighbours early on, several profound scars were left on Ukraine’s national identity, which persist to this day. One consequence of the partitions is the diversity of Ukraine’s population. Geographic dissemination results in divergence of demographic characteristics, and mortality in particular.
The variation in regional mortality in Ukraine is the subject of this thesis. According to the 2001 census, the difference between maximum (usually observed in the west) and minimum (observed in the Ukrainian east) life expectancy reaches 5 years, which is a lot from a broader European perspective. This gap is even more pronounced for males (almost 7 years), and to a lesser degree for females (3.6 year). The crisis of recent years deepened the situation in already vulnerable regions, though 2008-2011 have been marked by recovery.
Health is a key human right, and health equity is a central principle in social justice (Kibele, 2012). By irony of fate, Ukraine has such a health care system that it does not account for the disparities in the health status of the population at all. Approaches to capacity planning in the
Ukrainian health care sector have remained almost unchanged since Soviet times. The mechanisms currently in place neither reflect the health care needs of the population in regions nor account for regional characteristics of health service provisions. Large differences between areas cause alarm about socioeconomic problems. Priority of action is not given to those regions with the most unfavourable mortality profile in order to amortize the imbalance.
Today more than ever, information about the whole country is not sufficient for many purposes. Demographic data are needed for smaller subdivisions and for other classifications of areas. The increasing divergence in life expectancy among Ukraine’s sub-divisions points toward the necessity of detailed research on mortality at a new level.
Data availability is one of the major obstacles that prevented researchers from studying geographical variations of mortality in Ukraine. Many statistical sheets became available in computerized form only recently, and this data is still incomplete. Besides, some new forms were brought into usage after the census of 2001. Furthermore, given a set of rules about the registration of people and events, there are usually errors in applying these rules at the regional level.
This thesis is a first attempt to analyze mortality and its evolution beginning from 1988 at the level of large regions of Ukraine as well as at the level of a more profound administrative subdivision, such as districts, which will allow shining light on the tendencies that are invisible at the level of large regional units. Additionally, it involves explaining regional differences in mortality and their evolution on the basis of medical causes of death. Therefore, the main research questions raised to research were:
1. How large are geographical variations in mortality in Ukraine?
2. What are the main medical causes of death behind geographical variations in mortality?
3. How have mortality variations been changed since the collapse of the USSR?
The thesis consists of seven chapters.
Chapter 1 describes peculiarities of the geographic, economic and demographic situation and tendencies in Ukraine. It presents the general framework, research questions raised and hypothesis set; and it explains attention brought to the retrospective span.
A literature review follows the introductory chapter. It provides a critical appraisal of existing knowledge on mortality in Ukraine, its neighbours and in Europe. The review of literature about Ukraine is structured in chronological order, from the sources found on the earliest period, through the Second World War, to contemporary studies of Ukraine’s mortality as well as of its regional patterns.
Chapter 3 describes the unit of analysis, which is a territorial entity, a region or a district. It reviews in detail the availability and quality of the information employed to detail existing problems and approaches to resolve them. Chapter 4 presents the methodological tools used in Chapters 5, 6 and 7.
The next three chapters contain the results of the original research. Chapter 5 describes the mortality variation across regions observed around the 2001 census, as data for this year was the most reliable. It deals with an aggregated age-specific and cause-specific analysis of Ukraine’s regions. Chapter 6 enriches such exploration by analysing the dynamics of cause-specific death rates from the last 1989 Soviet census to present. Chapter 7 goes further in detail and presents spatial and temporal mortality variation across small-area units, i.e., districts. Special attention is paid also to infant mortality, because it decreased while the adult mortality increased. A separate section is also dedicated to estimating some mortality consequences in a city that was most hit by the Chernobyl catastrophe.
The work ends by providing a general conclusion and discussion of the findings. The research questions are assessed in light of the empirical results from different regional levels outlined in the three preceding chapters.
1
Chapter 1
Justification of the study
1.1 Historical and geographical context
Ukraine is an Eastern European country, situated strategically at the crossroads of Europe and Asia. It has an area of 603,628 km2 — including Crimea, which is claimed and controlled by
neighboring Russia—making it the largest country entirely within Europe. It is bordered by Belarus on the north, the Russian Federation on the north and east, Poland on the west, and Moldova, Romania, Hungary, and Slovakia on the south-west (Figure 1.1). It is a varied country with the Carpathian Mountains in the west, forests in the north, fertile plains in the center, industrial basin in the east, and the Black Sea and Azov Sea to the south
In the Middle Ages, the area became a key center of the East Slavic culture, as epitomized by the powerful state of Kyiv Rus. In the 13th century when Mongol raiders razed Kyiv, Ukraine was contested, ruled and divided by a variety of powers.
Most of the territory of what is modern Ukraine was annexed by Poland and Lithuania in the 14th century, but during that time, Ukrainians began to conceive of themselves as a distinct people, a feeling that survived subsequent partitioning by greater powers over the next centuries. Ukrainian peasants who fled the Polish effort to force them into servitude came to be known as Cossacks and earned a reputation for their fierce martial spirit and love of freedom. In 1667, Ukraine was partitioned between Poland and Russia. In 1793, when Poland was partitioned, much of modern-day Ukraine was integrated into the Russian Empire.
The 19th century found the region largely agricultural, with a few cities and centers of trade and learning. The region was under the control of the Austro-Hungarian Empire in the extreme west and the Russian Empire elsewhere. When World War I and the Russian revolution shattered the Habsburg and Russian empires, Ukrainians declared independent statehood. In 1917 the Central Rada proclaimed Ukrainian autonomy and in 1918, following the Bolshevik seizure of power in Petrograd, the Ukrainian National Republic declared independence under President Mykhaylo Hrushevsky.
In 1919, the Ukrainian People's Republic, led by journalist Simon Petliura, formally united with the West Ukrainian People's Republic (which was part of the Austro-Hungarian Empire) based in Lviv. This union of Ukraine's lands proved to be short lived as the West Ukrainian National Government's Army lost the war against Polish expansionists, while the Kyiv- based Ukrainian Army was forced out of Ukraine by the Red Army. Soon after, Ukraine was officially incorporated into the Soviet Union. Under Stalin rule, Ukrainian political, social, economic and cultural fabric was atomized through totalitarian terror, involving massive purges, executions, and the exile of millions to the infamous labor camps of Siberia's "Gulag".
During World War II, Ukraine again was heavily damaged. The post war years in Ukraine were marked by intensive restoration of the destruction caused during the war. The Kremlin intensified its policy of "Russification", barring the Ukrainian language from government, education, courts and so on. With so many economic and social disincentives at work, the policy itself worked well, especially in Kyiv and other large cities of central and eastern Ukraine.
The 1980's were marked by increasing political impotence of Soviet leadership. The Chernobyl Nuclear Power Plant accident of April 26, 1986, brings back painful memories for all Ukrainians. This disaster caused number of deaths and health related problems, and inflicted enormous ecological and economic damage.
On July 6, 1990, the legislature proclaimed Ukraine's sovereignty. On August 24, 1991, the Verhovna Rada (Parliament) declared the Independence of Ukraine. On December 1, in a nationwide referendum, 90.3% of Ukraine's citizens voted for an independent Ukraine and chose their first democratically elected President.
Ukraine covers an area of 603 700 km2 and is the largest country entirely within Europe. The
country consists mainly of flat lowland and gently rolling uplands, with about 5% of the country covered by mountain and sub-mountain regions.
The western edge of Ukraine lies within the Carpathian mountain range, which stretches from the Czech Republic to Romania. On the south-eastern coast of the Crimean peninsula is the Crimean mountain range.
There are many large rivers in Ukraine, such as Dnieper, Danube,
Dniester, Desna, Donets,
Pivdennyi Bug1 etc., of which the
first three are among the largest rivers in Europe.
The territory of the country can be
divided into three main
geographic zones. In the north is the forest zone, covering 20% of the country. The forest-steppe zone in the centre, covering about 35% of the country, is a mixture of forest and steppe. The remaining 40% of the country in the South and East is within the steppe belt.
Only 3% of this zone is forested, while 80% consists of arable land. Most of the land in the forest-steppe and forest-steppe zones is covered by chernozem, a particularly fertile type of soil. The climate in Ukraine is continental except for the south coast of Crimean peninsula, where the climate is sub-tropical.
Ukraine has long been a global breadbasket due to its extensive, fertile farmlands. As of 2011, it was the world's third-largest grain exporter. Additionally, the country has a well-developed manufacturing sector, particularly in aerospace and industrial equipment.
1As for the translation of proper names, the priority was given to existing terms in the English language (for example,
Black Sea, Crimea, Sebastopol, Chernobyl) and verified in accordance with Oxford Dictionaries
(http://oxforddictionaries.com) and ABBYY Lingvo dictionary (http://www.lingvo-online.com). The exception was made for the official names: of a country (“Ukraine” rather than “the Ukraine”) and of a capital (“Kyiv” rather than
“Kiev”). In the remaining cases, a method of transliteration from Ukrainian to Latin (accorded by Decree №55 from 27
January 2010 of the Cabinet of Ministers of Ukraine) was applied.
Figure 1.1: Map of Europe
Figure 1.2: Landscape of Ukraine
1.2 Peculiarities of the economic and political situation
For many years, Ukraine’s economy was an integral part of the national economic complex of the USSR, which was state-governed and highly militarized. Throughout the Soviet period, social cohesion was provided by powerful ideological propaganda, obligatory employment of all individuals of working age, wage leveling, strict regulation of prices, free education and health care services etc., all of which were financed from the state budget and public funds (Libanova, Makarova et al. 2009).
The first signs of stagnation in such a relatively inefficient economic system showed up in the middle of the 1980s. After the ineffective governmental initiative named perestroika aimed at combatting a crisis, the Soviet Union fell apart, which led to an abrupt decrease in production, hyperinflation, unemployment and a drastic decline in living standards (Grigoriev, 2011).
In the 1990s Ukraine passed through a painful period of transition from a closed totalitarian society to an open civilian society with a market oriented economy. Looking behind now one may conclude that economic reforms were applied unsuccessfully.
During the years of independence, socio-economic transformation in Ukraine has gone through several stages. In the 1990s, the situation in Ukraine (as well as in other former Soviet republics) was characterized by the deterioration of the economic situation and living standards for a majority of people accompanied by poverty as well as material and social inequality. Measured gross domestic product in 1999 stood at 45% of its official level in 1991, and at 39% of 1989 level (Boss, 2000). After 2000, tendencies for the improvement of the situation started to be reflected in GDP growth, enhancement of the business environment and rising incomes (Libanova, Makarova et al., 2009). However, even under conditions of economic improvement, inequality was still growing. According to Libanova, income inequality also increased within regions, urban and rural areas, and among workers in different sectors of industry.
The polarization of society according to political, national and religious creeds appeared as well. According to sociological monitoring, almost 30% of people believe it is necessary to strengthen relationships with Russia and Belarus, 18% of people indicate the necessity to strengthen relationship with European Union, and about 20% of people have an opinion that Ukraine should enhance its independence (Libanova, Makarova et al. 2009).
Under such circumstances, Ukraine slipped into situation in which society lost its ability to reproduce its population at the same level and to maintain it in a good health condition.
1.3 Peculiarities of the health care system
Health care in Ukraine has changed very little since independence, and it is still largely based on the Semashko model, which was implemented in the Soviet health care system. This model envisaged centralized planning and administration, with resource allocation based on capacity (Lekhan et. al. 2004). The Ministry of Health acts as the main body, and regional health departments are responsible for the organization and funding of primary and secondary care services in the regions. This system was originally developed for episodic care for acute illness and is not properly oriented toward meeting the needs of patients with chronic conditions (World Bank, 2006).
In 1992 the Ukrainian parliament adopted the Principles of Legislation on Health, regulating all aspects of the development and implementation of health policy with the aim of meeting international standards (Lekhan et. al., 2004). Nevertheless attempts at reform have failed to have a substantial impact. The health care system continues facing problems of inefficiency in financing, planning and regulation that cannot be fixed by cash infusion alone.
Governmental spending on health care in Ukraine is low by regional and European standards and slightly above average internationally when normalized by GDP (3.7% of GDP in 2006, according to the World Bank). This number includes governmental expenditures but not (formal and informal) payments. Private out-of-pocket payments are on the order of 2-3 percent of GDP (World Bank, 2008). The majority of outpatient care is financed by out-of-pocket payments, mostly due to the cost of pharmaceuticals, which are not covered by government funding.
The, lion’s share of Ukraine’s health budget allocation is to hospitals, sanatoriums and specialized health facilities. Preventive and primary health care remain largely neglected. Around 70 percent of expenditure is to hospitals. Of the hospital allocation, 80-90 percent is to staff salaries and utilities. Key areas such as supplies, equipment, maintenance, and repairs of deteriorated infrastructure are neglected (Menon et. al., 2009).
Reforms undertaken in 2001 and 2002 to change how resources are allocated were only partially implemented and local spending continues to be based on supply-side norms established by the Ministry of Health, which determines the number of doctors, nurses and other staff that are required, which itself is based on population size, bed numbers, and other indicators (World Bank, 2008).
In 2000 there were also initiatives to remodel primary care on the principles of family medicine. Family ambulatories have been established rapidly in some areas; however, lack of economic incentives has hampered further reform (Menon et. al., 2009).
Finally, Ukraine lacks an established and accountable physician gate-keeping mechanism. Patients may directly seek care from specialists with no need of a formal referral by their physician. Patients therefore visit specialists directly for primary health care needs. According to a recent survey, 60 percent of first visits are to specialists (Lekhan et. al. 2007). Moreover, more than half of all direct specialist visits are to inappropriate providers. Accordingly, almost two-thirds of all visits result in improper care for the patient’s condition (Menon et. al., 2009).
Summarizing, current approaches to capacity planning in the Ukrainian health care sector do not reflect the health care needs of the population, no do they account for regional characteristics. Even though the system has been decentralized (with local government funding and local facility ownership) extensive regulation by the centre gives regions very little flexibility in the administration of services and facilities, which accounts for the current morbidity and mortality situation.
1.4 Peculiarities of the demographic situation
1.4.1 General trends
In the XX century, Ukraine suffered serious demographic crises and social catastrophes, such as the First World War, the civil war, famine and epidemics, repressions, the Second World War, deportations etc. (Pirozhkov, 2004). These processes had a negative effect on the population age structure and on its reproductive capacities.
In the 70s through the 90s, Ukraine entered a new phase of demographic transition characterized by declining fertility and high mortality, ageing and depopulation (Pirozhkov, 2004). At the moment of independence, Ukraine had a population of 52.2 million and was the sixth largest country in Europe. However, for 20 years the population of the country has decreased by 6.7 million persons (13%) and in December of 2011 it was equal to 45.5 million people. If current trends continue, by 2050 the population is projected to decline to 36.2 million (Figure 1.3).
Figure 1.3: Ukraine’s population forecast (2011- 2050) based on current trends (1988-2010)
Source: Projection of IDSS based on the data of the State Statistics Service of Ukraine.
A variety of key factors have influenced this decline: increasing emigration, declining fertility, and rapidly increasing mortality, particularly among working age males. However, a fundamental factor in population size in Ukraine is its natural growth. The phenomenon of a sharp fall in fertility and an increase in mortality is typical for other ex-Soviet republics and is sometimes referred to as Slavic Cross
(Figure 1.4).
The process of depopulation began in Ukraine's villages in 1979 (Levchuk et al., 2001), and things have worsened under the conditions of socio-economic crisis. In 1991 the number of deaths for the first time exceeded the number of births for Ukraine as a whole (by 39,000). In 2002 the natural population loss reached a level of –7.6 per 1000, the highest rate in the European Region. The annual decline of population amounted to the size of a big city (around 300 thousand people). For now Ukraine has succeeded in reducing negative natural population growth, and in 2010 it
amounted to -4.4 per 1,000 of population (there were 10.8 births compared to 15.2 deaths per 1,000). 0 - 14 years of age 15-59 years of age 60+ years of age 2010 0 10 20 30 40 50 1 9 8 8 1 9 9 0 1 9 9 2 1 9 9 4 1 9 9 6 1 9 9 8 2 0 0 0 2 0 0 2 2 0 0 4 2 0 0 6 2 0 0 8 2 0 1 0 2 0 1 2 2 0 1 4 2 0 1 6 2 0 1 8 2 0 2 0 2 0 2 2 2 0 2 4 2 0 2 6 2 0 2 8 2 0 3 0 2 0 3 2 2 0 3 4 2 0 3 6 2 0 3 8 2 0 4 0 2 0 4 2 2 0 4 4 2 0 4 6 2 0 4 8 2 0 5 0 pop ul a ti on in m ln years
Figure 1.4: Crude birth rate and crude death rate, 1975-2005
Source: data of the State Statistics Service of Ukraine
Crude birth rate Crude death rate 5 6 7 8 9 10 11 12 13 14 15 16 17 18 1 9 7 5 1 9 7 7 1 9 7 9 1 9 8 1 1 9 8 3 1 9 8 5 1 9 8 7 1 9 8 9 1 9 9 1 1 9 9 3 1 9 9 5 1 9 9 7 1 9 9 9 2 0 0 1 2 0 0 3 2 0 0 5 pe r 1 0 0 0 pop ul a ti on years
1.4.2 Age structure
The demographic changes of the last 20 years have had a strong impact on the age-structure of Ukraine’s population. The population of Ukraine is now one of the oldest in Europe. 20.8% of the population is age 60 or older (15.5% of the population ages 65 or older), and only 14.2% of the population is under the age of 15. In developed countries, the aging of the population typically occurs due to an increase in longevity. In Ukraine, the aging of the population has been caused by a dramatic decrease in the birth rate and an increase in the death rate of the working-age population. As a result of population
ageing, the old-age dependency ratio increased from 18.5% in 1990 to 22% in 2010.
However, it should be noted that since the beginning of the XXI century a tendency toward improvement has been observed. When comparing population pyramids from the 2010 and 2001 censuses (Figure 1.5), one may observe that in 2010 the bottom of the pyramid started to widen, indicating an increase in the number of births, though the general configuration is still very much distorted.
Another measure of ageing is the mean age of the population, which is the average age of all its members. Massive movements of population to the East during the epoch of industrialization caused shifts in the population structure. One can see on the map (Figure 1.6a) that the population of Ukraine is old: its average age is above 38 years (around the age of the population in Italy); and the difference between the youngest and the oldest regions is almost 7 years. The urban population is somewhat younger, around 34 years, and interregional difference is a bit smaller – 5.6 years (Figure 1.6b). In the East, urbanization rejuvenates the old population, while the West still remains even younger because of higher fertility.
Figure 1.5: Age-sex pyramid for population of Ukraine in 2001 and 2010
Source: data of the State Statistics Service of Ukraine
2010 2006 2002 1998 1994 1990 1986 1982 1978 1974 1970 1966 1962 1958 1954 1950 1946 1942 1938 1934 1930 1926 1922 1918 1914 1910 -500000 -300000 -100000 100000 300000 500000 0 8 16 24 32 40 48 56 64 72 80 88 96 y e a r o f b ir th f o r p y ra m id o f 2 0 1 0 a g e
Figure 1.6: Mean age of population, census of 2001
a) total population
b) urban population
c) rural population
Source: data of the State Statistics Service of Ukraine
44 -- 46,5 41,5 -- 44 38,9 -- 41,5 36,4 -- 38,9 33,9 -- 36,4 Ukraine – 38.4 years max – 41.4 years min – 34.5 years difference – 6.9 years Ukraine – 33.7 years max – 39.5 years min – 33.9 years difference – 5.6 years 44 -- 46,5 41,5 -- 44 38,9 -- 41,5 36,4 -- 38,9 33,9 -- 36,4 44 -- 46,5 41,5 -- 44 38,9 -- 41,5 36,4 -- 38,9 33,9 -- 36,4 Ukraine – 39.7 years max – 46.5 years min – 34.4 years difference – 12.1 years
On the other hand, the rural population is very old (Figure 1.6c). The variation is also large, 12 years for the oldest inhabitants in the North. This is because the northern regions of the former evacuation zone (after the Chernobyl disaster) are populated solely by returned elderly. Therefore, the least painful ageing problem is in the West Ukraine.
The changing age and gender structure of the population has significant social consequences. If
current trends persist, not only will the elderly make up a larger proportion of the population in the long run, but the absolute number of those over 60 will be greater than today. In the short term, the decline in Ukraine’s population may imply a lower overall health expenditure. However, these will be offset by a rise in demand for health services for the ageing in the long run.
The ethnic composition has changed as well. In the 1989 census, Ukrainians formed the largest ethnic group, comprising 72.7% of the total population, while 22.1% were Russians. In the 2001 census, these figures were 77.8% and 17.3% respectively. Alternatively, the proportion of non-Slavic nationalities increased, namely: Tatars – by 5.3 times, Armenians – by 1.8 times, and the proportion of other minorities either decreased or remained stable.
The official state language is Ukrainian, an Eastern Slavonic language written in the Cyrillic script. At the same time Russian is widely spoken by Ukrainians and by minorities, particularly in urban areas of the East and South.
1.4.3 Fertility
The total fertility rate (TFR) in Ukraine is way below the replacement level. It declined from 1.9 in 1988 to its minimum, 1.1, in the beginning of the 2000s (Figure 1.7). Several theories have been proposed to explain this sharp decline. Sergii Pirozhkov (2004) believes that such a low fertility level is the result of a deep economic crisis and changes in social and psychological stereotypes. This point of view is supported by others (Franatsuz, 2008), who consider the
Figure 1.7: Total fertility rate in Ukraine, 1988-2009
replacement level 1 1,2 1,4 1,6 1,8 2 2,2 T F R year
Source: Calcualtion of the State Statistics Committee of Ukraine.
transitional crisis - with its political, moral and economic consequences – to be the main reason for the decline in fertility. At the same time, Pirozhkov argues that the decline in fertility cannot be solely a result of economic changes. Ukraine experiences the same dynamics as more developed countries, and declines in fertility may be a consequence of a second demographic transition similar to that experienced in the developed West. The tendency of having small families will most likely continue as women become more educated, move towards having children at an older age, and with increased access to contraception and other family planning information.
When looking at the regional variation of TFR (Figure 1.8) one can see some clear cut-off between the western part and the rest of Ukraine, which is similar to the one identifying level of urbanization (Figure 1.4). It shows that birth rates remain relatively high in rural area while, in cities, women’s empowerment and obstacles to creating a family have a negative impact on fertility.
Figure 1.8: Total fertility rate by region, 2002
Source: data of the State Statistics Service of Ukraine
1.4.4 Migration
Migration has always played an important role in shaping the demographic and socio-economic situation in Ukraine. One of its characteristics in the Soviet period was its large scale. The annual migration exchange among the Ukrainian population and others republics sometimes reached 1.5 mln persons (Pirozhkov, 2004). The high level of migration mobility was a consequence of
���� ���� ���� ���� ���� ���� ��� ���� ���� ���� ���� ���� ���� ���� ���� ���� ���� ���� ���� ���� ���� ���������� ��������� ������� ��������� ����������� ��������� ���� �������� ���������������� ������������ ����������� ���������� ��������� ����������� ������� ����������� ������ ������ ������������� ������� ���� ���� ���� ���� ���� ���� ��������������� �������� ��������� �������� ���������� ������������ ���������������� >1,28 (8) 1,27 to 1,28 (2) 1,18 to 1,27 (3) 1,06 to 1,18 (8) <1,06 (6)
unifying life conditions and guaranteeing work throughout the entire Soviet Union (Pozniak, 2007). Another characteristic was that the number of arrivals to Ukraine was usually larger than number of departures.
During the 1960s-80s net migration was around ±100 thousand persons per year. For most of this time it was positive, providing around 5-10% of the total increase in population. According to the last Soviet Union census of 1989, 44.4% of Ukraine’s population had changed their place of living at least once during their life. At the same time around 14% were born outside of Ukraine (Pozniak, 2007). At the end of the 20th century there was also a tendency of decreasing
interregional differences in the migration situation.
One may divide the period of independence into several phases (Figure 1.9). In the years before the collapse, migration processes were inert, due to the Soviet system, though positive net migration was higher than the 80s and was accelerating. In 1991 the incoming stream increased by 3.3 times, and in 1992 by 6.5 (Pirozhkov, 2004).
During the period of transition to market economy, migration processes underwent changes as well. The main characteristics of these changes were: a decrease in population mobility, a reduction in migration connections with former republics of the Soviet Union, the emergence of new destinations, the acquisition of family migration characteristics, an increase in the mean age of migrants, negative net migration and increasing interregional differences (Pozniak, 2007).
Figure 1.9: Net migration in Ukraine, 1990-2007
Source: data of the State Statistic Service of Ukraine.
Beginning in 1994, international migration started to contribute to the decrease in the population of Ukraine. During the ten years from 1994 to 2004, Ukraine lost 745 thousand people due to an excess in emigration, according to official statistics (Pozniak, 2007). This
-160 -120 -80 -40 0 40 80 120 160 200 240 280 tho us a nd pe op le
number, which may be underestimated, represents almost twenty percent of the total population decline during the same years.
In general, migration mobility (internal and international) has decreased in comparison to Soviet times, which is explained by the economic crisis and caused by fears of unemployment and feeling of insecurity. With the emergence of independent states, legislations, currency, and the official language became more barriers for those willing to move.
The most active migration exchange of Ukraine in all times was with its neighbours, primarily Russia and Belarus. Migration connections with the Baltic States almost disappeared; and with the Caucasus Republics, it became one-way (to Ukraine). With the fall of the “iron curtain”, three main destination countries (among non-CIS countries) for emigrants from Ukraine became Israel, Germany and the USA. Fourth place was occupied by Canada until 2004, when it was pushed behind by Poland, Czech Republic, Hungary, and China (Pozniak, 2007).
As for arrivals to Ukraine, the main streams are currently coming from Moldova, Russia, Hungary, Israel, and Belarus (Pozniak, 2007).
Having fewer employment opportunities in Ukraine, people are also embarking on a vast labour migration to the neighbouring countries. Western inhabitants are heading to the European Union, while industrial workers from the east are mostly seeking for higher salaries in the Russian Federation. According to the survey on labour migration from 2008 (Pozniak, 2012), 40% of Ukrainians go to Russia, 22.3% to Italy, 9.1% to Poland, 8.7% to the Czech Republic and the remaining workers are hosted by Portugal, Spain, Hungary and other countries of the EU. Men are usually employed in construction, and women in housekeeping, construction, and commerce. Only a small percent of Ukrainian emigrants work in an intellectual activity. Most importantly, the representation of all regions in this type of migration is uniform.
1.5 Mortality patterns and justification for a study
Given the low fertility and prevailing out-migration Ukraine faces a problem of maintaining its population size. This is a difficult task, because even though indirect loses are high, direct loses are even higher. Mortality rates are high, particularly among the most economically important group: the working age population. The health of the population is worsening. These processes are reflected in life expectancy at birth, which is a summary measure of a population’s ability to survive. Amartya Sen (1998), the Nobel economist, also insists that mortality is a key indicator of economic success.
Ukraine failed to achieve the target life expectancy (LE) of 70 years by 2005, set by the Program of Action adopted by the International Conference for Population Development (MOH & UNFPA 2003). However, for the first time during the entire period of independence, life expectancy in 2010 exceeded 70 years (70.3 years). Considerable effort will be required to achieve the next target of 75 years by 2015.
Mortality problems are the most acute among all demographic problems of modern Ukraine, and the health of the population has been constantly worsening since Ukraine gained independence. However a close look at the data verifies that deterioration started even earlier and gradual disparities between the USSR and economically developed countries appeared half a century ago.
The current level of mortality rates is a result of numerous fluctuations that happened over the last few decades. Before the Second World War, life expectancy in Ukraine was much lower than in developed countries. However, thanks to success in medicine and large-scale preventive measures that didn’t require considerable efforts it was possible to catch up with those states.
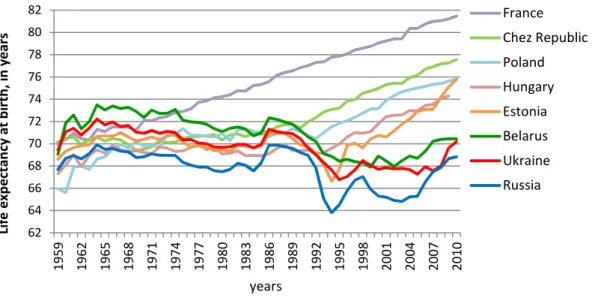
Nevertheless, beginning in the 60th, these reserves exhausted themselves and mortality started
to gradually rise. In fact, Ukraine is one of the few countries in the world that had higher life expectancy in the 1960s than it has today. By the early 1960s, life expectancy in Ukraine was much higher than in the United States and nearly equal to that observed in France.
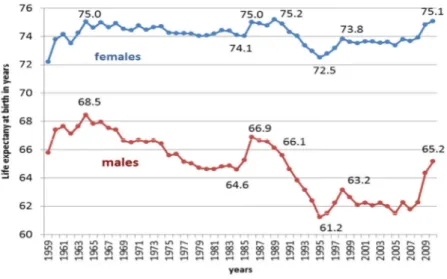
In the mid-1980s, Ukraine started lagging behind European countries as a large result of increased mortality due to cardiovascular diseases and injuries, especially among working age males (Figure 1.10). Death rates were constantly increasing with the exception of the short period marked by Gorbachev’s anti-alcohol campaign (Pirozhkov, 2004; Meslé and Vallin, 2012).
Figure 1.10: Life expectancy at birth for males and females, 1959-2009, Ukraine