HAL Id: hal-03214427
https://hal.archives-ouvertes.fr/hal-03214427
Submitted on 1 May 2021
HAL is a multi-disciplinary open access
archive for the deposit and dissemination of sci-entific research documents, whether they are pub-lished or not. The documents may come from teaching and research institutions in France or abroad, or from public or private research centers.
L’archive ouverte pluridisciplinaire HAL, est destinée au dépôt et à la diffusion de documents scientifiques de niveau recherche, publiés ou non, émanant des établissements d’enseignement et de recherche français ou étrangers, des laboratoires publics ou privés.
Head-Group Charge, and Surface Coverage, from
Molecular Dynamics Simulations, X-ray Photoelectron
Spectroscopy, and Fourier Transform Infrared
Spectroscopy
Solène Lecot, Antonin Lavigne, Zihua Yang, Thomas Géhin, Claude Botella,
Vincent Jousseaume, Yann Chevolot, Magali Phaner-Goutorbe, Christelle
Yeromonahos
To cite this version:
Solène Lecot, Antonin Lavigne, Zihua Yang, Thomas Géhin, Claude Botella, et al.. Arrangement of Monofunctional Silane Molecules on Silica Surfaces: Influence of Alkyl Chain Length, Head-Group Charge, and Surface Coverage, from Molecular Dynamics Simulations, X-ray Photoelectron Spec-troscopy, and Fourier Transform Infrared Spectroscopy. Journal of Physical Chemistry C, American Chemical Society, 2020, 124 (37), pp.20125-20134. �10.1021/acs.jpcc.0c05349�. �hal-03214427�
Influence of the Alkyl Chain Length, Head-Group Charge and Surface
Coverage, from Molecular Dynamics Simulations, X-Ray Photoelectron
Spectroscopy and Fourier Transform Infrared Spectroscopy Analysis.
Solène Lecot, Antonin Lavigne, Zihua Yang, Thomas Géhin, Claude Botella, Vincent Jousseaume, Yann Chevolot, Magali Phaner-Goutorbe, and Christelle Yeromonahos
J. Phys. Chem. C, Just Accepted Manuscript • DOI: 10.1021/acs.jpcc.0c05349 • Publication Date (Web): 21 Aug 2020
Downloaded from pubs.acs.org on August 25, 2020
Just Accepted
“Just Accepted” manuscripts have been peer-reviewed and accepted for publication. They are posted online prior to technical editing, formatting for publication and author proofing. The American Chemical Society provides “Just Accepted” as a service to the research community to expedite the dissemination of scientific material as soon as possible after acceptance. “Just Accepted” manuscripts appear in full in PDF format accompanied by an HTML abstract. “Just Accepted” manuscripts have been fully peer reviewed, but should not be considered the official version of record. They are citable by the Digital Object Identifier (DOI®). “Just Accepted” is an optional service offered to authors. Therefore, the “Just Accepted” Web site may not include all articles that will be published in the journal. After a manuscript is technically edited and formatted, it will be removed from the “Just Accepted” Web site and published as an ASAP article. Note that technical editing may introduce minor changes to the manuscript text and/or graphics which could affect content, and all legal disclaimers and ethical guidelines that apply to the journal pertain. ACS cannot be held responsible for errors or consequences arising from the use of information contained in these “Just Accepted” manuscripts.
Arrangement of Monofunctional Silane Molecules
on Silica Surfaces: Influence of the Alkyl Chain
Length, Head-Group Charge and Surface
Coverage,
from Molecular Dynamics Simulations, X-Ray
Photoelectron Spectroscopy and Fourier Transform
Infrared Spectroscopy Analysis.
Solène Lecot§, Antonin Lavigne§, Zihua Yang§, Thomas Géhin§, Claude Botella§, Vincent
Jousseaume┴, Yann Chevolot§, Magali Phaner-Goutorbe§, Christelle Yeromonahos§* § Université de Lyon, Institut des Nanotechnologies de Lyon UMR 5270, Ecole Centrale de
Lyon, 36 avenue Guy de Collongue, 69134 Ecully, France
┴Université Grenoble Alpes, CEA, LETI, F-38000 Grenoble, France
* Corresponding Author
Christelle Yeromonahos: christelle.yeromonahos@ec-lyon.fr, + 33 4 72 18 62 35
3 4 5 6 7 8 9 10 11 12 13 14 15 16 17 18 19 20 21 22 23 24 25 26 27 28 29 30 31 32 33 34 35 36 37 38 39 40 41 42 43 44 45 46 47 48 49 50 51 52 53 54 55
ABSTRACT
Surface chemical functionalization is used in analytical tools to immobilize biomolecules that will capture a specific analyte, but also to reduce the nonspecific adsorption. Silane monolayers are widely used to functionalize silica surfaces. Their interfacial properties are linked to the silane organization. Here we study, by Molecular Dynamics simulations, the effects of silane molecule headgroup charge, alkyl chain length, and surface coverage on the structure of silane monolayers. Four molecules are investigated: 3-aminopropyldimethylethoxysilane, n-propyldimethylmethoxysilane, octadecyldimethylmethoxysilane, tert-butyl-11-(dimethylamino(dimethyl)silyl)undecanoate. The results suggest that, while long alkyl chains straighten out and adopt a more organized structure as surfacecoverage increases, the tilt angle of short chains is independent from surface coverage. Furthermore, in the case of long alkyl chains, a charged headgroup seems to reduce the tilt angle to surface coverage dependence. The simulated alkyl chain tilt angles were qualitatively validated by infrared spectroscopy and X-ray photoelectron spectroscopy. Also, a hexagonal packing is observed in all the monolayers, but is more defined as surface coverage increases. The nematic order parameter suggests that this packing is governed by the parallel orientation of the first C-C bonds near the surface. So, even short alkyl chains, with a large tilt angle distribution, present a hexagonal packing.
3 4 5 6 7 8 9 10 11 12 13 14 15 16 17 18 19 20 21 22 23 24 25 26 27 28 29 30 31 32 33 34 35 36 37 38 39 40 41 42 43 44 45 46 47 48 49 50 51 52 53 54 55 56
Introduction
A large number of applications takes advantage of surface chemical functionalization. In particular, in the field of biosensing, the specificity of the device (the fact of capturing solely a given analyte) and the signal to noise ratio are related to surface chemistry. For example, surface chemical functionalization allows the immobilization of biomolecules that will capture specifically biomarkers (peptides, proteins, DNA) or whole organisms for diagnosis purposes.1-6 The
background signal can also be reduced thanks to the chemical functionalization of material surfaces allowing the reduction of non-specific adsorption. Among the various chemical functionalizations, silane molecules have been widely used for the modification of oxides, especially oxidized silicon surfaces (SiO2).2,3,7-9
The structure, organization and surface energies of various silane modified SiO2 surfaces have
been studied by various characterization techniques as a function of experimental parameters, in particular in the case of multifunctional silane monolayers. Atomic Force Microscopy (AFM) experiments suggested that, after deposition on SiO2 surface, silane molecules can diffuse laterally
to self-assemble either into fractal network or into liquid phase state, depending on external parameters such as temperature.10 Also, AFM studies have established that the strength of
hydrophobic interactions on a silane monolayer is strongly related to the order of the silane molecules.11 Indeed, pull-off forces resulting from hydrophobic adhesion are higher on
crystalline-like monolayers than on liquid-crystalline-like monolayers. The structure of n-alkane monolayers, with n > 12, has been extensively studied by Fourier Transform Infra-Red (FTIR) and X-Ray Diffraction (XRD) measurements.12-17 While the positions of the methyl and methylene vibration modes from
FTIR spectra yielded information on the presence of gauche defects in the alkyl chains and onthe
3 4 5 6 7 8 9 10 11 12 13 14 15 16 17 18 19 20 21 22 23 24 25 26 27 28 29 30 31 32 33 34 35 36 37 38 39 40 41 42 43 44 45 46 47 48 49 50 51 52 53 54 55
by XRD measurements. Hexagonal crystalline-like domains with an intermolecular in-plane distance of 4.7-5 Å were observed for monolayers of n-alkylsilane molecules with n > 14.13,16
Shorter n-alkylsilane monolayers were shown to present more gauche defects than the longer ones, but also a lower surface coverage.12 Also, in the case of multifunctional silane molecules, a
Multiple Transmission and Reflection Infra-Red Spectroscopy study shown that the nature of the leaving groups (Si(OMe)3, Si(OEt)3, Si(Cl)3) controls the rate of their hydrolysis, leading to very
different monolayer structures.17
As the surface coverage cannot easily be varied experimentally, Molecular Dynamics (MD) simulations are well suited to study the combined effects of surface coverage and alkyl chain length of silane molecules on alkyl chain tilt angle, gauche defects and nematic order parameter. However, only few MD simulations studies have addressed these questions. Different MD studies suggested that the order parameter of n-alkylsilane monolayers (for n > 8) increases as the alkyl chain length and the surface coverage increase, while alkyl chain tilt angles are independent of chain length and decrease as surface coverage increases.18-22 Among them, it was also shown that
perfluorodecyltrichlorosilane (FDTS) monolayers at high surface coverage present a hexagonal packing, whereas such packing was attenuated for octadecyltrichlorosilane (OTS) monolayers for the same surface coverage.18 In the present study, we demonstrate an effect of the head-group
charge and alkyl chain length (n < 18), on the organization of the monolayer.
We propose a MD simulation study on the effects of head-group charge (positive, neutral and negative), alkyl chain length (n from 3 to 18), and surface coverage (1.5 to 4.2 nm-2) on the
structure of silane monolayers. The four different silane molecules are 3-aminopropyldimethylethoxysilane (C7H19NOSi named NH3+), n-propyldimethylmethoxysilane
(C6H16OSi named CH3 short), octadecyldimethylmethoxysilane (C21H46OSi named CH3 long), and 3 4 5 6 7 8 9 10 11 12 13 14 15 16 17 18 19 20 21 22 23 24 25 26 27 28 29 30 31 32 33 34 35 36 37 38 39 40 41 42 43 44 45 46 47 48 49 50 51 52 53 54 55 56
tert-butyl-11-(dimethylamino(dimethyl)silyl)undecanoate (C19H41NO2Si, leading to COO- after
deprotection) (Table 1). The different silane monolayers were characterized by the alkyl chain tilt angle, the average number of gauche defects in the alkyl chains, the nematic order parameter for each C-C bond and its overall distribution, and the hexagonal packing of silane molecules on SiO2
surface and its persistence length. To check that the simulated morphologieswere consistent with experimental evidences, alkyl chain tilt angles were compared to experimental values obtained from FTIR-Attenuated Total Reflectance (FTIR-ATR) measurements. To this aim, four silane monolayers (one per silane molecule type) were elaborated from a liquid phase process on SiO2
surfaces. The surface coverages were estimated by X-ray Photoelectron Spectroscopy (XPS) analysis.
1. Materials and methods
1-1. Experimental materials and methods
Materials. SiO2 (20 nm) / Aluminium (200 nm) / Silicon substrates were prepared by Physical
Vapor Deposition (PVD) using a 200 mm Applied Materials Endura 5500 plateform. The depositions were performed on Si (100) wafers without air break between Aluminium and SiO2.
3-aminopropyldimethylethoxysilane 95% (NH3+), n-propyldimethylmethoxysilane 95% (CH3
short) and octadecyldimethylmethoxysilane 95% (CH3 long) were purchased from ABCR.
Tert-butyl-11-(dimethylamino(dimethyl)silyl)undecanoate (leading to COO- after deprotection) was
synthesized accordingly to a protocol previously reported.23 The chemical structures of the four
molecules are shown in Table 1.
3 4 5 6 7 8 9 10 11 12 13 14 15 16 17 18 19 20 21 22 23 24 25 26 27 28 29 30 31 32 33 34 35 36 37 38 39 40 41 42 43 44 45 46 47 48 49 50 51 52 53 54 55
Table 1. The different silane molecules and surface coverage studied.
Designation of silane molecule
Silane structural formula
Surface coverage used in MD simulations (nm-2) Surface coverage estimated by XPS analysis (nm-2) CH3 long 1.5 – 3.0 – 4.2 3 Systems with
silane layer CH3 short 1.5 – 3.0 – 4.2 3
NH3+ 3.0 8
COO- 3.0 – 4.2 3
System without
silane layer Bare SiO2
Chemical surface functionalization. The substrates were cleaned by ozone/Ultraviolet treatment under oxygen flow for 30 min to remove organic contamination and to obtain a hydroxyl-terminated surface. Next, the substrates were heated at 150°C for 4 hours under nitrogen, allowed to cool to room temperature under nitrogen and then, the substrates were immersed in 10 ml dried pentane containing 90 µl of silane molecules. After 1 hour of incubation, the pentane was evaporated and the samples were heated at 150°C for 15 hours, to allow the silanization reaction. Finally, the samples were washed 10 minutes in tetrahydrofurane (THF) under sonication, and 10 minutes in ultrapure water under sonication.
3 4 5 6 7 8 9 10 11 12 13 14 15 16 17 18 19 20 21 22 23 24 25 26 27 28 29 30 31 32 33 34 35 36 37 38 39 40 41 42 43 44 45 46 47 48 49 50 51 52 53 54 55 56
XPS analysis. XPS measurements were performed using a VSW spectrometer equipped with a monochromatized X-ray source (Al Kα 1486.6 eV) in which the angle between the incident beam and the detector was the magic angle. The angular resolution was 3°. Take-off angle was 90° relative to the substrate surface. The energetic resolution was 0.2 eV. The data analysis was performed with CasaXPS software. Si(-O)4 binding energy was set at 104 eV. A Shirley
background was subtracted on Si2p and O1s spectra when coming from bulk elements while a linear background was subtracted on C1s spectra as surface elements. Peaks were fitted by a Gauss-Lorentz curve.
FTIR-ATR analysis. FTIR-ATR was performed using a Thermo Nicolet 6700 spectrometer with a Mercury-Cadmium-Telluride (MCT) detector and a diamond crystal from 800 to 3000 cm-1.
Results were obtained by averaging 256 scans with a resolution of 4 cm-1.
1-2. Computational methods
System description. The silane molecules used are those presented in Table 1, after hydrolyzation, based on a trisilanol structure with two silanol groups remaining unreacted to behave similarly to a monofunctional silane (dimethylsilanol structure), as already reported in a previous study.24 Such
a structure was used because its force field is already known18, whereas the force field of
dimethylsilanol is not published. The systems were built following the method proposed by Roscioni et al.18 Silane molecules were initially randomly positioned on an amorphous SiO
2
surface, without explicit bonding between silane molecules and the surface, allowing their spontaneous lateral organization. As surface roughness has a strong influence on the lateral organization of silane molecules25, the parameters of amorphous SiO
2 surface published by
Roscioni et al.18 were used. Indeed, its Root Mean Square (RMS) value is close to the experimental 3 4 5 6 7 8 9 10 11 12 13 14 15 16 17 18 19 20 21 22 23 24 25 26 27 28 29 30 31 32 33 34 35 36 37 38 39 40 41 42 43 44 45 46 47 48 49 50 51 52 53 54 55
value of SiO2 thin films. Figure 1 illustrates the arrangement of the silane molecules on SiO2
surface after 100-ns MD simulations. The simulation box included water molecules with the model TIP4P. The charges of the silane head-groups were compensated with counterions (Na+ or Cl-) at
a concentration of 150 mM to mimic physiological conditions. A Lennard-Jones (LJ) wall was added at the top of the box to avoid interactions between water and the bottom side of the SiO2
surface and to prevent any surface curvature.26 The simulation box included nearly 100 000 atoms
and its dimensions are 7.8 nm x 7.8 nm x 15 nm.
3 4 5 6 7 8 9 10 11 12 13 14 15 16 17 18 19 20 21 22 23 24 25 26 27 28 29 30 31 32 33 34 35 36 37 38 39 40 41 42 43 44 45 46 47 48 49 50 51 52 53 54 55 56
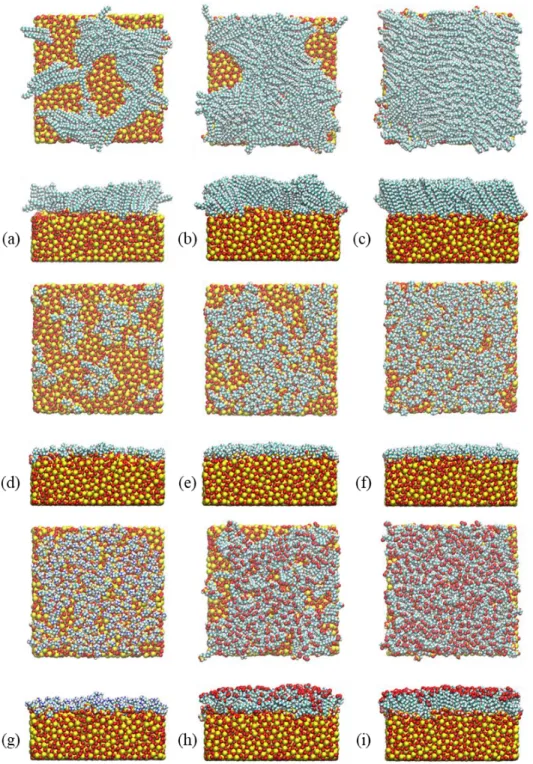
Figure 1. Arrangement of silane molecules on the amorphous SiO2 layer after 100 ns MD
simulation for different silane head-groups, alkyl chain lengths and surface coverages : (a) CH3
long c = 1.5 nm-2, (b) CH
3 long c = 3.0 nm-2, (c) CH3 long c = 4.2 nm-2, (d) CH3 short c = 1.5 nm -2, (e) CH
3 short c = 3.0 nm-2, (f) CH3 short c = 4.2 nm-2, (g) NH3+ c = 3.0 nm-2, (h) COO- c = 3.0 3 4 5 6 7 8 9 10 11 12 13 14 15 16 17 18 19 20 21 22 23 24 25 26 27 28 29 30 31 32 33 34 35 36 37 38 39 40 41 42 43 44 45 46 47 48 49 50 51 52 53 54 55
nm-2 and (i) COO- c = 4.2 nm-2. Atoms are shown in yellow (silicon), red (oxygen), cyan
(carbon), white (hydrogen) and blue (nitrogen).
Simulation details. All the simulations were performed with the Gromacs simulation package, version 5.1.327 and the VMD software package version 1.9.328 was used for visualization. Firstly,
energy minimization was applied to the system using the Steepest Descent Minimization method. Then, NVT and NPT equilibrations were carried during 100 ps each, and production simulations were performed for 100 ns. A leap-frog algorithm was used for integration of the equations of motion with a time step of 2 fs. Constraints were applied to bond parameters with a LINCS algorithm. The temperature was maintained at 300 K with a Nose-Hoover thermostat using a time constant of 0.4 ps and the pressure was kept at 1 bar with a Parrinello-Rahman barostat using a time constant of 2 ps. Water and ions were both described with OPLS all-atom force-field.29 The
parameters to describe the LJ wall were taken from a previous study.26 Force-field for both silane
molecules and SiO2 surfaces were adapted from recent studies18,19, and from the OPLS29 all-atom
force field. LJ potentials were truncated with a cut-off distance of 1 nm. Long range electrostatic interactions were calculated with the Particle Mesh Ewald method and a cut-off of 1 nm.
Analysis parameters. The following parameters were evaluated by using Gromacs functions, VMD tools and home-made Python codes. The errors bars were estimated using the standard deviation. The curves and histograms were fitted using Bézier functions.
Tilt angles. The alkyl chain tilt angle is defined as the angle between the normal to the SiO 𝛼 2
surface and the vector between the silicon and terminal atoms of the silane molecule.18
Gauche defects. Gauche defect parameter was evaluated as the proportion of C-C-C-C torsion
angles in trans conformation.30 For each silane molecule, we calculated all its C-C-C-C torsion 3 4 5 6 7 8 9 10 11 12 13 14 15 16 17 18 19 20 21 22 23 24 25 26 27 28 29 30 31 32 33 34 35 36 37 38 39 40 41 42 43 44 45 46 47 48 49 50 51 52 53 54 55 56
angle ϕ. If 150° ≤ ϕ ≤ 180°, the angle is in trans conformation and if 50° ≤ ϕ ≤ 150°, the angle is in gauche conformation. Gauche defect parameter is the ratio rtrans between the number of trans
conformations and the total of trans and gauche conformations.
Nematic order parameter. The chemical bond order parameter 𝑆𝑖2describes the orientation of the
th chemical bond, in a silane molecule, relative to the surface normal.30 It is defined as:
𝑖
𝑆𝑖2=
3 cos2𝜑𝑖― 1
2
where is the angle between the 𝜑 th CC bond and the surface normal. takes values between
-𝑖 𝑖 𝑆𝑖2
0.5 and 1, where -0.5 corresponds to a bond parallel to the surface and 1 corresponds to a bond perpendicular to the surface. We investigated the
〈
𝑆𝑖2〉
value (average on all the silane molecules of values for a given 𝑆𝑖 th bond) and the distribution (probability of each value independently2 𝑖 𝑆2 𝑆2
of the bond number in the alkyl chain). In a group of randomly oriented bonds, 〈𝑆2〉= 0 whereas means that .
〈
𝑆𝑖2〉
= 0 〈𝜑𝑖〉= 55°Radial Distribution Function (RDF). The 2D radial distribution of silane molecules was
investigated in the (x,y) plane (SiO2 plane surface), taking into account periodic boundary
conditions. It is proportional to the probability of finding the Si atom of a silane neighboring molecule for a given position on the plane, while the Si atom of the reference silane molecule is fixed at origin.18,31
2. Results and Discussion
2.1 MD simulations 3 4 5 6 7 8 9 10 11 12 13 14 15 16 17 18 19 20 21 22 23 24 25 26 27 28 29 30 31 32 33 34 35 36 37 38 39 40 41 42 43 44 45 46 47 48 49 50 51 52 53 54 55
Previous studies have shown the effects of alkyl chain length, with more than 6 carbon atoms (n > 6), at differentsurface coverages, on the structural properties of silane monolayers. In this study, we decipher the impact of charged functional head-group and alkyl chain length, with more than 3 carbon atoms (n > 3), at different surface coverages, on the structural properties of silane monolayers. MD simulations have been performed for all systems during 100 ns. The silane molecule diffusion distance is stabilized rapidly after 30 ns in all systems (Supporting information, Figure S1). After this diffusion phase, the Si atom of silane molecules can be considered as covalently fixed to the O atom of SiO2. The alkyl chain tilt angle , nematic order parameter 𝛼 〈𝑆2〉
and gauche defect fraction rtrans are correlated to the crystal packing of silane molecules. The results
are summarized in Table 2.
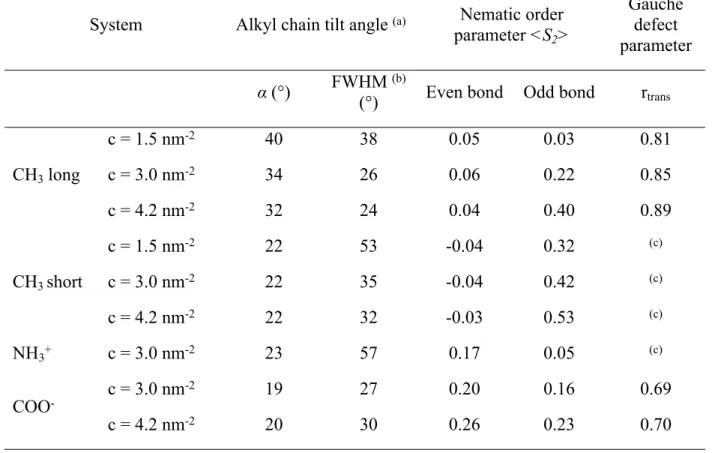
Table 2. Alkyl chain tilt Angle, Nematic Order Parameter and Gauche Defect Parameter of the Silane Monolayers Studied.
System Alkyl chain tilt angle (a) Nematic order
parameter <S2>
Gauche defect parameter
α (°) FWHM (b)
(°) Even bond Odd bond rtrans
CH3 long c = 1.5 nm-2 c = 3.0 nm-2 c = 4.2 nm-2 40 34 32 38 26 24 0.05 0.06 0.04 0.03 0.22 0.40 0.81 0.85 0.89 CH3 short c = 1.5 nm-2 c = 3.0 nm-2 c = 4.2 nm-2 22 22 22 53 35 32 -0.04 -0.04 -0.03 0.32 0.42 0.53 (c) (c) (c) NH3+ c = 3.0 nm-2 23 57 0.17 0.05 (c) COO- c = 3.0 nm -2 c = 4.2 nm-2 19 20 27 30 0.20 0.26 0.16 0.23 0.69 0.70 3 4 5 6 7 8 9 10 11 12 13 14 15 16 17 18 19 20 21 22 23 24 25 26 27 28 29 30 31 32 33 34 35 36 37 38 39 40 41 42 43 44 45 46 47 48 49 50 51 52 53 54 55 56
(a) Tilt angle distribution are depicted in Supporting Information, Figure S2. (b) Full Width at Half
Maximum (FWHM). (c) r
trans value is not relevant for small molecules with only one torsion angle.
Tilt angle. As shown in Table 2 (and Figure S2 in Supporting Information), the average tilt angle of CH3 long molecules increases from 32° to 40°, while the Full Width at Half Maximum (FWHM)
of the tilt angle distribution increases from 24° to 38°, as the surface coverage decreases from 4.2 nm-2 to 1.5 nm-2. This indicates that CH
3 long molecules straighten out and adopt a more organized
structure, as the coverage increases. These results are in agreement with previous MD studies, for long alkyl chains (n > 8)18-20, and can be explained by an increase in Van der Waals forces between
alkyl chains as their amount increases. However, very short alkyl chains (CH3 short, NH3+, n = 3)
seem to behave very differently from long ones (n > 8). The average tilt angles of NH3+ and CH3
short molecules seem to be independent of the studied surface coverages and they are similar, around 20°. Furthermore, a charged head-group seems also to influence the tilt angle to surface coverage relationship of silane molecules with long alkyl chains (n > 8). Indeed, despite a chain length of eleven carbon atoms (n = 11), no influence of surface coverage was observed on the tilt angle of COO- silane molecules. RegardingonNH
3+ and COO- molecules, repulsion between their
charged functional head-groups can explain the widening in their tilt angles distribution. The tilt angle distribution of CH3 short is larger than for CH3 long, and the tilt angle distribution of NH3+
is larger than for COO- at a givensurface coverage. It can be explained by the effect of Van der
Waals forces between long alkyl chains. These results suggest that the FWHM of tilt angle distributions increases with charged head-groups and decreases as chain length increases.
Moreover, the degree of aggregation of silane molecules (observed on Figure 1), can be related to the FWHM of the tilt angle distribution. Indeed, for a same coverage (e.g. c = 3.0 nm-2), CH
3 long 3 4 5 6 7 8 9 10 11 12 13 14 15 16 17 18 19 20 21 22 23 24 25 26 27 28 29 30 31 32 33 34 35 36 37 38 39 40 41 42 43 44 45 46 47 48 49 50 51 52 53 54 55
molecules are positioned within a single and dense aggregate, CH3 short molecules form several
smaller aggregates separated by small non-functionalized SiO2 areas, and silane molecules with
charged head-groups seem more evenly dispersed on the surface. So, both charged head-groups and short alkyl chains seem to decrease silane molecule aggregation on the SiO2 surface, while
increasing the FWHM of the tilt angle distributions. Indeed, the FWHM of the tilt angle is smaller for CH3 long monolayer (26°) than for CH3 short (35°) and NH3+ monolayers (57°) (Table 2).
Actually, silane molecules within a single dense aggregate could tend to behave similarly to increase Van der Waals interactions (leading to a low FWHM value), while more evenly dispersed silane molecules could be less impacted by the neighboring silane (leading to a high FWHM value). However, COO- and CH
3 long monolayers have similar FWHM (27° and 26° respectively),
despite very different surface distributions. This result could be explained by a balance between the opposite effects of the charged head-group and of the long alkyl chain of COO- molecules.
So, the FWHM of the tilt angle distribution of silane molecules seems to depend, in the same way as the degree of dispersion of silane molecules on SiO2 surface, on the presence of charged
head-groups and on the alkyl chain length.
Gauche defects. As shown in Table 2, CH3 long silane molecules at low surface coverage (c = 1.5
nm-2) present a lower r
trans, (0.81), which means that there are more gauche defects, than at higher
coverages (rtrans = 0.85 and rtrans = 0.89 for c = 3.0 nm-2 and c = 4.2 nm-2, respectively). These
findings are in good agreement with experimental reports found in the literature.22,32,33 COO
-molecules have more gauche defects than CH3 long molecules for the same coverage (rtrans = 0.69
and rtrans = 0.7 for c = 3.0 nm-2 and c = 4.2 nm-2, respectively). The presence of charged
head-groups results in an increase in gauche defects. As the alkyl chains of NH3+ and CH3 short silane 3 4 5 6 7 8 9 10 11 12 13 14 15 16 17 18 19 20 21 22 23 24 25 26 27 28 29 30 31 32 33 34 35 36 37 38 39 40 41 42 43 44 45 46 47 48 49 50 51 52 53 54 55 56
molecules contain only one torsion angle, the calculation of their gauche defect parameter is not relevant.
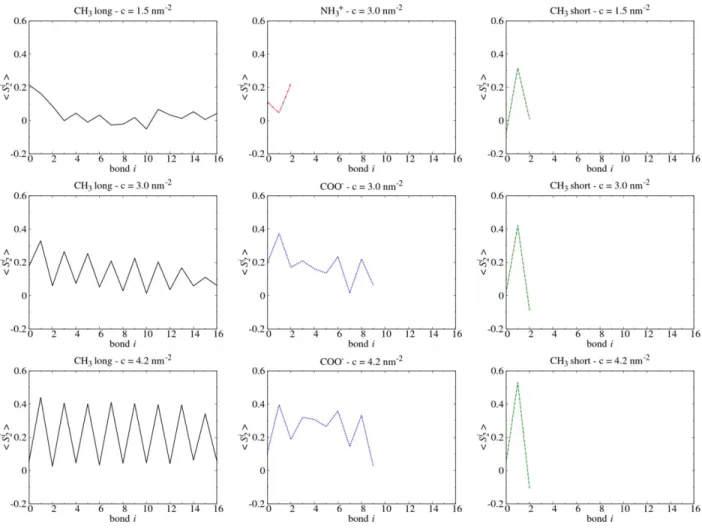
Nematic order parameter. As discussed above, in our CH3 long monolayers, alkyl chains tilt
angles are in the range of 32° to 40°. As a consequence, for perfectly parallel CH3 long molecules,
such angles should lead to values in the range of 0.98 to 1 for each odd bond and in the range 𝑆2
of -0.24 to -0.4 for each even bond. As the CH3 long surface coverage increases, the odd bond
value increases from 0.03 to 0.4, as shown in Figure 2. Also, as shown in Figure 3, the
〈
𝑆2𝑛 + 12〉
𝑆2probability distribution shows that two values for odd and even bonds (1 and -0.25) are more and more represented as surface coverage increases. These results reveal that an organization of the CH3 long molecules in a herringbone structure appears as coverage increases, in agreement with
previous studies.18,22,30 Thus, long alkyl chains (without head-groups) and high surfacecoverage
lead to a well-ordered state, allowing a preferred alkyl chain orientation with few gauche distortions. Regarding CH3 short monolayers, alkyl chain tilt angles are around 22°. As a
consequence, for perfectly parallel CH3 short molecules, such angles should lead to a value of 𝑆2
0.94 for the odd bond. Our results show that the CH3 short odd bond
〈
𝑆12〉
value is 0.4 at c = 3.0nm-2 and 0.53 at c = 4.2 nm-2, which is much higher than the odd bond values of CH 3 long
〈
𝑆2𝑛 + 12〉
(respectively 0.2 and 0.4). Even if CH3 short molecules have a large tilt angle distribution, the
order parameter relative to their second C-C bond is high, meaning that this C-C bond seems highly ordered through the monolayer. In the case of NH3+ and COO- molecules,
〈
𝑆𝑖2〉
values are close to0 for even as well as for odd bonds, and the herringbone structure is not observed (Figure 2), even at high coverage for COO- molecules. All these observations suggest that the presence of charged
head-groups results in a more disordered monolayer.
3 4 5 6 7 8 9 10 11 12 13 14 15 16 17 18 19 20 21 22 23 24 25 26 27 28 29 30 31 32 33 34 35 36 37 38 39 40 41 42 43 44 45 46 47 48 49 50 51 52 53 54 55
Figure 2. Average nematic order parameter
〈
𝑆𝑖2〉
computed for each C-C or C-N bond of the different silane monolayers. Silane molecules present a herringbone structure when〈
𝑆𝑖2〉
variesperiodically between odd and even bonds.
3 4 5 6 7 8 9 10 11 12 13 14 15 16 17 18 19 20 21 22 23 24 25 26 27 28 29 30 31 32 33 34 35 36 37 38 39 40 41 42 43 44 45 46 47 48 49 50 51 52 53 54 55 56
Figure 3. Distribution of the nematic order parameter for CH𝑆2 3 long silane monolayer at
surface coverage c = 1.5 nm-2 and c = 4.2 nm-2. 𝑆 corresponds to a bond parallel to the 2= 0
surface. For CH3 long (c = 4.2 nm-2) values around -0.25 and 1 are more probable, which
corresponds to the values for a tilt angle of 32°.𝑆2
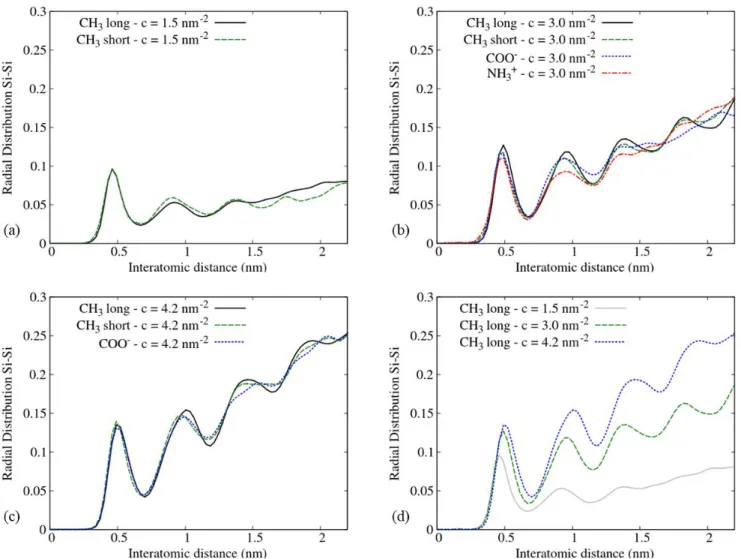
2D Radial Distribution Function. The high nematic order parameters at high surfacecoverages for CH3 long suggest the presence of a positional order in these monolayers. To assess it, the two
dimensional Radial Distribution Function (RDF) in the (x,y) plane was calculated.18,34 At initial
state, because the silane molecules are randomly positioned in the (x,y) plane, the RDF is a line whose slope is directly proportional to the surfacecoverage (Supporting Information, Figure S3). At final state, all the systems present several peaks, which means that positional order and periodicity appear even for the NH3+ silane molecules (Figure 4). As shown in Figure 5, for CH3
long silane monolayers at c = 3.0 nm-2 and c = 4.2 nm-2, the 2D maps of the RDF clearly present a
hexagonal packing. This means that each silane molecule has six closest neighbors, spaced by 0.5 nm. For c = 1.5 nm-2, the hexagonal packing is less obvious and the intensity of the first peak
decreases. It can be explained by defects (absence of molecules at some places) in the monolayer due to lowsurface coverage, as shown in Figure 1. These results are in agreement with previous MD studies.18,34 3 4 5 6 7 8 9 10 11 12 13 14 15 16 17 18 19 20 21 22 23 24 25 26 27 28 29 30 31 32 33 34 35 36 37 38 39 40 41 42 43 44 45 46 47 48 49 50 51 52 53 54 55
Figure 4. Radial distribution functions (RDF) of silane monolayers at different surface coverages: (a) c = 1.5 nm-2, (b) c = 3.0 nm-2, (c) c = 4.2 nm-2 and (d) CH
3 long at different
coverages after 100 ns MD simulation. The peaks observed at a periodic interatomic distance show that a positional order appears in the silane monolayers.
3 4 5 6 7 8 9 10 11 12 13 14 15 16 17 18 19 20 21 22 23 24 25 26 27 28 29 30 31 32 33 34 35 36 37 38 39 40 41 42 43 44 45 46 47 48 49 50 51 52 53 54 55 56
Figure 5. Two-dimensional Si – Si radial distribution functions of CH3 long silane monolayer at
different surface coverages (arbitrary units): (a) c = 1.5 nm-2, (b) c = 3.0 nm-2 and (c) c = 4.2 nm -2. A hexagonal positional order appears when surface coverage of alkylsilane molecules
increases.
Moreover, our results show that, whatever the monolayer studied, independently of alkyl chain length and head-group charge, the first peak (i.e. lattice parameter, minimum Si-Si distance between two neighboring molecules) is shifted towards higher values as surface coverage increases, reaching 0.45 nm at c = 1.5 nm-2, 0.49 nm at c = 3.0 nm-2, and 0.5 nm at c = 4.2 nm-2.
This result can be explained by the flexibility of the alkyl chains. Indeed, their higher flexibility at low surface coverage could allow Si atoms from silane molecules to position themselves closer to each other, during the diffusion phase of the MD simulation, while respecting the Van der Waals radius of the Si atom (which is 0.21 nm). For a given surface coverage, the intensity of the first peak is the same whatever the system. It means that the number of closest neighbor silane molecules does not depend on alkyl chain length and on charged head-groups. For CH3 short and
CH3 long molecules at c = 3.0 nm-2 and c = 4.2 nm-2, the RDF shows that the hexagonal packing
persists on the (x,y) plane, up to 2 nm around the origin as four peaks are well-defined on Figure
3 4 5 6 7 8 9 10 11 12 13 14 15 16 17 18 19 20 21 22 23 24 25 26 27 28 29 30 31 32 33 34 35 36 37 38 39 40 41 42 43 44 45 46 47 48 49 50 51 52 53 54 55
propagation of the hexagonal packing is limited up to 1.5 nm. Consequently, NH3+ and COO
-silane monolayers are more disordered than CH3 short and CH3 long monolayers.
To conclude, the persistence length of the hexagonal packing can be correlated with the nematic order parameter, as it increases with surface coverage, it is independent of chain length and tilt angle distribution, and it is prevented by charged head-groups. Thus, among the four investigated silane monolayers, it seems that CH3 long and CH3 short monolayers at coverages c = 3 nm-2 and
c = 4.2 nm-2, lead to the highest positional order. However, CH
3 short silane molecules have a
larger tilt angle distribution than CH3 long silane molecules. Also, the persistence length of the
hexagonal packing seems to be related to the degree of aggregation on the surface observed on Figure 1. Indeed, for a coverage of 3.0 nm-2, four peaks are well-defined on the RDF plots for CH
3
long and CH3 short monolayers, while only two peaks are well-defined for NH3+ and COO
-monolayers (Figure 4b). This result suggests that the persistence length of the hexagonal packing increases with the degree of aggregation of silane molecules.
2.2. Experimental validation of the simulated morphology
Previous experimental studies have shown that molecules with long alkyl chains are more ordered, they present smaller tilt angles, and are more densely packed on surface than molecules with short alkyl chains.11,12,35-37 Most of the experimental studies are focused on multifunctional silane
molecules, allowing silane cross-linking, whereas in the MD simulations monofunctional silane molecules are used. The monolayer morphology depends on the nature of silane molecules.36 So,
to check that our simulation results are consistent with experiments, FTIR-ATR analysis were carried out to qualitatively compare the alkyl chain tilt angle of the NH3+, COO-, CH3 short and
CH3 long monolayers. The surface coverages were estimated by XPS measurements. 3 4 5 6 7 8 9 10 11 12 13 14 15 16 17 18 19 20 21 22 23 24 25 26 27 28 29 30 31 32 33 34 35 36 37 38 39 40 41 42 43 44 45 46 47 48 49 50 51 52 53 54 55 56
XPS analysis. XPS survey spectra of the bare SiO2/Aluminium/Silicon substrate, and of the four
silanized SiO2/Aluminium/Silicon substrates are shown on Figures S4 - S8 (Supporting
Information). The bare substrate shows distinct O1s and Si2p peaks, while C1s is not detected. Silanized substrates show distinct C1s, O1s and Si2p peaks, their binding energies are reported in Table S1 (Supporting Information). C1s, O1s, and Si2p core levels are shown on Figure S5 – S8 (Supporting Information). Two contributions are present in the high resolution Si2p spectra for the silanized substrates, which are associated to Si(-O)4 and to Si(-O)1 (Table S1, Supporting
Information). The Si(-O)4 contribution is consistent with the silicon associated with oxygen in the
silica substrate. The presence of Si(-O)1 contribution comforts the success of the silanization.
Indeed, the four silanes used in this study are monovalent. The atomic percentages of the bare substrate and of the four silanized substrates are reported in Table S1 (Supporting Information). The Si:O ratio is about 1.6 for each substrate. The Si(-O)4:C ratio is consistent with the silane
molecular composition, except for CH3 short monolayer. Indeed, carbon contamination appears
systematically on CH3 short monolayer, although the silane solution is not contaminated.
The surface coverage of silanes, Γ , is estimated from the formula:38 𝑠𝑖𝑙𝑎𝑛𝑒𝑠
Γ𝑠𝑖𝑙𝑎𝑛𝑒𝑠=
𝐴𝑆𝑖( ―𝑂)1
𝐴𝑆𝑖2𝑝 𝑛𝑆𝑖𝑂2𝑧
where 𝐴𝑆𝑖( ―𝑂)1 and 𝐴𝑆𝑖2𝑝 are the normalized area of the Si(-O)1 peak and of (Si(-O)1 + Si(-O)4)
components respectively, 𝑛 is the molecular concentration of silica (22 nm-3) and is the
𝑆𝑖𝑂2 𝑧
sampling depth. z is approximated by 3λ, with λ is the mean free path in silica, equal to 3.7 nm.39,40
The surface coverages are about 3 nm-² for CH
3 short, CH3 long, and COO- monolayers, and around
8 nm-² for NH
3+. So, contrary to previous results obtained for multifunctional silanes12, the 3 4 5 6 7 8 9 10 11 12 13 14 15 16 17 18 19 20 21 22 23 24 25 26 27 28 29 30 31 32 33 34 35 36 37 38 39 40 41 42 43 44 45 46 47 48 49 50 51 52 53 54 55
coverage does not depend on the alkyl chain length. The NH3+ surface coverage is more than two
times higher than the surface coverage obtained with the other silane molecules. It might be explained by the catalytic effect of amino groups during silanization process.41,42 Also, it is worth
to be noticed that, because of sampling depth and variations in alkyl chain length, the calculation underestimates the ratio between the surface coverage of short alkyl chains (CH3 short or NH3+)
and long alkyl chains (CH3 long or COO-).
FTIR-ATR analysis. It is well-known that the methylene asymmetric stretching mode is shifted to the lower frequency region as the alkyl chain order increases.11,17,43,44 Moreover, several studies
combining infrared spectroscopy, ellipsometry and AFM show that an increase in the alkyl chain order, or a shift to lower frequency region, is associated with a decrease in the alkyl chain tilt angle.12, 44
The FTIR-ATR spectra of the COO-, CH
3 long and NH3+ monolayers, shown in Figure 6, are
dominated by the methylene symmetric stretching mode (d+, in the range 2854 cm-1 - 2858 cm-1)
and the methylene asymmetric stretching (d-, in the range 2924 cm-1 - 2928 cm-1) mode. These
modes are not observed on the CH3 short monolayer, likely because the CH3 short molecule has
fewer methylene groups than the CH3 long and COO- molecules. However, despite NH3+ and CH3
short molecules have the same number of methylene groups, d+ and d- modes are observed on the
NH3+ monolayer. It can be explained by the higher surface coverage obtained with NH3+ molecules
than with CH3 short molecules (8 nm-2 vs. 3 nm-2). Our results show a shift to low frequencies, by
up to 4 cm-1, for d- modes of CH
3 long (2929 cm-1), NH3+ (2927 cm-1), and COO- (2925 cm-1)
monolayers. Such a shift suggests a higher tilt angle for CH3 long than for NH3+ and COO
-monolayers.44 These results are in agreement with our tilt angles obtained by MD simulation.
Indeed, the tilt angle of CH3 long molecules at a coverage of 3.0 nm-2 is 34°, while the tilt angle 3 4 5 6 7 8 9 10 11 12 13 14 15 16 17 18 19 20 21 22 23 24 25 26 27 28 29 30 31 32 33 34 35 36 37 38 39 40 41 42 43 44 45 46 47 48 49 50 51 52 53 54 55 56
of NH3+ molecules at a coverage of 4.2 nm-2 and the one of COO- at a coverage of 3.0 nm-2 are
close, around 12°-19° (Supporting Information, Figure S2).
Figure 6. FTIR-ATR spectra of the four silanized surfaces.
The methyl asymmetric stretching mode (r- in plane, 2966 cm-1) is clearly resolved on the CH 3
short monolayer only, while the methyl symmetric stretching (r+, 2878 cm-1 and r+FR 2940 cm-1)
is clearly resolved on CH3 long monolayer, but not on CH3 short monolayer. Such results have
already been observed from polarized FTIR-ATR experiments.12 In polarized FTIR-ATR
experiments, the r- mode is observed only if the alkyl chains are nearly perpendicular to the surface,
while the r+ mode is observed for alkyl chains with higher tilt angles only. In the present study, we
cannot calculate the different tilt angles because we use an unpolarized FTIR-ATR equipment. However, our results suggest that a change in orientation occurs between CH3 long and CH3 short
molecules. Indeed as surface coverage is the same for CH3 short and CH3 long monolayers, if there
were no change in the average alkyl chain tilt angle, then the r- and r+ peak areas of these two
monolayers would be the same (with different widths, depending on the tilt angle distribution). By assuming that the presence of the r- mode on the CH
3 short system is not entirely linked to the
carbon contamination, these experimental results are qualitatively in agreement with tilt angles
3 4 5 6 7 8 9 10 11 12 13 14 15 16 17 18 19 20 21 22 23 24 25 26 27 28 29 30 31 32 33 34 35 36 37 38 39 40 41 42 43 44 45 46 47 48 49 50 51 52 53 54 55
from our MD simulations, which suggest that the tilt angle of CH3 long molecules is 34° while the
one of CH3 short molecules is 22°.
Previous experimental studies have shown that, in the case of multifunctional silane molecules, the surface coverage increases, and the tilt angle decreases, as the alkyl chain length increases.12
Our experimental and simulated results suggest that, in the case of monofunctional silane molecules, likely because of the absence of intermolecular bonds, the alkyl chain length has no significant effect on the surface coverage. However, the average chain tilt angle increases as the chain length increases.
3. Conclusion
This study shows that the ordered state of the silane monolayer depends on the alkyl chain length (n from 3 to 18), head-group charge, and on the surface coverage. Indeed, long alkyl chains and high coverages lead to more organized self-assembled silane monolayers, with a narrow tilt angle distribution centered on a preferred orientation, and few gauche distortions. Also, for given alkyl chain length and surface coverage, charged silane molecules lead to a more disordered state than neutral silane molecules, with a larger tilt angle distribution. Long alkyl chains (n > 8) were reported to have a tilt angle independent of chain length and to be affected by surface coverage. On the contrary, short alkyl chains (n = 3) behave very differently, since their tilt angle seems to be independent from surface coverage. Furthermore, a charged head-group seems to influence the tilt angle to surface coverage relationship of long alkyl chain (n > 8). Indeed no influence of surface coverage on the COO- (n = 11) tilt angle was observed. The differences between the simulated tilt
angles, depending on the nature of silane molecules, are validated by FTIR-ATR analysis.
3 4 5 6 7 8 9 10 11 12 13 14 15 16 17 18 19 20 21 22 23 24 25 26 27 28 29 30 31 32 33 34 35 36 37 38 39 40 41 42 43 44 45 46 47 48 49 50 51 52 53 54 55 56
Moreover, our results suggest that a hexagonal packing is observed in all the studied silane monolayers. However, whatever the alkyl chain length, an increase in surface coverage lead to the more marked appearance of the hexagonal packing. Nematic order parameter values show that such packing is governed by the parallel orientation of the first C-C bonds of the silane molecules, near the SiO2 surface. Thus, even short alkyl chain (CH3 short), despite a large tilt angle
distribution, present a well-defined hexagonal packing at high coverage.
Surface chemical functionalization is used in analytical tools as a mean to immobilize biomolecules that will capture a specific analyte, but also to reduce the non-specific adsorption. This work could further help to understand the influence of the nature of silane molecules on the arrangement of the silane monolayer on SiO2 surfaces, and on subsequent biomolecule
interactions, to design more efficient analytical tools.
ASSOCIATED CONTENT
The following files are available free of charge.
Diffusion distance of silane molecules. Tilt angle distributions. Sub-coverages for each system studied at 3 nm-² and 1.5 nm-². Radial distribution functions of CH
3 long silane molecules. XPS
spectra. XPS binding energy and atomic percentages. (PDF) AUTHOR INFORMATION Corresponding Author *Email: christelle.yeromonahos@ec-lyon.fr 3 4 5 6 7 8 9 10 11 12 13 14 15 16 17 18 19 20 21 22 23 24 25 26 27 28 29 30 31 32 33 34 35 36 37 38 39 40 41 42 43 44 45 46 47 48 49 50 51 52 53 54 55
Author Contributions
The manuscript was written through contributions of all authors. All authors have given approval to the final version of the manuscript.
Funding Sources
This work was supported by the Young Researcher ANR PORIDG project, grant ANR-18-CE09-0006 of the French Agence Nationale de la Recherche. This work was granted access to the HPC resources of CINES under the allocation 2019-A0070711100 made by GENCI. Also, this work was supported by the PMCS2I - supercomputer Newton from Ecole Centrale de Lyon, France, member of the FLMSN.
ACKNOWLEDGMENT
The authors thank Laurent Pouilloux, Anne Cadiou, and Laurent Carrel for support on PMCS2I resources.
REFERENCES
(1) Beaucage, S. L. Strategies in the preparation of DNA oligonucleotide arrays for diagnostic applications. Curr. Med. Chem. 2001, 8, 1213-1244.
(2) Beier, M.; Hoheisel, J. D. Versatile derivatisation of solid support media for covalent bonding on DNA-microchips. Nucleic Acids Res. 1999, 27, 1970-1977.
(3) Wang, Y.; Cai, J.; Rauscher, H.; Behm, R. J.; Goedel, W. A. Maleimido‐Terminated Self‐Assembled Monolayers. Chem. Eur. J. 2005, 11, 3968-3978.
3 4 5 6 7 8 9 10 11 12 13 14 15 16 17 18 19 20 21 22 23 24 25 26 27 28 29 30 31 32 33 34 35 36 37 38 39 40 41 42 43 44 45 46 47 48 49 50 51 52 53 54 55 56
(4) Luderer F.; Walschus U. Immobilization of Oligonucleotides for Biochemical Sensing by Self-Assembled Monolayers: Thiol-Organic Bonding on Gold and Silanization on Silica Surfaces.
Wittmann C. (eds) Immobilisation of DNA on Chips I. Topics in Current Chemistry Springer, Berlin Heidelberg 2005, 260, 37-56.
(5) Hitaishi, V. P. ; Clement, R. ; Bourassin, N. ; Baaden, M. ; De Poulpiquet, A. ; Sacquin-Mora, S. ; Ciaccafava, A. ; Lojou, E. Controlling redox enzyme orientation at planar electrodes. Catalysts 2018, 8, 192.
(6) Ruan, M.; Seydou, M.; Noel, V.; Piro, B.; Maurel, F.; Barbault, F. Molecular dynamics simulation of a RNA aptasensor. J. Phys. Chem. B 2017, 121, 4071-4080.
(7) Chu-jiang, C.; Zhi-gang, S.; Yu-shan, X.; Shu-lin, M. Surface topography and character of γ-aminopropyltriethoxysilane and dodecyltrimethoxysilane films adsorbed on the silicon dioxide substrate via vapour phase deposition. J. Phys. D: Appl. Phys. 2006, 39, 4829-4837.
(8) Halliwell, C. M.; Cass, A. E. A factorial analysis of silanization conditions for the immobilization of oligonucleotides on glass surfaces. Anal. Chem. 2001, 73, 2476-2483.
(9) Al-Hajj, N.; Mousli, Y.; Miche, A.; Humblot, V.; Hunel, J.; Heuzé, K.; Buffeteau, T.; Genin, E.; Vellutini, L. Influence of the Grafting Process on the Orientation and the Reactivity of Azide-Terminated Monolayers onto Silica Surface. Appl. Surf. Sci. 2020, 146778.
(10) Britt, D. W.; Hlady, V. An AFM study of the effects of silanization temperature, hydration, and annealing on the nucleation and aggregation of condensed OTS domains on mica. J. Colloid
Interface Sci. 1996, 178, 775-784. 3 4 5 6 7 8 9 10 11 12 13 14 15 16 17 18 19 20 21 22 23 24 25 26 27 28 29 30 31 32 33 34 35 36 37 38 39 40 41 42 43 44 45 46 47 48 49 50 51 52 53 54 55
(11) Yeon, H.; Wang, C.; Van Lehn, R. C.; Abbott, N. L. Influence of Order within Nonpolar Monolayers on Hydrophobic Interactions. Langmuir 2017, 33, 4628-4637.
(12) Barrett, A.; Petersen, P. B. Order of dry and wet mixed-length self-assembled monolayers. J.
Phys. Chem. C 2015, 119, 23943-23950.
(13) Steinrück, H. G.; Will, J.; Magerl, A.; Ocko, B. M. Structure of n-Alkyltrichlorosilane Monolayers on Si (100)/SiO2. Langmuir 2015, 31, 11774-11780.
(14) Wen, K.; Maoz, R.; Cohen, H.; Sagiv, J.; Gibaud, A.; Desert, A.; Ocko, B. M. Postassembly chemical modification of a highly ordered organosilane multilayer: New insights into the structure, bonding, and dynamics of self-assembling silane monolayers. ACS nano 2008, 2, 579-599.
(15) Koga, T.; Honda, K.; Sasaki, S.; Sakata, O.; Takahara, A. Phase transition of alkylsilane monolayers studied by temperature-dependent grazing incidence X-ray diffraction. Langmuir 2007, 23, 8861-8865.
(16) Ito, Y.; Virkar, A. A.; Mannsfeld, S.; Oh, J. H.; Toney, M.; Locklin, J.; Bao, Z. Crystalline ultrasmooth self-assembled monolayers of alkylsilanes for organic field-effect transistors. J. Am.
Chem. Soc. 2009, 131, 9396-9404.
(17) Naik V.V.; Städler R.; Spender N.D. Effect of leaving group on the structures of alkylsilane SAMs. Langmuir 2014, 30, 14824-14831.
(18) Roscioni, O. M.; Muccioli, L.; Mityashin, A.; Cornil, J.; Zannoni, C. Structural characterization of alkylsilane and fluoroalkylsilane self-assembled monolayers on SiO2 by molecular dynamics simulations. J. Phys. Chem. C 2016, 120, 14652-14662.
3 4 5 6 7 8 9 10 11 12 13 14 15 16 17 18 19 20 21 22 23 24 25 26 27 28 29 30 31 32 33 34 35 36 37 38 39 40 41 42 43 44 45 46 47 48 49 50 51 52 53 54 55 56
(19) Castillo, J. M.; Klos, M.; Jacobs, K.; Horsch, M.; Hasse, H. (2015). Characterization of alkylsilane self-assembled monolayers by molecular simulation. Langmuir 2015, 31, 2630-2638. (20) Black, J. E.; Iacovella, C. R.; Cummings, P. T.; McCabe, C. Molecular dynamics study of alkylsilane monolayers on realistic amorphous silica surfaces. Langmuir 2015, 31, 3086-3093. (21) Black, J. E.; Summers, A. Z.; Iacovella, C. R.; Cummings, P. T.; McCabe, C. Investigation of the Impact of Cross-Polymerization on the Structural and Frictional Properties of Alkylsilane Monolayers Using Molecular Simulation. Nanomaterials 2019, 9, 639.
(22) Ewers, B.W.; Batteas, J.D. Molecular dynamics simulations of alkylsilane monolayers on silica nanoasperities: impact of surface curvature on monolayer structure and pathways for energy dissipation in tribological contacts. J. Phys. Chem. C 2012, 116, 25165-25177.
(23) Dugas, V.; Depret, G.; Chevalier, Y.; Nesme, X.; Souteyrand, É. Immobilization of single-stranded DNA fragments to solid surfaces and their repeatable specific hybridization: covalent binding or adsorption? Sens. Actuator B-Chem. 2004, 101, 112-121.
(24) Lecot S.; Chevolot Y.; Phaner-Goutorbe M.; Yeromonahos C. Impact of silane monolayers on the adsorption of streptavidin on silica and its subsequent interactions with biotin: molecular dynamics and steered molecular dynamics simulations. J. Phys. Chem. B 2020, 124, 6786-6796. (25) Roscioni, O. M.; Muccioli, L.; Della Valle, R. G.; Pizzirusso, A.; Ricci, M.; Zannoni, C. Predicting the anchoring of liquid crystals at a solid surface: 5-cyanobiphenyl on cristobalite and glassy silica surfaces of increasing roughness. Langmuir 2013, 29, 8950-8958.
(26) Kitabata, M.; Taddese, T.; Okazaki, S. Molecular dynamics study on wettability of poly
3 4 5 6 7 8 9 10 11 12 13 14 15 16 17 18 19 20 21 22 23 24 25 26 27 28 29 30 31 32 33 34 35 36 37 38 39 40 41 42 43 44 45 46 47 48 49 50 51 52 53 54 55
(27) Van Der Spoel, D.; Lindahl, E.; Hess, B., Groenhof, G.; Mark, A. E.; Berendsen, H. J. GROMACS: fast, flexible, and free. J. Comput. Chem. 2005, 26, 1701-1718.
(28) Humphrey, W.; Dalke, A.; Schulten, K. VMD: visual molecular dynamics. J. Mol. Graph. 1996, 14, 33-38.
(29) Jorgensen, W. L.; Maxwell, D. S.; Tirado-Rives, J. Development and testing of the OPLS all-atom force field on conformational energetics and properties of organic liquids. J. Am. Chem. Soc. 1996, 118, 11225-11236.
(30) Schulze, E.; Stein, M. Simulation of Mixed Self-Assembled Monolayers on Gold: Effect of Terminal Alkyl Anchor Chain and Monolayer Composition. J. Phys. Chem. B 2018, 122, 7699-7710.
(31) Anvari, M. H.; Liu, Q.; Xu, Z.; Choi, P. Molecular Dynamics Study of Hydrophilic Sphalerite (110) Surface as Modified by Normal and Branched Butylthiols. Langmuir 2018, 34, 3363-3373. (32) Parikh, A. N.; Allara, D. L.; Azouz, I. B.; Rondelez, F. An intrinsic relationship between molecular structure in self-assembled n-alkylsiloxane monolayers and deposition temperature. The
J. Phys. Chem. 1994, 98, 7577-7590.
(33) Allara, D. L.; Nuzzo, R. G. Spontaneously organized molecular assemblies. 2. Quantitative infrared spectroscopic determination of equilibrium structures of solution-adsorbed n-alkanoic acids on an oxidized aluminum surface. Langmuir 1985, 1, 52-66.
(34) Deetz, J. D.; Ngo, Q.; Faller, R. Reactive Molecular Dynamics Simulations of the Silanization of Silica Substrates by Methoxysilanes and Hydroxysilanes. Langmuir 2016, 32, 7045-7055.
3 4 5 6 7 8 9 10 11 12 13 14 15 16 17 18 19 20 21 22 23 24 25 26 27 28 29 30 31 32 33 34 35 36 37 38 39 40 41 42 43 44 45 46 47 48 49 50 51 52 53 54 55 56
(35) Porter, M. D.; Bright, T. B.; Allara, D. L.; Chidsey, C. E. Spontaneously organized molecular assemblies. 4. Structural characterization of n-alkyl thiol monolayers on gold by optical ellipsometry, infrared spectroscopy, and electrochemistry. J. Am. Chem. Soc. 1987, 109, 3559-3568.
(36) Ulman, A. Formation and structure of self-assembled monolayers. Chem. Rev. 1996, 96, 1533-1554.
(37) Pujari, S. P.; Scheres, L.; Marcelis, A. T. ; Zuilhof, H. Covalent surface modification of oxide surfaces. Angew. Chem. Int. Ed. 2014, 53, 6322-6356.
(38) Shircliff, R. A.; Martin, I. T.; Pankow, J. W.;Fennell, J.; Stradins, P.; Ghirardi, M. L.; Cowley, S.W.; Branz, H. M. High-resolution X-ray photoelectron spectroscopy of mixed silane monolayers for DNA attachment. ACS Appl. Mater. Interfaces 2011, 3, 3285-3292.
(39) Vickerman, J. C.; Gilmore, I. S. (Eds.) Surface analysis: the principal techniques. John Wiley
& Sons. 2011.
(40) Tanuma, S.; Powell, C. J.; Penn, D. R. Calculations of electron inelastic mean free paths (IMFPS). IV. Evaluation of calculated IMFPs and of the predictive IMFP formula TPP‐2 for electron energies between 50 and 2000 eV. Surf. Interface Anal. 1993, 20, 77-89.
(41) Kinkel, J. N.; Unger, K. K. Role of solvent and base in the silanization reaction of silicas for reversed-phase high-performance liquid chromatography. J. Chromatogr. A, 1984, 316, 193-200. (42) Fadeev, A. Y.; McCarthy, T. J. Self-assembly is not the only reaction possible between alkyltrichlorosilanes and surfaces: monomolecular and oligomeric covalently attached layers of dichloro-and trichloroalkylsilanes on silicon. Langmuir 2000, 16, 7268-7274.
3 4 5 6 7 8 9 10 11 12 13 14 15 16 17 18 19 20 21 22 23 24 25 26 27 28 29 30 31 32 33 34 35 36 37 38 39 40 41 42 43 44 45 46 47 48 49 50 51 52 53 54 55
(43) Ardès-Guisot, N.; Durand, J. O.; Granier, M.; Perzyna, A.; Coffinier, Y.; Grandidier, B.; Wallart X.; Stievenard, D. Trichlorosilane isocyanate as coupling agent for mild conditions functionalization of silica-coated surfaces. Langmuir 2005, 21, 9406-9408.
(44) Nam, H.; Granier, M.; Boury, B.; Park, S.Y. Functional organotrimethoxysilane derivative with strong intermolecular π− π interaction: One-pot grafting reaction on oxidized silicon substrates. Langmuir 2006, 22, 7132-7134.
For Table of Contents Only
3 4 5 6 7 8 9 10 11 12 13 14 15 16 17 18 19 20 21 22 23 24 25 26 27 28 29 30 31 32 33 34 35 36 37 38 39 40 41 42 43 44 45 46 47 48 49 50 51 52 53 54 55 56