© The Author 2015. Published by Oxford University Press on behalf of the British Occupational Hygiene Society.
• 895
Efficacy of Two Cleaning Solutions for
the Decontamination of 10 Antineoplastic
Agents in the Biosafety Cabinets of a Hospital
Pharmacy
Marco Anastasi
1,2, Serge Rudaz
2, Thomas Queruau Lamerie
3,
Pascal Odou
3,4, Pascal Bonnabry
1,2and Sandrine Fleury-Souverain
1*
1.Department of Pharmacy, Geneva University Hospitals, Gabrielle-Perret-Gentil 4, 1211 Geneva 14, Switzerland2.School of Pharmaceutical Sciences, University of Geneva/University of Lausanne, 30, quai Ernest-Ansermet, 1211 Geneva, Switzerland 3.Department of Pharmacy, Dunkerque Hospital, 130, avenue Louis Herbeaux, BP 6 367, 59385 Dunkerque, France 4.Biopharmacy, Galenic and Hospital Pharmacy Department (EA 4481, IFR114), UFR Pharmacie, Université Lille Nord de France,
1 Rue Lefèvre, 59000 Lille, France
*Author to whom correspondence should be addressed. Tel: +41-223723978; fax:+41-223723990; e-mail: [email protected] Submitted 23 June 2014; revised 2 March 2015; revised version accepted 5 March 2015.
ABSTR ACT
Objective: This study aimed to evaluate two cleaning solutions for the chemical decontamination of antineoplastic agents on the surfaces of two biosafety cabinets routinely used for chemotherapy prepa-ration in a hospital pharmacy.
Methods: For almost 1 year (49 weeks), two different solutions were used for the weekly cleaning of two biosafety cabinets in a hospital pharmacy’s centralized cytotoxic preparation unit. The solutions evaluated were a commercial solution of isopropyl alcohol (IPA) and water (70:30, vol:vol), and a detergent solution constituted by 10–2 M of sodium dodecyl sulfate (SDS) with 20% IPA. Seven areas in each biosafety cabinet were wiped 14 times throughout the year, before and after the weekly clean-ing process, accordclean-ing to a validated procedure. Samples were analyzed usclean-ing a validated method of high-performance liquid chromatography coupled to mass spectrometry. The decontamination effi-cacy of these two solutions was tested for 10 antineoplastic agents: cytarabine, gemcitabine, metho-trexate, etoposide phosphate, irinotecan, cyclophosphamide, ifosfamide, doxorubicin, epirubicin, and vincristine.
Results: Overall decontamination efficacies observed were 82 ± 6% and 49 ± 11% for SDS solution and IPA, respectively. Higher contamination levels were distributed on areas frequently touched by the pharmacy technicians—such as sleeves and airlock handles—than on scale plates, gravimetric control hardware, and work benches. Detected contaminations of cyclophosphamide, ifosfamide, gemcitabine, and cytarabine were higher than those of the others agents. SDS solution was almost 20% more efficient than IPA on eight of the antineoplastic agents.
Conclusion: Both cleaning solutions were able to reduce contamination levels in the biosafety cabi-nets. The efficacy of the solution containing an anionic detergent agent (SDS) was shown to be generally Advance Access publication 15 May 2015
higher than that of IPA and, after the SDS cleaning procedure, biosafety cabinets demonstrated accept-able contamination levels.
KEY WORDS: antineoplastic analysis; cleaning; decontamination; detergents; hospital; occupational prevention and control; pharmacy service
IN TRODUCTION
Antineoplastic agents used in cancer therapy are substances that nonspecifically inhibit or stop cell development. These molecules are potentially haz-ardous because they do not distinguish diseased cells from healthy ones, creating undesirable side effects in patients. Healthcare professionals, such as pharmacists, oncology nurses, physicians, and technicians, there forerun a real risk of being con-taminated by antineoplastic agents during their daily routines, if they work with these compounds. From the early 1980s, several studies conducted in hospitals, industries, and pharmacies demonstrated that those occupationally involved in the prepara-tion, transport, administraprepara-tion, and elimination of antineoplastic materials were exposed to the risk of being contaminated by them (Benhamou et al.,
1986; Sorsa et al., 1988; Kiffmeyer et al., 2013). Biological monitoring studies to evaluate the effects of antineoplastic agent contamination on healthcare personnel have been published for the last 30 years, providing evidence of the exposure of healthcare professionals to antineoplastic agents. They have reviewed the effects caused by acute or prolonged exposition (Sorsa et al., 1988; Sessink et al., 1994;
Suspiro and Prista, 2011). Biological monitor-ing studies, combined with environmental studies, could be effective in investigating either the causes of contamination or the effects of preventive meas-ures (Sessink et al., 1997; Turci et al., 2011; Yoshida
et al., 2013). Results of environmental studies in hospital pharmacies highlighted the presence of antineoplastic agent contamination of work sur-faces (benches, tables, and fridge doors), materials (vials, gloves, infusion bags), and floors, but also in logistical rooms outside the background clean room (Touzin et al., 2009; Käslin et al., 2010; Kiffmeyer
et al., 2013). Based on these results, the professional associations and authorities of different countries have published guidelines to limit healthcare pro-fessionals’ exposure to contamination by hazardous
agents (NIOSH, 2004; Marcel et al., 2004; ASHP, 2006).With the objective of confining contamina-tion, the preparation of antineoplastic treatments should be carried out at separate workstations, such as in biological safety cabinets (BSC) or isolators. It is of utmost importance that an effective post drug-preparation cleaning procedure is carried out in these workstations in order to limit the accumula-tion of residual contaminaaccumula-tion, both chemical and microbiological. Several studies have been pub-lished on different cleaning procedures for surfaces contaminated by antineoplastic agents (Roberts
et al., 2006; Lee et al., 2009; Queruau Lamerie et al.,
2013; Le et al., 2013). Decontamination protocols involving sodium hypochlorite were considered effective for a variety of active ingredients, but they could damaged cleaned surfaces (need for rins-ing after use) and were potentially genotoxic (Lee
et al., 2009; Sharma et al., 2013). Hydrogen perox-ide, whether liquid or vaporized (VHP®), showed good decontamination and degradation action on 5-Fluorouracil, doxorubicin (DOX), and cyclophos-phamide (CP) (Roberts et al., 2006). The recently published efficacies of cleaning procedures involv-ing different products highlighted the importance of the presence of a surfactant in the cleaning solution (Le et al., 2013; Queruau Lamerie et al., 2013). Until now, to the best of our knowledge, no clear, practi-cal recommendations about the decontamination procedures to be adopted with antineoplastic agents have been available in the literature. A recent sys-tematic evaluation of the efficacy of several cleaning solutions on 10 antineoplastic agents on different surfaces was performed in experimental conditions (Queruau Lamerie et al., 2013).
The present work aimed to evaluate the efficacy of two cleaning solutions on the decontamination of 10 antineoplastic agents in a real-world setting. The first was an isopropyl alcohol hydroalcoholic solu-tion (IPA, brand name Klercide®) which has long been used for routine BSC cleaning procedures in our
centralized cytotoxic preparation unit. The second was a sodium dodecyl sulfate (SDS) solution, at a concen-tration of 10–2 M and with 20% IPA. The latter solution
was chosen because of the results previously obtained from the decontamination of antineoplastic agents on stainless steel and glass surfaces (Queruau Lamerie
et al., 2013). Data were provided from the results of a validated global analytical procedure involving a wip-ing step (Nussbaumer et al., 2012) followed by a liquid chromatography mass spectrometry (LC-MS/MS) analysis (Nussbaumer et al., 2010, 2012).
M ATER IALS AND M ETHODS Setting
The Geneva University Hospitals (HUG) central-ized the preparation of antineoplastic agents in its pharmacy in 2000. Two class III biosafety cabi-nets (BSC, CDC-D-2GR from Envair, Rossendale, England) are installed in a GMP class C (ISO 7) background clean room, producing antineoplas-tic preparations daily. The staff of the pharmacy’s cytotoxic unit produces more than 17 000 oncology products annually.
Chemicals and reagents Antineoplastic agents
This study was carried out using the following com-mercially available antineoplastic preparations: Vincristin Teva® (vincristine 1 mg·ml−1, VIN) and
Methotrexat Teva® (methotrexate 2.5 mg·ml−1,
MTX), purchased from Teva Pharma AG (Basel, Switzerland); Adriblastin® (doxorubicine 2 mg·ml−1,
DOX), from Pfizer AG (Zurich, Switzerland); Epirubicin Actavis Solution® (epirubicin 2 mg·ml−1,
EPI), from Actavis (Regensdorf, Switzerland); Endoxan® (cyclophosphamide reconstituted in glucose 5% at 20 mg·ml−1, CP), from Baxter AG
(Volketswil, Switzerland); Etopophos® (etoposide phosphate reconstituted in water at 20 mg·ml−1,
ETO), from Bristol-Myers Squibb SA (Baar, Switzerland); Cytosar® (cytarabine 20 mg·ml−1,
CYT), from Pfizer AG (Zürich, Switzerland); Gemzar® (Gemcitabine, reconstituted in water at 20 mg·ml−1, GEM), from Eli Lilly (Verbier, Switzerland);
Irinotecan Fresenius® (irinotecan 20 mg·ml−1, IRI),
from Fresenius Kabi AG (Stans, Switzerland); and Holoxan® (ifosfamide reconstituted in water at 40
mg·ml−1, IFO), purchased from Ebewe Pharma
(Cham, Switzerland).
The reconstitutions of Etopophos®, Gemzar®, and Holoxan® were carried out with water for injection purchased from Bichsel Laboratories (Interlaken, Switzerland). Glucose 5% for the reconstitution of Endoxan was from Sintetica-Bioren SA (Couvet, Switzerland). The internal standard (IS), [13C, 2H3]-methotrexate, was purchased from Alsachim (Illkirch, France).
Other products
The two cleaning solutions were:
1. Commercially available, sterile, hydroalco-holic solution, Klercide® (IPA: water, 70:30, vol:vol; named IPA), from Shield Medicare (Farnham, UK), was used directly in a spray form;
2. SDS purchased from Sigma-Aldrich (Steinhein, Germany) and Klercide® were used to produce the detergent cleaning solu-tion constituted by SDS 10–2 M with 20% of
Klercide® (vol:vol), and then conditioned in a spray bottle.
The LC-MS/MS analysis was performed using the following solvents and chemicals: Lichrosolv® HPLC grade acetonitrile (ACN) and ultrapure water from Merck (Darmstadt, Germany), and formic acid (FA) from Biosolve (Valkenswaard, the Netherlands).
Preparation of solutions
All solutions of antineoplastic agents (i.e. drug recon-stitutions and sample dilutions) were prepared in appropriate conditions (i.e. personal protective equip-ment and BSC) for handling hazardous compounds. Aliquots of the IS were prepared with a mixture of ACN and water (75:25, vol:vol) at 250 μg·ml−1 and stored at
−22°C for a maximum of 12 months. Stock solutions of IS were diluted on the day of analysis at 50 ng·ml−1
in ACN 20% with FA 0.1%. A main stock solution containing the 10 antineoplastic agents was prepared by diluting each component in water at a concentra-tion of 20 μg·ml−1. This solution was diluted further to
obtain five independent stock solutions at 20, 40, 200, 1000, and 4000 ng·ml−1 in ACN 20% with FA 0.1%.
diluted using the IS solution at 50 ng·ml−1, to obtain
five CS at 1, 2, 10, 50, and 200 ng·ml−1. LC-MS/MS
analyses were performed using three mobile phases: ultrapure water (A), ACN (B), and FA 1% (C). The needle and the injection loop were washed using 5% ACN in water after each injection.
LC-MS/MS analysis
Analyses were carried out using an Accela LC-MS/ MS system (Thermo Fisher Scientific Inc., Waltham, MA, USA). The operating system—consisting of a quaternary pump equipped with an online degasser, an autosampler, and a solvent platform—was coupled to a quadrupole (TSQ) Quantum Discovery mass spectrometer (MS) (Thermo Fisher Scientific Inc., Waltham, MA, USA) equipped with Ion Max electro-spray ionization (ESI). Separations were carried out on a ZOBRAX SB C18 RR 2.1 × 100 mm, 3.5 μm particle diameter column (Agilent Technologies, Waldbronn, Germany). The chromatographic system coupled to the MS operated with Xcalibur® software (Thermo Fisher Scientific Inc.). The LC-MS/MS conditions are described in detail elsewhere (Nussbaumer et al., 2010).
Wiping and desorption material
The wiping was performed using Protein Saver TM 903 Card filter paper (Whatman, Dassel, Germany). Desorption was performed in 1.5 ml polyethylene (PE) safe-lock tubes (Eppendorf AG, Hamburg, Germany). The wiping solution was a 20% ACN solu-tion with 0.1 % FA. The validated wipe sampling pro-cedure is described in detail elsewhere (Nussbaumer
et al., 2012). Recoveries of the sampling procedure on the different surfaces are presented in Table 1.
BSC decontamination and wiping procedure
Pharmacy technicians are responsible for the manipula-tion, reconstitumanipula-tion, and production of antineoplastics preparations and clean the two BSC in the hospital phar-macy’s centralized cytotoxic preparation unit two to four times a day, at the end of the morning and afternoon work sessions. This post-preparation cleaning procedure is per-formed without opening the BSC, using a sterile solu-tion of IPA and TX612 TechniCloth wipes (TexWipe, Kernersville, NC, USA) on all inside surfaces. Gloves are changed after the post-preparation cleaning procedure.
Once a week, the two BSC are opened and cleaned in depth by trained cleaning technicians in charge for
the cleaning and preparation of BSC before the work sessions. This study focused on this weekly cleaning procedure, in order to evaluate the efficacy in routine conditions of a SDS solution in comparison with the usual IPA solution. Both solutions were used with an identical cleaning protocol, as follows: (i) the front panel was opened; (ii) all materials inside the BSC were taken out [e.g. scale, stainless steel work bench, gravi-metric control (CATO®) hardware]; (iii) the clean-ing solution (see after) was sprayed on all the interior surfaces (also inside the airlock box, and the insides of sleeves) and wiped using TX612 TechniCloth wipes; (iv) materials taken out were also sprayed and wiped with the same solution; (v) the exterior surfaces (also outside the airlock box and the outsides of sleeves) were cleaned as described previously; (vi) all the cleaned objects were replaced in the BSC; and (vii) the BSC was closed and air was circulated for 15 min before a new work session could start. In total, surfaces were wiped between 13 and 23 times a week in BSC 1 and between 11 and 21 times a week in BSC 2, depend-ing on the quantity of chemotherapies produced.
In order to compare the efficacy of the two solu-tions tested, a specific weekly cleaning procedure was applied to each BSC:
1. For BSC 1, a three-step cleaning procedure was applied to surfaces and materials: (i) surfactant cleaning solution (SDS10–2 M
+ 20% IPA); (ii) sterile water (to rinse residues of SDS); and (iii) IPA (to guarantee microbiological decontamination). Each step was followed by a wiping step for all surfaces. 2. For BSC 2, the usual one-step procedure
was applied using IPA on all surfaces and materials.
The two BSC were decontaminated on the same days by the same cleaning technician, following instruc-tions to frequently change the wipes used for the cleaning procedure. Around 12–15 wipes were used for the entire cleaning procedure for one BSC. Time required to complete the cleaning procedure in BSC1 was 1 h. BSC 2 cleaning procedure took 30 min to be completed. Time required completing the cleaning procedure were operator-dependent.
In order to compare the efficacy of the two cleaning procedures, seven spots inside the BSC (Fig. 1) were
wiped for sampling, both before and after the cleaning procedure described here. Wiping spots were: 100 cm2
of sleeves (polypropylene), 100 cm2 of the left side of
the work bench (stainless steel), the scale plate (stain-less steel), the gravimetric control (CATO®) hardware (mouse in BSC 1, keyboard in BSC 2, plastic), and airlock handles (polyester).Wiping was performed following a validated procedure (Nussbaumer et al.,
2012). After wiping, the samples were placed in a PE safe-lock (Eppendorf AG, Hamburg, Germany) and stored at −22°C until LC-MS/MS analysis. Sampling was performed once a week for the first 3 weeks (W) of the study, then every 4 or 5 weeks over nearly a year (49 weeks in total). During this entire period, the two BSC
were cleaned weekly, as described earlier; in total, meas-urement of contamination was performed 14 times.
Decontamination overview and efficacy calculation Total contamination and impact of the introduced
quantities of antineoplastics
For each wiping spot, the cumulative contamination of the 10 antineoplastic agents (GEM, CYT, CP, VIN, MTX, DOX, EPI, IFO, ETO, and IRI) was expressed in terms of total quantity (= Q in ng). Mean of Q(Q) across the 14 contamination measurements was calcu-lated. Total contamination level was expressed as the sum of Q (ΣQ) of all wiping samples during a wiping Table 1. Quantitative performance of the wiping method for the 10 antineoplastic drugs on different surfaces, adapted from (Nussbaumer et al., 2012).
Surface material Stainless steel Polypropylene Computer mouse
CYT Recovery (%) 81 79 69 Intermediate precision (%) 8.3 7.8 8.8 GEM Recovery (%) 82 79 81 Intermediate precision (%) 9.5 8.8 6.4 MTX Recovery (%) 63 85 64 Intermediate precision (%) 9.8 5.1 9.8 ETO Recovery (%) 45 82 81 Intermediate precision (%) 7.8 8.2 22.6 IFO Recovery (%) 82 91 98 Intermediate precision (%) 10.4 8.2 24.8 CP Recovery (%) 86 94 77 Intermediate precision (%) 10.8 4.8 20.4 IRI Recovery (%) 57 84 45 Intermediate precision (%) 11.8 11.9 12.0 DOX Recovery (%) 46 54 35 Intermediate precision (%) 5.1 6.1 12.2 VIN Recovery (%) 46 58 19 Intermediate precision (%) 5.2 6.2 11.1 EPI Recovery (%) 50 55 22 Intermediate precision (%) 12.0 11.9 12.3
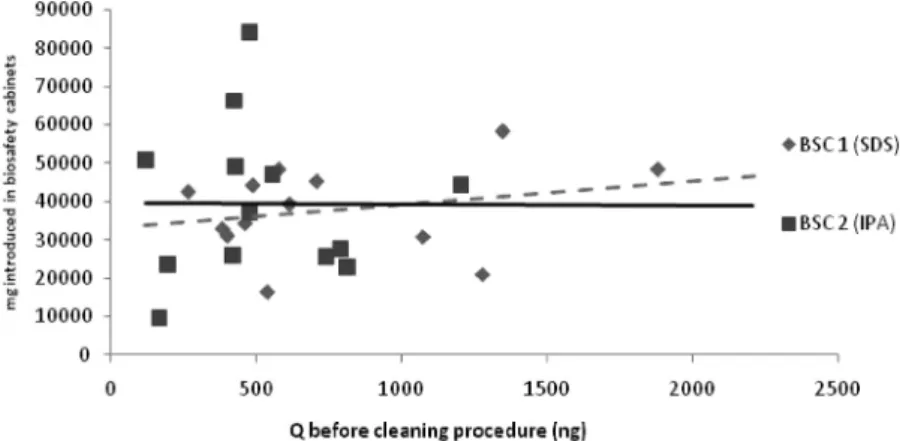
campaign for each BSC. The relationship between the quantity of the 10 antineoplastic agents introduced into each BSC during the week before the cleaning procedure and the ΣQbefore cleaning procedure was studied
using a linear regression. This was in order to evaluate whether the quantity of antineoplastic agents handled in each BSC influenced ΣQ.
Decontamination efficacy
The contamination overview was expressed by ΣQ at
the time of wiping (W1, W2,..., W49).The difference
between ΣQbefore cleaning procedure and ΣQafter cleaning procedure was
expressed by ΔQ. Positive and negative values of ΔQ
were observed. Efficacy (EffQ) was calculated from ΣQ
values of all seven spots, for the two BSC at the time of wiping, using Equation 1.
Eff Q
Q
Q
after cleaning procedure before cleaning procedu
= −
∑
∑
1 rre % (1)The average of EffQ was calculated. Results of EffQ <
0 were considerate as 0% (no decontamination had occurred).
Analysis of the contamination on the wiping areas for the 10 selected antineoplastic agents
Contamination by each separate cytotoxic agent was expressed in terms of quantity (= q in ng). The dis-tribution of the contaminations in each BSC was cal-culated using the mean values of q(q) of all wiping samples from a selected spot. Means were calculated to evaluate the general trends in the decontamination
procedures and to highlight any accidental contamina-tion during the study.
The decontamination efficacy (Effq) of the two
cleaning solutions on the 10 cytostatic agents was cal-culated from the q values of all seven spots for the two BSC at the time of wiping using, Equation 2.
Eff of selected
antineoplastic agentsq = −1 qafter cleaning proocedure
before cleaning procedure
q
%
(2) Efficacy of the cleaning solutions was evaluated by cal-culating the mean of all Effq of a selected antineoplas-tic agent according to the cleaning solution employed during the cleaning procedure. When Σqafter cleaning procedure
was higher Σqbefore cleaning procedure a negative Effq result had
occurred. To evaluate the efficacy of the cleaning solution on antineoplastic agents, results of Effq < 0 were
consid-ered as 0%, as no decontamination had occurred. Fisher– Student tests (α < 0.05) were carried out to compare the average efficacy of the two cleaning solutions, and to evaluate whether a difference of efficacy on antineoplas-tic agents existed between the two cleaning solutions.
R ESULTS
During this study, 390 wiping samples (195 for BSC 1 (SDS + IPA) and 195 for BSC 2 (IPA)) were collected.
Total contamination and impact of the introduced quantities of antineoplastic agents
QBSC 1 was 3557.6 ± 2700.5 ng for Qbefore and
402.3 ± 333.4 ng for Qafter. The QBSC 2 levels
Figure 1 Representation of a biosafety cabinet with seven sampling spots highlighted: (a) left and right sleeves; (b) work bench; (c) scale plate; (d) CATO mouse or keyboard; (e) left and right airlock handles.
detected were 2997.1 ± 2239.4 ng for Qbefore and
3168.2 ± 3261.4 ng for Qafter. Results showed higher
values of Qbeforecleaning procedure in BSC 1 than in BSC
2. No linear relationship was evident between the detected Q and the total quantity of the 10 antineo-plastic agents treated in the BSC in the week before the analyses (R2 < 0.06 for both BSC) (Fig. 2).
Decontamination efficacy
EffQ for each BSC was calculated using Equation 1, in
order to evaluate the general efficacy of the cleaning solutions on the 10 selected antineoplastic agents; this is represented by the histograms in Fig. 3. For BSC 1 (SDS), an average EffQ value of 82% ± 6% [relative
standard deviation (RSD) 13%] was observed. At each wiping campaign, a positive ΔQ was measured,
indicating a decrease in the contamination level after a cleaning procedure. An average EffQ value of 49 ± 11%
(RSD 29%) was obtained for BSC 2 (IPA), and three samples (W1, W2, and W44) were found to present negative values of ΔQ.
Analysis of the contamination of wiping areas for the 10 selected antineoplastic agents
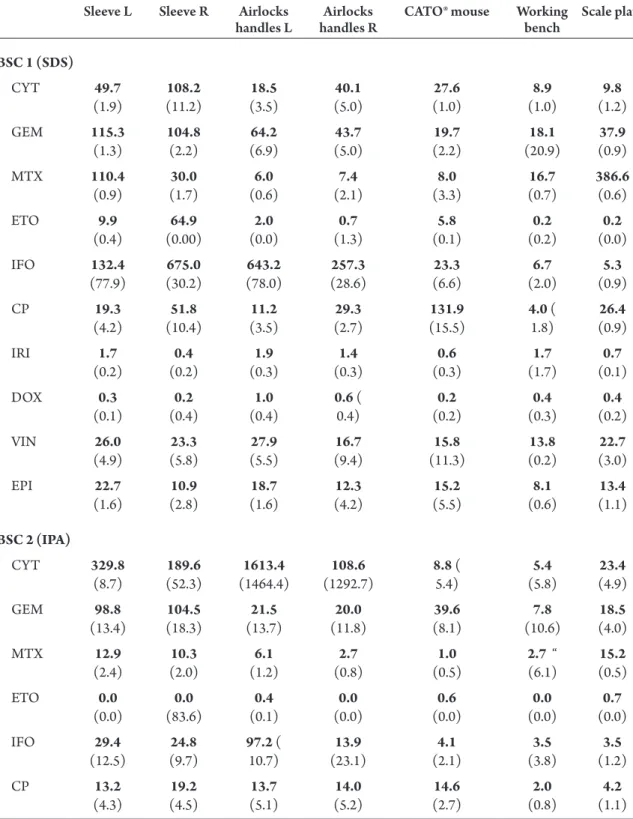
Mean values of q (q), for the 10 cytostatic agents, were plotted according to the wiping areas. Results of the contamination distribution are shown in Table 2. For both BSC, the most contaminated areas were sleeves and airlock handles. On two occasions (during weeks 1 and 2), in the BSC 2 airlock, handles were contaminated with high qCYT (over 1200 ng) both before and after the
cleaning procedure. In both BSC, values of qCP, qIFO,
qGEM, and qCYT were higher than the qof the other
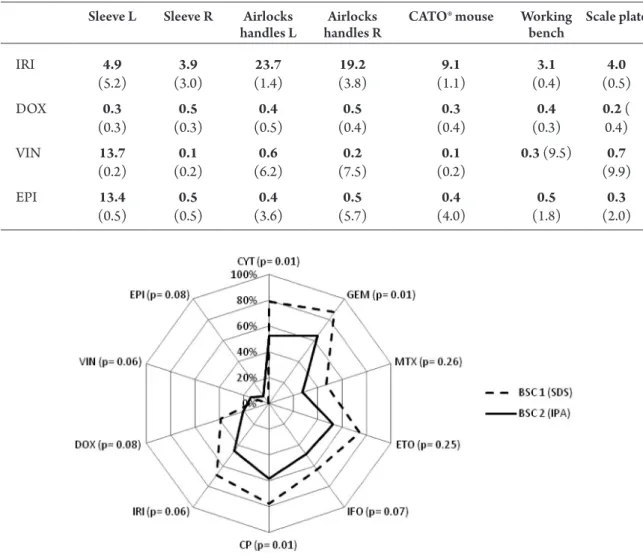
cyto-static agents. Efficacy of the two cleaning solutions used during the cleaning procedure for the 10antineoplastic agents was expressed in terms of means values of Effq
(Fig. 4). Efficacy was calculated as an evaluation of the percentage of antineoplastic agents washed away during the cleaning procedure. A high value of Effq meant that
the contamination had been reduced during the clean-ing procedure. The efficacy of the SDS solution was higher than that of IPA on eight of the 10antineoplas-tic agents (CYT, GEM, MTX, ETO, IFO, CP, IRI, and DOX). SDS solution was almost 20% more effective than IPA on almost all antineoplastic agents. IPA was more effective on VIN and EPI, but both cleaning solu-tions showed efficacies lower than 20%. As shown in
Fig. 4, significant differences in the efficacy of the clean-ing solutions were only observed for CYT, GEM, and CP (P < 0.05, Fisher–Student test).
DISCUSSION
This study aimed to compare the efficacy of two clean-ing solutions for the chemical decontamination of two class III BSC. These BSC were used daily to produce chemotherapies in the centralized cytotoxic prepara-tion unit in a hospital pharmacy. Over the course of a year, each of BSC was cleaned with a different solu-tion: a solution of 10–2 M of SDS containing 20%
IPA (BSC 1), and a solution of IPA (BSC 2). SDS solution was chosen based on results of a previous experimental study (Queruau Lamerie et al., 2013),
Figure 2 Relationship between the quantities of the 10 antineoplastic agents introduced in the BSC for the chemotherapy preparations and the quantities detected (Q) before the cleaning procedure. BSC 1) y = 5.9948 x + 33218, R2 = 0.059; BSC 2) y = −0.3824x + 39772, R2 = 0.0003.
while IPA is the disinfectant conventionally used in routine microbiological cleaning of BSC in numerous pharmacy hospitals. Throughout the duration of the study, contaminations by antineoplastic agents were detected in both BSC both before and after the clean-ing procedures.
Total contamination and the impact of introduced quantities of antineoplastic agents
Higher total quantities of antineoplastics were detected for QBSC 1 than for QBSC 2. Several factors,
including the quantity of introduced antineoplastic agents, were investigated to explain this difference, and
Figure 3 Contamination rate over view in terms of ΣQ of all antineoplastics and efficacy histograms are plotted according to the wiping campaigns.
Table 2. Mean q values of antineoplastic tested, at wiping spot. Values in bold denote samples collected before the cleaning procedure and values in brackets denote samples collected after the cleaning procedure.
Sleeve L Sleeve R Airlocks
handles L handles RAirlocks CATO® mouse Working bench Scale plate
BSC 1 (SDS) CYT 49.7 (1.9) (11.2)108.2 (3.5)18.5 (5.0)40.1 (1.0)27.6 (1.0)8.9 (1.2)9.8 GEM 115.3 (1.3) 104.8 (2.2) (6.9)64.2 (5.0)43.7 (2.2)19.7 (20.9)18.1 (0.9)37.9 MTX 110.4 (0.9) (1.7)30.0 (0.6)6.0 (2.1)7.4 (3.3)8.0 (0.7)16.7 386.6 (0.6) ETO 9.9 (0.4) (0.00)64.9 (0.0)2.0 (1.3)0.7 (0.1)5.8 (0.2)0.2 (0.0)0.2 IFO 132.4 (77.9) (30.2)675.0 (78.0)643.2 (28.6)257.3 (6.6)23.3 (2.0)6.7 (0.9)5.3 CP 19.3 (4.2) (10.4)51.8 (3.5)11.2 (2.7)29.3 (15.5)131.9 4.0 ( 1.8) (0.9)26.4 IRI 1.7 (0.2) (0.2)0.4 (0.3)1.9 (0.3)1.4 (0.3)0.6 (1.7)1.7 (0.1)0.7 DOX 0.3 (0.1) (0.4)0.2 (0.4)1.0 0.6 ( 0.4) (0.2)0.2 (0.3)0.4 (0.2)0.4 VIN 26.0 (4.9) (5.8)23.3 (5.5)27.9 (9.4)16.7 (11.3)15.8 (0.2)13.8 (3.0)22.7 EPI 22.7 (1.6) (2.8)10.9 (1.6)18.7 (4.2)12.3 (5.5)15.2 (0.6)8.1 (1.1)13.4 BSC 2 (IPA) CYT 329.8 (8.7) (52.3)189.6 (1464.4)1613.4 (1292.7)108.6 8.8 ( 5.4) (5.8)5.4 (4.9)23.4 GEM 98.8 (13.4) (18.3)104.5 (13.7)21.5 (11.8)20.0 (8.1)39.6 (10.6)7.8 (4.0)18.5 MTX 12.9 (2.4) (2.0)10.3 (1.2)6.1 (0.8)2.7 (0.5)1.0 2.7 “ (6.1) (0.5)15.2 ETO 0.0 (0.0) (83.6)0.0 (0.1)0.4 (0.0)0.0 (0.0)0.6 (0.0)0.0 (0.0)0.7 IFO 29.4 (12.5) (9.7)24.8 97.2 ( 10.7) (23.1)13.9 (2.1)4.1 (3.8)3.5 (1.2)3.5 CP 13.2 (4.3) (4.5)19.2 (5.1)13.7 (5.2)14.0 (2.7)14.6 (0.8)2.0 (1.1)4.2
no significant relationship was observed. Literature describes several factors which can have an impact on contamination levels—such as operators training, work practices, materials, and facilities (Marcel et al.,
2004; Käslin et al., 2010; Le et al., 2013)—these were beyond the scope of this study.
Independent guidelines have suggested a reference value of 1 ng cm−2 (Käslin et al., 2010), based on the
experimental 90th percentile of the contamination load detected during the MEWIP study (Kiffmeyer
et al., 2013). In this study, 10 antineoplastic agents are detected in seven areas, each of about 100 cm2, which
gave a total contamination reference value of about 7000 ng. Target contamination levels in the MEWIP
study were 0.1 ng cm−2, corresponding roughly to a
700 ng contamination level in this study. Q values before the cleaning procedure ranged between 7000 and 700 ng. QBSC 1 values were lower than 700 ng
after the cleaning procedure whereas QBSC 2 values
were always higher than this target value. These results suggest that the SDS solution (BSC 1) had indeed decreased contamination to acceptable levels (700 ng in our case), but that IPA had not (BSC 2). Moreover, some Q BSC 2 values for after the cleaning procedure were higher than Q BSC 2 values before it, suggesting either that IPA was less effective than the SDS solution or that a dispersion of antineoplastic agents occurred during the cleaning procedure.
Figure 4 Efficacy of cleaning solutions on 10 antineoplastic agents in BSC 1 and BSC 2 during the study, with P value results of Fisher–Student test in brackets.
Sleeve L Sleeve R Airlocks
handles L handles RAirlocks CATO® mouse Working bench Scale plate
IRI 4.9 (5.2) (3.0)3.9 (1.4)23.7 (3.8)19.2 (1.1)9.1 (0.4)3.1 (0.5)4.0 DOX 0.3 (0.3) (0.3)0.5 (0.5)0.4 (0.4)0.5 (0.4)0.3 (0.3)0.4 0.2 (0.4) VIN 13.7 (0.2) (0.2)0.1 (6.2)0.6 (7.5)0.2 (0.2)0.1 0.3 (9.5) (9.9)0.7 EPI 13.4 (0.5) (0.5)0.5 (3.6)0.4 (5.7)0.5 (4.0)0.4 (1.8)0.5 (2.0)0.3 Table 2. Continued
Decontamination efficacy
According to experimental conditions results show-ing a better decontamination efficacy for a SDS 10–2 M
solution with 20% IPA than for an IPA solution alone (Queruau Lamerie et al., 2013), a larger ΔQ could have
been expected in the BSC cleaned using the SDS solu-tion (BSC 1). A decrease in contaminasolu-tion level was indeed observed for all the BSC 1 samples after a clean-ing procedure (ΔQ always positive). During the W1, W2,
and W44 wiping campaigns in BSC 2, however, ΔQ
val-ues were negative. This was probably due to a dispersion of antineoplastic agents during the IPA solution cleaning procedure in that BSC. Similar effects were discussed
in another study on the efficacy of cleaning solutions, which showed a higher dispersion potential for alcoholic solutions than for detergent solutions (Le et al., 2013). It should be noted that traces of contamination remained after the cleaning procedures whichever solution was used. This residual contamination was also observed in other studies investigating the efficacy of cleaning solutions based on a desorption phenomenon (Le
et al., 2013; Queruau Lamerie et al., 2013 ).Desorption-type cleaning procedures are not able to completely eliminate contamination. Better efficacy was obtained with decontamination protocols involving destruc-tive agents such as sodium hypochlorite or hydrogen peroxide (Castegnaro et al., 1997; Hansel et al., 1997;
Roberts et al., 2006). However, due to several major drawbacks, including surface corrosion (ISOPP, 2007) and the production, by oxidation, of mutagenic resi-dues (Castegnaro et al., 1985; Barek et al., 1998), these products are not suitable for routine use in BSC cleaning procedures. The present study’s results for cumulative contamination levels demonstrated that even if the SDS solution were more effective than IPA, both experimen-tal and routine conditions, the toexperimen-tal decontamination of a BSC cannot be reached. The cleaning product itself is only one of several factors—including cleaning proce-dures, pharmacy technicians awareness, and training of cleaning technicians—which need to be evaluated and optimized in order to decrease contamination levels in BSC (Roberts et al., 2006; Käslin et al., 2010; Le et al.,
2013).The effect of the number of mechanical clean-ing was neglected between the two methods because no significant difference in the efficiency was observed between a one-step procedure and a three-step cleaning procedure using IPA only (Table 3). Indeed to assess whether the mechanical action affects the efficacy of the cleaning procedure, BSC 2 was once cleaned three times with IPA (W13). EffQ value of a three steps cleaning pro-cedure (57%) was included in the confidence interval (49% ± 16%), calculated from the EffQ values of
one-step cleaning procedures.
Analysis of the contamination by wiping area for the 10 selected antineoplastic agents
The higher contamination levels detected on sleeves and airlock handles were probably due to a high fre-quency of contact with gloves, as observed elsewhere (Sessink et al., 1992; Chu et al., 2012). Moreover, sleeves are voluminous and relatively difficult to clean
Table 3. Mean EffQ values of BSC 2 (IPA) according to the number of cleaning steps. Confidence interval was included from 33 to 65%. EffQ BSC 2 (IPA) Step count 1 3 W1 0% W2 0% W3 91% W10 51% W13 57% W17 76% W21 53% W26 90% W30 54% W35 59% W39 65% W44 0% W47 27% W49 67% n 13 Mean 49% SD 31% CI 49 ± 16%
by the pharmacy technicians themselves during the post-preparation cleaning procedure, leading to only a partial elimination, or a dispersion, of contamina-tion. Sleeves are also permanently close to vials of products in the preparation area, increasing the risk of contamination by dispersion of the contaminant present on the outside of vials (Favier et al., 2003;
Connor et al., 2005; Fleury-Souverain et al., 2014) or by drops, spills, or aerosols generated during drug manipulation(Vyas et al., 2013).Dispersion might also occur during the cleaning procedure, as observed in BSC 2, when airlock handles were contaminated with elevated qCYT both before and after the cleaning
pro-cedure. Lower contamination levels were observed on the scale plate, CATO® hardware and the work bench. Indeed, only materials such as syringes or infu-sion bags touch the scale plate. Lower contamination levels on work benches could be explained by the use of a disposable preparation mats, placed in the center of the preparation area, which protect the stainless steel surfaces: when preparation sessions are over (or if visible contamination is observed), the disposable preparation mat is carefully folded, discarded into a waste bag, sealed, and taken out using the left airlock (and replaced) to be destroyed. No sampling was per-formed on the disposable mats. The use of preventive protective measures (like the work bench mat) could decrease the risk of contamination by antineoplastic agents. In order to limit cross-contamination, a glove changes could occur between preparations when a different antineoplastic agent is used (Mason et al.,
2003; Fleury-Souverain et al., 2014). To prevent spill-age or drops during the manipulation of antineoplastic agents, the HUG pharmacy uses vented needles con-taining a hydrophobic filter or a chemo-dispensing pin. Although these devices improve safety during the chemotherapy preparation session (Siderov et al.,
2010; Favier et al., 2012) and are useful for reduc-ing contamination levels, their use does not appear to have been sufficient to eliminate the risks of spills or drops when the syringe is disconnected from the device during preparation sessions(Guillemette et al.,
2014). In both BSC, contamination values for qCP,
qIFO, qGEM, and qCYT were higher than the q for other
cytostatic agents. The higher contamination levels for these four antineoplastic agents (CP, IFO, GEM, and CYT)was probably due to their higher therapeutic doses and the risk of spills or drops associated with
the reconstitution step of the freeze-dried drugs (IFO and GEM). SDS solution was more effective than IPA on hydrophilic molecules (CYT, GEM, MTX, ETO, IFO, and CP), but also on two hydrophobic molecules (IRI and DOX), due to the presence of an anionic sur-factant promoting the formation of micelles, as previ-ously demonstrated elsewhere(Le et al. 2013; Queruau Lamerie et al. 2013). During this study, results for the efficacy of SDS showed a greater potential for the decontamination of eight antineoplastic agents. Using SDS solution instead of IPA solution during the clean-ing procedure reached a statistically significant bet-ter decontamination on three of these antineoplastic agents: CYT, GEM, and CP. The results obtained in the present routine use study were sometimes differ-ent from experimdiffer-ental conditions studies; this could be explained by the fact that contamination levels of the 10 antineoplastic agents were unpredictable com-pared to standardized simulated contamination. This difference had an impact on efficacy (i.e. high levels of contamination were more difficult to clean up), lead-ing to higher residual contamination after the cleanlead-ing procedure. Other potential sources of differences con-cerned the contact time which antineoplastic agents had with the air, their exposition to light. Moreover heterogeneity of contaminated surfaces (stainless steel, polypropylene, polyester, and plastic) could explain the differences between the experimental and routine conditions results of the efficiency on CYT, GEM, or CP. The inherent variability of different cleaning tech-nicians’ ways of applying procedures could also have had an impact on the efficacy of decontamination. Before the study, the cleaning method to be applied was decided upon with reference to the routine pro-cedure. Although the sequence for this procedure was followed by all the cleaning technicians and did not change throughout the study, some differences, such as the quantity of cleaning product sprayed or the wiping path, were observed. These differences were dependent on the individual cleaning technicians and could be reduced by the highly detailed training of these personnel in BSC cleaning procedures (Käslin
et al., 2010; Le et al., 2013).
CONCLUSIONS
This study evaluated the efficacy of two cleaning solu-tions for the chemical decontamination of 10 antineo-plastic agents (GEM, CYT, CP, VIN, MTX, DOX,
EPI, IFO, ETO, and IRI) on the surfaces of two BSCs in a real-world context. The efficacy of a solution con-taining a surfactant agent—the SDS solution—was shown to be higher than the efficacy of the IPA solu-tion alone, thus confirming experimental condisolu-tions studies. Neither cleaning solution was able to totally remove the contamination, but the efficacy of the cleaning solution containing a surfactant was suffi-cient to reduce the contamination of each individual antineoplastic agent to under a level corresponding to the 0.1 ng cm−2, the acceptable limit proposed by the
MEWIP study (Kiffmeyer et al., 2013).The present study’s results also suggested that the decontamina-tion of BSC depends on such important factors as the cleaning products used, cleaning procedures, the awareness of pharmacy technicians, and the training of cleaning technicians. Measures such as standardized cleaning protocols and regular training of the clean-ing technicians must be undertaken in order to make cleaning procedures more effective. Additional meas-ures, such as the use of a second pair of gloves, the decontamination of external vial surfaces or the use of closed system drug transfer devices, should be consid-ered in an effort to reduce initial contamination. The cleaning procedure using the SDS solution could be easily transferred and applied to other contaminated surfaces presents in pharmacy or health care units working with antineoplastic agents. However, future studies are required to carry out a detailed investiga-tion of glove contaminainvestiga-tion levels, e.g. to look at the impact of standardized cleaning protocols on cleaning efficacy and to analyze the decontamination of further antineoplastic agents.
FUNDING
Pharmacy of Geneva University Hospital (Geneva, Switzerland).
ACKNOWLED GE M EN TS
The authors thank the Proteomics Core Facility at the Faculty of Medicine, University of Geneva (Switzerland), for the kind loan of the LC-MS/MS instrument. The authors declare no conflict of interest relating to the material presented in this article.
DISCL AI M ER
Its contents, including any opinions and/or conclu-sions expressed, are solely those of the authors.
R EFER ENCES
ASHP. (2006) ASHP guidelines on handling hazardous drugs.
Am J Health Syst Pharm; 63: 1172–93.
Barek J, Cvacka J, de Meo M et al. (1998) Chemical degradation
of wastes of antineoplastic agents amsacrine, azathioprine, asparaginase and thiotepa. Ann Occup Hyg; 42: 259–66.
Benhamou S, Callais F, Sancho-Garnier H et al. (1986)
Mutagenicity in urine from nurses handling cytostatic agents. Eur J Cancer Clin Oncol; 22: 1489–93.
Castegnaro M, Barek J, Dennis J et al. (1985) Laboratory
decontamination and destruction of carcinogens in labo-ratory wastes: some aromatic amines and 4-nitrobiphenyl.
IARC Sci Publ; 64: 1–85.
Castegnaro M, De Meo M, Laget M et al. (1997) Chemical
deg-radation of wastes of antineoplastic agents. 2: Six anthracy-clines: idarubicin, doxorubicin, epirubicin, pirarubicin, aclarubicin, and daunorubicin. Int Arch Occup Environ Health; 70: 378–84.
Chu WC, Hon CY, Danyluk Q et al. (2012) Pilot assessment
of the antineoplastic drug contamination levels in British Columbian hospitals pre- and post-cleaning. J Oncol Pharm Pract; 18: 46–51.
Connor TH, Sessink PJ, Harrison BR et al. (2005) Surface
con-tamination of chemotherapy drug vials and evaluation of new vial-cleaning techniques: results of three studies. Am J Health Syst Pharm; 62: 475–84.
Favier B, Gilles L, Ardiet C et al. (2003) External
contamina-tion of vials containing cytotoxic agents supplied by phar-maceutical manufacturers. J Oncol Pharm Pract; 9: 15–20.
Favier B, Labrosse H, Gilles-Afchain L et al. (2012) The
PhaSeal(R) system: impact of its use on workplace contam-ination and duration of chemotherapy preparation. J Oncol Pharm Pract; 18: 37–45.
Fleury-Souverain S, Nussbaumer S, Mattiuzzo M et al. (2014)
Determination of the external contamination and cross-con-tamination by cytotoxic drugs on the surfaces of vials avail-able on the Swiss market. J Oncol Pharm Pract; 20: 100–1.
Guillemette A, Langlois H, Voisine M et al. (2014) Impact and
appreciation of two methods aiming at reducing hazardous drug environmental contamination: The centralization of the priming of IV tubing in the pharmacy and use of a closed-system transfer device. J Oncol Pharm Pract; 20: 426–32.
Hansel S, Castegnaro M, Sportouch MH et al. (1997) Chemical
degradation of wastes of antineoplastic agents: cyclophos-phamide, ifosfamide and melphalan. Int Arch Occup Environ Health; 69: 109–14.
ISOPP. (2007) ISOPP standards of practice. Safe handling of cytotoxics.J Oncol Pharm Pract; 13 (Suppl.): 1–81.
Käslin E, Merz B, Rüegger M et al. (2010) Contamination de
surface lors de la manipulation de médicaments cytosta-tiques dans les établissements de santé. SUVA Medical;
2010: 59–72.
Kiffmeyer TK, Tuerk J, Hahn M et al. (2013) Application and
antineoplastic drug contamination level in pharmacies - the MEWIP project. Ann Occup Hyg; 57: 444–55.
Le LM, Jolivot PA, Sadou Yaye H et al. (2013) Effectiveness
of cleaning of workplace cytotoxic surface. Int Arch Occup Environ Health; 86: 333–41.
Lee S-G, Ambados F,Tkaczuk M et al. (2009) Paclitaxel
expo-sure and its effective decontamination. J Pharmacy Practice Res; 39: 181–85.
Marcel J, Martin R, Bernard L et al. (2004) Sécurité dans
l’emploi des cytostatiques. Suva Pro; 2869/18: 1–69.
Mason HJ, Morton J, Garfitt SJ et al. (2003) Cytotoxic drug
contamination on the outside of vials delivered to a hospital pharmacy. Ann Occup Hyg; 47: 681–5.
NIOSH. (2004) NIOSH Alert, Preventing occupational expo-sures to antineoplastic and other hazardous drugs in health care settings. Available at http://www.cdc.gov/niosh/ docs/2004–165/pdfs/2004–165.pdf. Accessed 12 March 2014.
Nussbaumer S, Fleury-Souverain S, Antinori P et al. (2010)
Simultaneous quantification of ten cytotoxic drugs by a validated LC-ESI-MS/MS method. Anal Bioanal Chem;
398: 3033–42.
Nussbaumer S, Geiser L, Sadeghipour F et al. (2012) Wipe
sampling procedure coupled to LC-MS/MS analysis for the simultaneous determination of 10 cytotoxic drugs on differ-ent surfaces. Anal Bioanal Chem; 402: 2499–509.
Queruau Lamerie T, Nussbaumer S, Decaudin B et al. (2013)
Evaluation of decontamination efficacy of cleaning solu-tions on stainless steel and glass surfaces contaminated by 10 antineoplastic agents. Ann Occup Hyg; 57: 456–69.
Roberts S, Khammo N, McDonnell G et al. (2006) Studies on
the decontamination of surfaces exposed to cytotoxic drugs in chemotherapy workstations. J Oncol Pharm Pract; 12: 95–104.
Sessink PJ, Boer KA, Scheefhals AP et al. (1992)
Occupational exposure to antineoplastic agents at several departments in a hospital. Environmental contamination and excretion of cyclophosphamide and ifosfamide in
urine of exposed workers. Int Arch Occup Environ Health;
64: 105–12.
Sessink PJ, Cerna M, Rossner P et al. (1994) Urinary
cyclo-phosphamide excretion and chromosomal aberrations in peripheral blood lymphocytes after occupational exposure to antineoplastic agents. Mutat Res; 309: 193–9.
Sessink PJ, Wittenhorst BC, Anzion RB et al. (1997) Exposure
of pharmacy technicians to antineoplastic agents: reevalu-ation after additional protective measures. Arch Environ Health; 52: 240–4.
Sharma P, Kumar M, Mathur N et al. (2013) Health care
indus-tries: potential generators of genotoxic waste. Environ Sci Pollut Res Int; 20: 5160–7.
Siderov J, Kirsa S, McLauchlan R. (2010) Reducing workplace cytotoxic surface contamination using a closed-system drug transfer device. J Oncol Pharm Pract; 16: 19–25.
Sorsa M,Pyy L, Salomaa S et al. (1988) Biological and
envi-ronmental monitoring of occupational exposure to cyclo-phosphamide in industry and hospitals. Mutat Res; 204:
465–79.
Suspiro A, Prista J. (2011) Biomarkers of occupational expo-sure do anticancer agents: a minireview.Toxicol Lett; 207:
42–52.
Touzin K, Bussieres JF, Langlois E et al. (2009) Evaluation of
surface contamination in a hospital hematology--oncology pharmacy. J Oncol Pharm Pract; 15: 53–61.
Turci R, Minoia C, Sottani C et al. (2011) Occupational
expo-sure to antineoplastic drugs in seven Italian hospitals: the effect of quality assurance and adherence to guidelines. J Oncol Pharm Pract; 17: 320–32.
Vyas N, Yiannakis D, Turner A et al. (2013) Occupational
expo-sure to anti-cancer drugs: A review of effects of new tech-nology. J Oncol Pharm Pract; 20: 278–87.
Yoshida J, Koda S, Nishida S et al. (2013) Association between
occupational exposure and control measures for antineo-plastic drugs in a pharmacy of a hospital. Ann Occup Hyg;