Clustered lot quality assurance sampling: a tool to monitor
immunization coverage rapidly during a national yellow fever
and polio vaccination campaign in Cameroon, May 2009
L. P E Z Z O L I1*, R. T C H I O2, A. D. D Z O S S A3, S. N D J O M O3, A. T A K E U3, B. A N Y A4,
J. T I C H A4, O. R O N V E A U X5
A N D R. F. L E W I S6
1
World Health Organization, Geneva, Switzerland
2Expanded Programme for Immunization, Ministry of Health, Yaounde´, Cameroon 3National Institute of Statistics, Yaounde´, Cameroon
4Immunization, World Health Organization, Yaounde´, Cameroon
5Immunization and Vaccine Development, World Health Organization, Ouagadougou, Burkina Faso 6
Epidemic Readiness and Intervention, World Health Organization, Geneva, Switzerland
(Accepted 13 February 2011; first published online 22 March 2011)
S U M M A R Y
We used the clustered lot quality assurance sampling (clustered-LQAS) technique to identify districts with low immunization coverage and guide mop-up actions during the last 4 days of a combined oral polio vaccine (OPV) and yellow fever (YF) vaccination campaign conducted in Cameroon in May 2009. We monitored 17 pre-selected districts at risk for low coverage. We designed LQAS plans to reject districts with YF vaccination coverage<90% and with OPV coverage<95%. In each lot the sample size was 50 (five clusters of 10) with decision values of 3 for assessing OPV and 7 for YF coverage. We ‘ rejected ’ 10 districts for low YF coverage and 14 for low OPV coverage. Hence we recommended a 2-day extension of the campaign. Clustered-LQAS proved to be useful in guiding the campaign vaccination strategy before the completion of the operations.
Key words: Clustered lot quality assurance sampling, oral polio vaccine, yellow fever Vaccine.
I N T R O D U C T I O N
Vaccination campaigns targeting disease elimination aim to achieve very high levels of coverage, up to 95 % in every district. To rapidly assess areas that are not reaching these very high levels of coverage during vaccination campaign activities, rapid house-to-house monitoring (RHHM) has been proposed [1]. RHHM has the advantages of being practical and fast, but its statistical value may be difficult to interpret since the sample is not randomly selected (it uses a convenience sample approach).
The World Health Organization (WHO) has been using the lot quality assurance sampling (LQAS) method to classify areas of interest (lots) as having reached acceptable or unacceptable levels of vacci-nation coverage [2]. LQAS uses two coverage thresh-olds, an upper threshold (UT) and a lower threshold (LT), and a decision value (d) in a sample (N) of the population. The area between the UT and the LT is known as the ‘ grey area ’ and is the area of statistical uncertainty typical of LQAS designs : if the number of unvaccinated individuals found in N is higher than d, then we reject the lot as not having reached acceptable vaccination coverage (i.e. real coverage in the lot is below UT) ; if it is equal to or less than d, then we accept it as acceptable coverage (i.e. real coverage in * Author for correspondence : Dr L. Pezzoli, Epidemiology
Consultant, World Health Organization, Geneva, Switzerland. (Email : [email protected])
the lot is above LT). The alpha error is the probability of accepting a lot with an unacceptable proportion of unvaccinated individuals, while the beta error is the probability of rejecting a lot with acceptable vac-cination coverage [3]. The larger the grey area, the smaller the sample size needed to assess the lot with equal precision [4].
LQAS classification traditionally relies on simple random sampling (SRS) and small sample sizes (N<20), this is feasible if the lots are small areas (e.g. a city neighbourhood) where individuals can be easily sampled randomly, but it can become very time-consuming if the lots are large [5, 6]. Instead of SRS, cluster sampling can be used in the lots as an alternative method to reduce the number of site visits needed to complete data collection [4]. Previous studies have explored the applications of clustering the LQA sample to assess global acute malnutrition using field data and computer simulations [7–9]. A similar approach based on computer simulations to assess the precision of LQAS plans divided into smaller clusters (Clustered-LQAS) has also been explored to assess vaccination coverage [4]. Clustered-LQAS has proven to be useful in assessing vacci-nation coverage at the health district level after completion of immunization activities [10], but has not previously been used to monitor performance before the end of a campaign in order to identify areas that require mop-up activities and ensure achievement of objectives.
Between 4 and 11 May 2009, Cameroon conducted a polio and yellow fever (YF) vaccination campaign. The target population for YF vaccination was 90 % of the 7.5 million individuals aged o9 months (except pregnant women) in 62 health districts at risk for YF [11]. The target population for the oral polio vacci-nation (OPV) was 100 % of the 2.9 million children aged between 0 and 59 months in all 173 health districts of Cameroon.
YF is a mosquito-borne viral haemorrhagic fever endemic in the equatorial regions of Africa and South America [12–14]. Resurgence of YF virus in recent years poses a public health threat due to the potential for devastating urban epidemics [15, 16]. Cameroon is one of the 12 African countries supported by the Yellow Fever Initiative led by the WHO and the United Nations Children’s Fund (UNICEF) with funding from the Global Alliance for Vaccines and Immunization (GAVI) [11, 15, 17]. Poliomyelitis (polio) is a viral disease that affects the nervous system [18]. Polio is targeted for worldwide eradication but,
as of 2010, remains endemic in Afghanistan, India, Pakistan, and Nigeria, with sporadic cases exported to other countries [18–21]. At the time of the vacci-nation campaign, Cameroon had not reported any polio cases since 2006, although cases occurred in neighbouring Nigeria, Chad, and Central African Republic [22].
The purpose of our study was to use the clustered-LQAS technique for mid-campaign vaccination coverage monitoring, and thereby assess districts in Cameroon at risk of low YF or polio vaccination coverage in order to implement timely measures to improve performance before the end of the campaign.
M A T E R I A L S A N D M E T H O D S Definitions
For the purpose of the clustered-LQAS survey, we defined the health districts in Cameroon as ‘ lots ’. We defined an individual vaccinated against YF as a person agedo9 months, not pregnant, presenting a YF vaccination card from the current campaign or prior vaccination. We defined an individual vacci-nated against polio as a child aged between 0 and 59 months presenting the indelible ink mark on the fingernail at the time of OPV vaccination. In the absence of card or ink mark, we recorded a verbal history of vaccination.
Clustered-LQAS plans
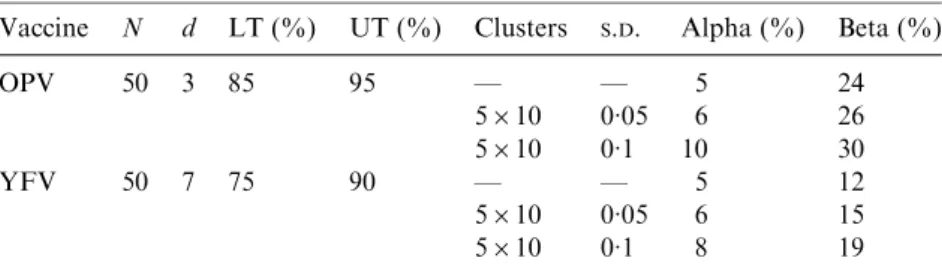
As the YF vaccination coverage target was 90 %, we used this level for the UT and 75 % as the LT, selecting a decision value of seven in a sample of 50 individuals. Assuming SRS, the alpha value of this plan was 5 % and the beta value 24 %. For polio we set the UT to 95 % and the LT to 85 %, with d=3 and N=50. Assuming SRS, the alpha and beta values of the plan used for polio were 5 % and 12 %, respect-ively.
In the field, we did not use SRS but we divided each sample (N=50) into five clusters of 10 individuals according to the clustered-LQAS methodology [4]. To investigate the effect of clustering, we recalculated alpha and beta by conducting simulations where each cluster’s true coverage was sampled from a binomial distribution with a mean of LT or UT and standard deviations (S.D.) of 0.05 or 0.10 (Table 1) [4].
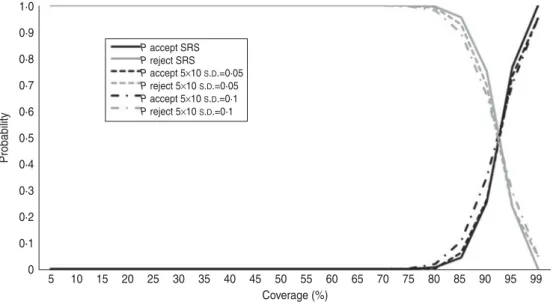
We calculated the operating characteristic (OC) curves of the sampling plans used to assess YF (Fig. 1) and OPV (Fig. 2) coverage according to SRS and
the two 5r10 clustered designs (S.D.=0.05 and S.D.=0.10).
Lot selection
As the approach was designed to detect low vacci-nation coverage during the campaign to allow time for intervention, all 62 target districts were assessed before the campaign based on local data. The re-sources available did not allow us to assess all 62 target districts, we therefore decided to prioritize the districts for intervention. We selected a subset of districts (17/62) at risk for low coverage, of which 12 were selected before the campaign and five once the campaign had begun.
Based on the indicators used by WHO [23], we de-fined seven criteria for risk of low coverage :
(1) Routine infant administrative YF vaccination coverage in 2008 with S.D. above (i.e. above 100 %) or below the mean coverage in the 62 dis-tricts targeted by the campaign, reflecting a poss-ible problem with population estimates in the district, which would make administrative cover-age data unreliable.
(2) Routine OPV-3 administrative coverage in 2008 withS.D. above or below the mean coverage in the districts.
(3) A district population estimate withS.D. above the mean population in the districts, reflecting large Table 1. Sampling plans used to evaluate coverage of the two vaccines,
clustered lot quality assurance sampling survey of yellow fever and polio vaccination coverage, Cameroon, May 2009
Vaccine N d LT (%) UT (%) Clusters S.D. Alpha (%) Beta (%)
OPV 50 3 85 95 — — 5 24 5r10 0.05 6 26 5r10 0.1 10 30 YFV 50 7 75 90 — — 5 12 5r10 0.05 6 15 5r10 0.1 8 19
N, Sample size ; d, decision value ; LT, lower threshold ; UT, upper threshold ; OPV, oral polio vaccine ; YFV, yellow fever vaccine ;S.D., standard deviation.
1·0 0·9 0·8 0·7 0·6 0·5 0·4 0·3 0·2 0·1 0 5 10 15 20 25 30 35 40 45 50 55 60 65 70 75 80 85 90 95 99 Probability Coverage (%) P accept SRS P accept 5×10 S.D.=0·05 P reject 5×10 S.D.=0·05 P accept 5×10 S.D.=0·1 P reject 5×10 S.D.=0·1 P reject SRS
Fig. 1. Operating characteristic curves for lot quality assurance sampling rule-rejecting programmes with more than seven defectives in a sample of 50, according to simple random sampling (SRS) and the two 5r10 clustered designs (S.D.=0.05 and S.D.=0.10).
or densely populated districts that may present unique challenges.
(4) A drop-out rate between the first and third doses of routine infant DTP-HepB vaccine above 10 %, reflecting problematic routine immunization ser-vices [24].
(5) The district has a border with a neighbouring country ; in this case, cross-border influx of per-sons seeking vaccination could mask a low coverage in the resident population of the district. (6) District with a complex situation, such as conflict, hosting refugees or internally displaced persons or other circumstances that could challenge cam-paign implementation.
(7) Previous campaigns resulted in low immunization coverage in the district ; some districts may regu-larly have difficulties achieving national pro-gramme targets for a variety of reasons.
We assigned a point each time a district fulfilled one of the criteria and selected the 12 districts with the highest rank, ensuring that all the target regions of Cameroon and the two main cities Yaounde´ and Douala, were represented by at least one district. We selected the remaining five districts from those re-porting the lowest preliminary YF administrative coverage on the second day of the campaign (Table 2).
Sampling and data collection
Since our objective was to use clustered-LQAS for mid-campaign evaluation, we conducted the survey
during the last 4 days of the campaign (days 5–8). For each antigen, we interviewed 50 eligible individuals per lot (district) for vaccination status, divided into five clusters of 10. In each district we randomly selected five health areas. In each health area we ran-domly selected a locality (village or neighbourhood). Next, we randomly selected the first household in the cluster according to geographic random sampling : we drafted a map of the locality, divided it into smaller sectors according to existing divisions (streets, rivers, etc.), and randomly selected one sector where we chose the most central household to start the survey. In the selected household, we interviewed for YF vaccination status only one eligible individual ran-domly selected and all eligible individuals for OPV. If the individuals selected were aged<10 years we asked a parent or caregiver to answer the questions on their behalf. We then moved to the right of the household to select the subsequent households following a determined step. Based on the experience from pre-vious national household surveys in Cameroon and on the proportion of each target group in the popu-lation, the step used was nine households for YF and three for polio in rural areas ; 18 for YF and six for polio in urban areas.
Since the campaign was in progress, we ensured that the survey was conducted in the localities already covered by vaccination activities, by instructing sur-veyors to obtain this information at district level. If a selected locality had not yet been covered, surveyors waited until the last day of the evaluation to cover it
1·0 0·9 0·8 0·7 0·6 0·5 0·4 0·3 0·2 0·1 0 5 10 15 20 25 30 35 40 45 50 55 60 65 70 75 80 85 90 95 99 Probability Coverage (%) P accept SRS P accept 5×10 S.D.=0·05 P reject 5×10 S.D.=0·05 P accept 5×10 S.D.=0·1 P reject 5×10 S.D.=0·1 P reject SRS
Fig. 2. Operating characteristic curves for lot quality assurance sampling rule-rejecting programmes with more than three defectives in a sample of 50, according to simple random sampling (SRS) and the two 5r10 clustered designs (S.D.=0.05 and S.D.=0.10).
with the clustered-LQAS survey. We used two stan-dardized questionnaires for data collection.
We did not stop sampling once the number of un-vaccinated individuals exceeded d in the lot (i.e. the lot was rejected), and we always completed the sample (N=50).
Administrative vaccination coverage
Tally sheets were used to record the number of per-sons vaccinated each day and data were transmitted daily through each level of the health system. Thus administrative coverage figures were available day by day during the campaign.
Planning the clustered-LQAS surveys in the field The LQAS study team planned the mid-campaign evaluation in collaboration with the campaign coordination committee at central level. Campaign technical supervisors were sent to coordinate the campaign at regional level and were fully aware of the purposes of the LQAS surveys. During the mid-campaign evaluation, the LQAS survey teams were instructed to participate at the daily vaccination campaign meetings at district level and discuss the
daily results of LQAS with the health officers. The purpose of these meetings was to interpret all infor-mation from the field to guide the final efforts of the campaign. LQAS supervisors also sent telephone text messages on the performance of each health district undergoing evaluation every day and especially dur-ing an emergency when the district was rejected (as soon as d was exceeded in the lot). In the rejected lots, the campaign coordination committee recommended immediate mop-up activities and also considered an extension of vaccination activities.
Data analysis
The statistical simulations for calculation of the clus-tered-LQAS plans were run with Stata [25]. We en-tered data in Epidata [26] and analysed it with Stata [25]. During the campaign, in order to take corrective action based on objective information, we considered as unvaccinated any individual not presenting proof of vaccination. At a later stage, we also analysed whether accepting verbal information on vaccination status would have affected our decision.
We analysed the impact of the measures taken fol-lowing the outcomes of the clustered-LQAS on YF administrative coverage. We compared districts with Table 2. Classification for being at risk of low coverage and yellow fever vaccination coverage in the 17 districts retained for the clustered lot quality assurance sampling survey, Cameroon, May 2009
Region District Low coverage risk classification* Administrative YFV coverage on day 5 (%) Final administrative YFV coverage (%) West Bangante´ 3 67.7 87.8 North Tchollire´ 2 87.2 104.9
Extreme North Maroua Urban LC-D2# 93.1 124.1
Ve´le´ LC-D2 67.5 125.6
Yagoua 3 48.0 105.7
Kousseri 3 49.9 75.4
Koza 3 64.2 88.0
Mogode´ 3 77.2 129.7
East Garoua Boulaı¨ 3 83.2 99.4
Nguelemendouka LC-D2 60.8 91.3
South Djoum 1 94.6 96.5
Centre Mbandjock LC-D2 71.5 95.3
Bafia 3 48.5 69.4
Adamaoua Djohong 2 81.3 94.5
Douala New Bell 3 77.5 93.1
Yaounde´ Biyem Assi 3 66.8 107.6
Cite´ Verte LC-D2 72.6 103.3
YFV, Yellow fever vaccination.
* Numbers 1–3 reflect the number of risk criteria for low vaccination coverage, assessed prior to the campaign. # LC-D2, Lowest administrative YFV coverage at campaign day 2.
or without intervention with regards to the mean preliminary YF administrative coverage reported at day 5 of the campaign and the final administrative coverage at the end of the campaign in the two groups, using the Wilcoxon/Mann–Whitney test with Pf0.05 as threshold for statistical significance.
We also calculated the standard error (S.E.) from the mean lot coverage for the proportion vaccinated in the five clusters as a measure of inter-cluster varia-bility and checked if this exceeded theS.D. of 0.05 and 0.1 from the mean lot coverage hypothesized in the statistical simulations. We used the maximum stan-dard errors found in the lots as the measure of inter-cluster variability to recalculate alpha and beta with the simulation program.
R E S U L T S
Evaluation of OPV coverage
Of the 17 surveyed districts, 14 (82.4 %) were rejected for low OPV coverage on day 5 of the vaccination campaign due to exceeding the threshold of three un-vaccinated individuals, based on documented vacci-nation status. Allowing verbal report of vaccivacci-nation, we would have rejected 11 (64.7 %) (Table 3).
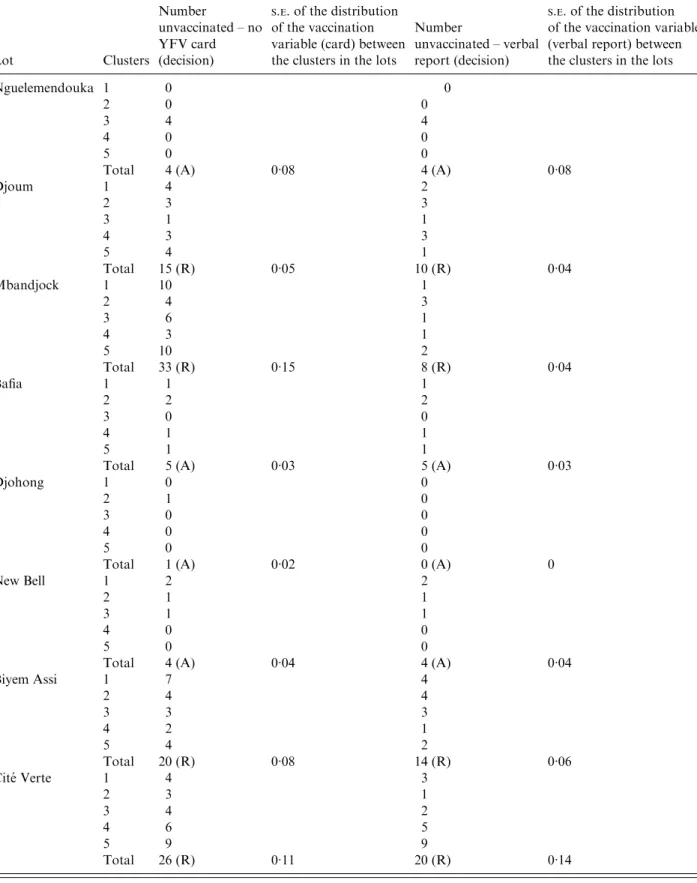
Evaluation of YF vaccination coverage
Ten districts (58.8 %) were rejected for low YF vac-cination coverage by the LQAS rule due to exceeding the threshold of seven unvaccinated individuals, based on documented vaccination status. Allowing verbal report of vaccination, we would have rejected seven districts (41.2 %) (Table 4).
Control measures
Measures were taken at district level to increase OPV and YF vaccination coverage before the end of the campaign in the rejected lots and, given the high proportion of rejected districts across Cameroon, a 2-day extension of the campaign was recommended nationally to increase vaccine coverage.
Intervention analysis
The final administrative coverage was 96.3 % nationally for OPV and 100.5 % for YF. The mean increase in the final YF administrative vaccination coverage levels compared with day 5 was higher in the 10 districts initially rejected [mean increase 51.3 %,
95 % confidence interval (CI) 27.3–75] than in the seven accepted ones (mean increase 31.5 %, 95 % CI 16.9–46.1), although the difference was not statisti-cally significant. The initially rejected districts ap-peared to have a significantly higher (P=0.05) final YF administrative vaccination coverage (mean ad-ministrative coverage 106.4 %, 95 % CI 95.3–117.4) compared to the accepted ones (mean administrative coverage 89.7 %, 95 % CI 77.9–101.5) (Table 2).
Inter-cluster variability
Among the districts evaluated for YF vaccination coverage, the S.E. of the distribution of the binary variable vaccinated/unvaccinated in the five clusters within the lots ranged between 0 and 0.19. It exceeded 0.1 in 23.5 % (4/17) of lots ; in 41.2 % (7/17) it was between 0.05 and 0.1, and in 35.3 % (6/17) it was below 0.05.
Among the districts evaluated for OPV coverage, theS.E. of the distribution of the binary variable vac-cinated/unvaccinated in the five clusters within the lots also ranged between 0 and 0.19. In 10/17 (58.8 %) lots it exceeded 0.1 ; in 5/17 (29.4 %) it was between 0.05 and 0.1, and in 2/17 (11.8 %) it was below 0.05. Setting 0.19 inter-cluster variability in the simula-tions, gave alpha=17% and beta=26% in the YF plan ; while in the OPV plan alpha was 20 % and it was not possible to calculate beta since 0.19 varia-bility around the 95 % upper threshold did not fit in the simulations.
D I S C U S S I O N
During the YF and polio vaccination campaign in Cameroon, we used clustered-LQAS [4] to assess vaccination coverage in 17 lots (health districts) pur-posely selected as being at higher risk for inadequate coverage. The proportion of districts rejected as having low coverage was high : 59 % for YF vaccination and 82 % for OPV, using the vaccination card or fingernail mark as proof of vaccination. Based on these findings a 2-day extension of the campaign was recommended nationally by the Ministry of Health to increase vac-cination coverage. The districts initially rejected for low YF vaccination coverage presented a significantly higher final administrative YF vaccination coverage compared to those initially accepted, suggesting that interventions to increase coverage at district level and nationally may have been effective.
Table 3. Oral polio vaccination coverage findings of clustered lot quality assurance sampling survey, Cameroon, May 2009
Lot Clusters
No. unvaccinated with OPV – fingernail ink mark absent (decision)
S.E. of the distribution of the vaccination variable (mark) between the clusters in the lots
No. unvaccinated with OPV – by verbal report (decision)
S.E. of the distribution of the vaccination variable (verbal report) between the clusters in the lots
Bangante´ 1 6 1 2 3 0 3 0 0 4 0 0 5 8 3 Total 17 (R) 0.16 4 (R) 0.06 Tchollire´ 1 0 0 2 3 3 3 0 0 4 0 0 5 0 0
Total 3 (A) 0.06 3 (A) 0.06
Maroua Urban 1 4 0 2 5 2 3 3 3 4 0 0 5 7 7 Total 19 (R) 0.12 12 (R) 0.13 Ve´le´ 1 3 0 2 3 1 3 1 0 4 9 7 5 1 0 Total 17 (R) 0.15 8 (R) 0.14 Yagoua 1 6 4 2 1 1 3 8 5 4 7 4 5 0 0 Total 22 (R) 0.16 14 (R) 0.10 Kousseri 1 1 2 2 6 3 3 9 0 4 8 1 5 2 0 Total 26 (R) 0.16 6 (R) 0.06 Koza 1 0 0 2 3 3 3 5 3 4 3 0 5 0 0 Total 11 (R) 0.10 6 (R) 0.07 Mogode´ 1 0 0 2 0 0 3 0 0 4 1 1 5 0 0
Total 1 (A) 0.02 1 (A) 0.02
Garoua Boulaı¨ 1 0 0
2 0 0
3 0 0
4 0 0
5 0 0
Table 3 (cont.)
Lot Clusters
No. unvaccinated with OPV – fingernail ink mark absent (decision)
S.E. of the distribution of the vaccination variable (mark) between the clusters in the lots
No. unvaccinated with OPV – by verbal report (decision)
S.E. of the distribution of the vaccination variable (verbal report) between the clusters in the lots
Nguelemendouka 1 2 2 2 0 0 3 6 0 4 0 0 5 0 0 Total 8 (R) 0.12 2 (A) 0.04 Djoum 1 10 2 2 1 1 3 4 1 4 10 0 5 2 2 Total 27 (R) 0.19 6 (R) 0.04 Mbandjock 1 9 6 2 9 0 3 5 5 4 6 4 5 10 1 Total 39 (R) 0.10 16 (R) 0.12 Bafia 1 3 2 2 2 0 3 0 0 4 2 0 5 10 0 Total 17 (R) 0.17 2 (A) 0.04 Djohong 1 0 0 2 5 4 3 0 0 4 2 0 5 10 10 Total 17 (R) 0.19 14 (R) 0.20 New Bell 1 3 1 2 0 0 3 3 0 4 0 0 5 2 0 Total 8 (R) 0.07 1 (A) 0.02 Biyem Assi 1 6 3 2 1 1 3 5 3 4 3 1 5 3 1 Total 18 (R) 0.09 9 (R) 0.05 Cite´ verte 1 0 0 2 8 3 3 3 1 4 8 4 5 5 4 Total 24 (R) 0.15 12 (R) 0.08
Table 4. Yellow fever vaccination coverage findings of clustered lot quality assurance sampling survey, Cameroon, May 2009 Lot Clusters Number unvaccinated – no YFV card (decision) S.E. of the distribution of the vaccination variable (card) between the clusters in the lots
Number
unvaccinated – verbal report (decision)
S.E. of the distribution of the vaccination variable (verbal report) between the clusters in the lots
Bangante´ 1 3 0 2 1 0 3 5 2 4 2 1 5 5 2 Total 16 (R) 0.08 5 (A) 0.04 Tchollire´ 1 3 0 2 0 0 3 0 0 4 1 0 5 2 0
Total 6 (A) 0.06 0 (A) 0
Maroua Urban 1 2 1 2 4 2 3 1 1 4 1 1 5 4 4 Total 12 (R) 0.07 9 (R) 0.06 Ve´le´ 1 5 4 2 4 3 3 5 5 4 6 4 5 4 4 Total 24 (R) 0.04 20 (R) 0.03 Yagoua 1 10 1 2 1 1 3 8 4 4 3 1 5 1 1 Total 23 (R) 0.19 8 (R) 0.06 Kousseri 1 0 0 2 0 0 3 1 0 4 1 0 5 0 0
Total 2 (A) 0.02 0 (A) 0
Koza 1 1 1 2 3 3 3 7 0 4 1 1 5 3 0 Total 15 (R) 0.11 5 (A) 0.05 Mogode´ 1 2 2 2 0 0 3 0 0 4 2 2 5 4 3 Total 8 (R) 0.07 7 (A) 0.06 Garoua Boulaı¨ 1 0 0 2 0 0 3 0 0 4 0 0 5 0 0
Table 4 (cont.) Lot Clusters Number unvaccinated – no YFV card (decision) S.E. of the distribution of the vaccination variable (card) between the clusters in the lots
Number
unvaccinated – verbal report (decision)
S.E. of the distribution of the vaccination variable (verbal report) between the clusters in the lots
Nguelemendouka 1 0 0
2 0 0
3 4 4
4 0 0
5 0 0
Total 4 (A) 0.08 4 (A) 0.08
Djoum 1 4 2 2 3 3 3 1 1 4 3 3 5 4 1 Total 15 (R) 0.05 10 (R) 0.04 Mbandjock 1 10 1 2 4 3 3 6 1 4 3 1 5 10 2 Total 33 (R) 0.15 8 (R) 0.04 Bafia 1 1 1 2 2 2 3 0 0 4 1 1 5 1 1
Total 5 (A) 0.03 5 (A) 0.03
Djohong 1 0 0
2 1 0
3 0 0
4 0 0
5 0 0
Total 1 (A) 0.02 0 (A) 0
New Bell 1 2 2
2 1 1
3 1 1
4 0 0
5 0 0
Total 4 (A) 0.04 4 (A) 0.04
Biyem Assi 1 7 4 2 4 4 3 3 3 4 2 1 5 4 2 Total 20 (R) 0.08 14 (R) 0.06 Cite´ Verte 1 4 3 2 3 1 3 4 2 4 6 5 5 9 9 Total 26 (R) 0.11 20 (R) 0.14
We used clustered-LQAS for mid-campaign evalu-ation ; while this approach allows time to implement mop-up activities, undertaking an assessment based on final targets before the end of the time allocated to achieve the target will evidently result in under-estimation of coverage. To overcome this limitation, we instructed surveyors to first survey the selected localities already covered by vaccination, especially during the first day of the evaluation. It was, however, difficult in some cases to establish which localities were covered at lower administrative levels while in the field.
Relying on verbal confirmation of vaccination sta-tus, we would have rejected fewer districts : 41 % for YF vaccination and 65 % for OPV. The possible overestimation of vaccination coverage using verbal confirmation is a potential problem during the evalu-ation of vaccinevalu-ation activities [27, 28]. We therefore opted to base operational conclusions on reliable vaccination information to increase the likelihood of timely evidence-based intervention. The frequent ab-sence of documented proof of vaccination was sur-prising since the evaluation was conducted during the campaign when card retention should still be high, suggesting a failure in ensuring adequate supply, de-livery and use of vaccination cards and finger-mark-ing durfinger-mark-ing the campaign.
We explored dividing lots into five clusters, rather than using SRS, to increase the feasibility and timeli-ness of LQAS conducted at district level and re-calculated the statistical errors using computer simulations [4]. Although this did not happen in Cameroon, with decision values of three and seven in a 5r10 sample, it may be difficult to justify the de-cision on the whole lot if d is exceeded only in one cluster, especially in the case of villages selected as clusters completely missed by vaccination. To over-come this limitation, it is important to interpret the clustered-LQAS findings with other data including the administrative coverage and local information.
In a previous experience with this approach, we were reassured of the homogeneity of the territory through calculating inter-cluster correlation (ICC) of field data [10]. In this study, clusters were too few and small to calculate any reliable ICCs. Therefore, we accounted for clustering in each lot by calculating the S.E. of the proportion of vaccinated in the clusters, as a measure of inter-cluster variability, which exceeded 0.1 in 23.5 % of the lots assessed for YF coverage and in 58.8 % of the lots assessed for OPV coverage. Assuming that the maximum inter-cluster variability
in the lots was reallyS.E.=0.19, this would have pro-duced unreliable decision rules with alpha up to 17 % and beta up to 26 % (yellow fever plan) and with alpha up to 20 % and beta theoretically up to 100 % (OPV plan). This confirms that clustered-LQAS is unreliable if the territory under study is very hetero-geneous with regard to immunization coverage and that theS.D. from the mean lot coverage is>0.1 in the clusters [4].
The higher proportion of districts rejected for low OPV coverage suggests that the polio campaign was less successful than the YF campaign in reaching the target. However this may also depend on the sampling plan used for OPV. To keep N to a manageable size, allowing also for clustering, we had to be more toler-ant towards the risk of error [29]. We gave priority to keeping alpha lower rather than beta, especially in the OPV plan, preferring to be strict in not accepting districts with low coverage (a risk for the population), rather than to reject districts with good coverage (a risk for the healthcare system) [30]. Such a study design may have produced a higher proportion of false positives (districts with high coverage rejected by the LQAS rule) rather than false negatives (districts with low coverage accepted by the LQAS rule) [31]. In addition the polio plan had a shorter grey area (10 %) that increased the risk of error considerably and also the sampling strategy used, which recommended sampling all the individuals in the target group in the selected household, rather than selecting one ran-domly, may have increased clustering and the likeli-hood of error.
To select lots for assessment, we calculated theS.D. from the mean administrative vaccination coverage in all the districts targeted by the campaign to assess if districts may have been presenting vaccination coverage below or above that expected, thus being at risk of low vaccination coverage. Although this approach is standardized and reproducible, it may be more practical to agree on fixed vaccination coverage thresholds that should always be used in different settings in order to increase the practicality of the risk assessment. The pre-selection of two thirds of districts according to available information allowed for maximizing efficiency in preparing the survey, while reserving the option of deploying teams to ad-ditional districts based on early vaccination data also ensured the immediate operational relevance of the exercise.
Although our study suggests that the clustered-LQAS survey may have been effective in improving
coverage (especially in rejected districts), it is difficult to demonstrate this statistically given the small sample of 17 districts and the fact that at-risk districts were purposefully selected. It would be useful to check if results of other monitoring tools are consistent with the clustered-LQAS findings and compare the results of the simulation with real field data [9]. This was not possible as household and external convenience monitoring were not done in the same districts as the clustered-LQAS survey, and the final vaccination coverage survey was administered at regional not district level [32], therefore we opted to compare the two different plans used (OPV and YF) with each other.
This is the first experience using clustered-LQAS in the field since this new variant of the methodology has been standardized [4]. The use of clustered-LQAS for mid-campaign evaluation was successful in monitor-ing the progress of the campaign in at-risk districts, allowing authorities to implement timely interven-tions in the rejected lots. Reasons why a district was rejected may have been : poor micro-planning, failure of social mobilization, or accessibility problems.
Dividing the survey sample in each lot into five small clusters increased operational feasibility, while respecting the scientific rationale underpinning the LQAS methodology. We recommend the use of clus-tered-LQAS as an operational tool to guide the final efforts of vaccination campaigns. To ensure sufficient precision of the clustered-LQAS plans we recommend keeping the grey area in the plans to at least 15 % if users want to divide the sample in five clusters. We recommend clustered-LQAS to evaluate immuniz-ation programmes that perform well, where it is unlikely to find villages completely missed by vacci-nation activities. To improve accuracy of the assess-ment, the survey should be implemented as close to the end of the campaign as possible, while still allow-ing time for operational decision-makallow-ing to im-plement mop-up activities. We recommend improved planning and monitoring for the logistics and distri-bution of proof of vaccination (cards or ink mark as appropriate) and inclusion of card retention as a key message for the public during social mobilization. The LQAS component should be included in the planning of the campaign and the tools adapted accordingly (e.g. plan extra days in the tally sheets for adminis-trative vaccine coverage monitoring in case the dis-trict is rejected). Further refinement of this method may be necessary to decide on intermediate coverage thresholds lower than the campaign coverage target,
based on the experience of the country. Further studies could compare the use of clustered-LQAS with other monitoring tools in the same target popu-lation to verify consistency of results [1, 9]. The results of the clustered-LQAS conducted during the cam-paign could also be validated with the results of the post-campaign coverage surveys [33] if these are planned in the same territory to evaluate the cam-paign. The performance of clustered-LQAS plans divided in more than five clusters could also be tested in the field.
A C K N O W L E D G E M E N T S
The study was co-funded by the WHO Yellow Fever Initiative, under a grant from the GAVI Alliance and the WHO Immunization, Vaccines and Biologicals Department. The authors thank the health workers and enumerators in Cameroon who implemented the survey and made the study possible. We are grateful to Dr William Perea for reviewing the survey protocol and to Dr Fenella Avokey for support.
D E C L A R A T I O N O F I N T E R E S T None.
R E F E R E N C E S
1. Dietz V, et al. Assessing and monitoring vaccination coverage levels : lessons from the Americas. Revista Panamericana de Salud Publica2004 ; 16 : 432–442. 2. WHO. Monitoring immunization services using the Lot
Quality Technique. Geneva : World Health Organiz-ation, 1996.
3. Lemeshow S, Taber S. Lot quality assurance sampling : single- and double-sampling plans. World Health Statistics Quarterly1991 ; 44 : 115–132.
4. Pezzoli L, Andrews N, Ronveaux O. Clustered lot qual-ity assurance sampling to assess immunisation cover-age : increasing rapidity and maintaining precision. Tropical Medicine and International Health 2010 ; 15 : 540–546.
5. Tawfik Y, Hoque S, Siddiqi M. Using lot quality assur-ance sampling to improve immunization coverage in Bangladesh. Bulletin of the World Health Organization 2001 ; 79 : 501–505.
6. Corbella JA, Grima CP. Lot sampling plans in the measure of quality of care indicators. International Journal for Quality in Health Care1999 ; 11 : 139–145. 7. Deitchler M, et al. A field test of three LQAS designs
to assess the prevalence of acute malnutrition. International Journal of Epidemiology 2007 ; 36 : 858– 864.
8. Olives C, et al. Cluster designs to assess the prevalence of acute malnutrition by lot quality assurance sam-pling : a validation study by computer simulation. Journal of the Royal Statistical Society, Series A2009 ; 172 : 495–510.
9. Deitchler M, Deconinck H, Bergeron G. Precision, time, and cost : a comparison of three sampling designs in an emergency setting. Emerging Themes in Epidemiology 2008 ; 5 : 6.
10. Pezzoli L, et al. Cluster-sample surveys and lot quality assurance sampling to evaluate yellow fever immunis-ation coverage following a nimmunis-ational campaign, Bolivia, 2007. Tropical Medicine and International Health 2009 ; 14 : 355–361.
11. Briand S, et al. Assessment of yellow fever epidemic risk : an original multi-criteria modeling approach. PLoS Neglected Tropical Diseases2009 ; 3 : e483. 12. WHO. Yellow fever situation in Africa and South
America, 2005. Weekly Epidemiological Record 2006 ; 81 : 317–324.
13. WHO. Yellow fever in Africa and South America, 2007. Weekly Epidemiological Record2009 ; 84 : 97–104. 14. Barnett ED. Yellow fever : epidemiology and
preven-tion. Clinical Infectious Diseases 2007 ; 44 : 850–856. 15. Wiysonge CS, et al. Yellow fever control in Cameroon :
where are we now and where are we going ? BMC Medicine2008 ; 6 : 3.
16. Adeleke MA, et al. Mosquito larval habitats and public health implications in Abeokuta, Ogun State, Nigeria. Tanzania Journal of Health Research2008 ; 10 : 103–107. 17. Kuniholm MH, et al. Seroprevalence and distribution of Flaviviridae, Togaviridae, and Bunyaviridae arboviral infections in rural Cameroonian adults. American Journal of Tropical Medicine and Hygiene 2006 ; 74 : 1078–1083.
18. Dutta A. Epidemiology of poliomyelitis – options and update. Vaccine 2008 ; 26 : 5767–5773.
19. WHO. Performance of acute flaccid paralysis (AFP) surveillance and incidence of poliomyelitis, 2010 (data received in WHO headquarters as of June 1 2010). Weekly Epidemiological Record2010 ; 85 : 244–247. 20. Modlin JF. The bumpy road to polio eradication. New
England Journal of Medicine2010 ; 362 : 2346–2349. 21. Singh P, Das JK, Dutta PK. Eradicating polio : its
feasibility in near future ? Journal of Communicable Diseases2008 ; 40 : 225–32.
22. Global Polio Eradication Initiative. Wild poliovirus weekly update, August 2010 (http://www.polioeradication. org/casecount.asp).
23. Global Polio Eradication Initiative. Guidelines for inde-pendent monitoring of polio supplementary immuniza-tion activities (SIA), October 2011 (http://www. polioeradication.org/Portals/0/Document/Resources/ PolioEradicators/IndependentMonitoringGuidelines_ 20101124.pdf ).
24. Vandelaer J, Bilous J, Nshimirimana D. Reaching Every District (RED) approach : a way to improve im-munization performance. Bulletin of the World Health Organization2008 ; 86 : A–B.
25. Stata Corporation. Statistical software : release 10 (computer program), 2008.
26. Bohigas PA, Lauritsen JL. EpiData : the natural heir to EpiInfo 6 ? Gaceta Sanitaria 2007 ; 21 : 264–266. 27. Suarez L, Simpson DM, Smith DR. Errors and correlates
in parental recall of child immunizations : effects on vaccination coverage estimates. Pediatrics 1997 ; 99 : E3.
28. Bolton P, et al. Estimating vaccination coverage using parental recall, vaccination cards, and medical records. Public Health Reports1998 ; 113 : 521–526.
29. Myatt M, Bennett DE. A novel sequential sampling technique for the surveillance of transmitted HIV drug resistance by cross-sectional survey for use in low re-source settings. Antiviral Therapy 2008 ; 13 (Suppl. 2) : 37–48.
30. Sandiford P. Lot quality assurance sampling for moni-toring immunization programmes : cost-efficient or quick and dirty ? Health Policy and Planning 1993 ; 8 : 217–223.
31. Bilukha OO, Blanton C. Interpreting results of cluster surveys in emergency settings : is the LQAS test the best option ? Emerging Themes in Epidemiology 2008 ; 5 : 25.
32. Institut National de la Statistique. Post-campaign coverage survey following the preventive vaccination campaign against yellow fever and poliomyelitis in high risk districts of Cameroon in May 2009 [in French]. Yaounde´, Cameroon, June 2009.
33. Bennett S, et al. A simplified general method for cluster-sample surveys of health in developing countries. World Health Statistics Quarterly Rapport Trimestriel de Statistiques Sanitaires Mondiales1991 ; 44 : 98–106.