Annals of Botany 88: 1071-1078, 2001
doi:10.1006/anbo.2001.1551, available online at http://www.idealibrary.com on
Phenotypic Plasticity of Grass Root Anatomy in Response to Light Intensity and
Nutrient Supply
STEFAN WAHL, PETER RYSER* and PETER J. EDWARDS
Geobotanisches Institut ETH Zurich, Gladbachstr. 114, 8044 Zurich, Switzerland
Received: 19 April 2001 Returned for revision: 3 July 2001 Accepted: 2 September 2001 Published electronically: 24 October 2001
The phenotypic plasticity of axial root anatomy was investigated in response to the availability of above- and below-ground resources using eight grass species of the genera Bromus and Poa. In a 7-week garden experiment nutrients were varied by a factor of five and light treatments of 100, 30 and 5-5 % daylight were applied. Both nutrients and light influenced root structure. The effect of nutrients was largely explained by plant size, but this was not the case for light. Shading to 30 % daylight led to a higher proportion of stele, larger stelar cells and larger xylem vessels. This can be understood either as an increased need for high transport capacity in the shade, where leaf area is larger but root mass lower than in full daylight, or as an increased resistance against desiccation, which is more of a hazard in open sites. Under 5-5 % daylight, tissue mass density was reduced due to a lower proportion of stele, though xylem characteristics were not influenced when a correction for the effect of root cross-sectional area was applied. This response may be interpreted as a mechanism to maintain root function with a lower investment in biomass when growth is limited by low irradiance. The results show that the response of a plant to resource limitation is not restricted to those organs responsible for the acquisition of that resource. Furthermore, the qualitative response to shading depends on the absolute level of irradiance. For this reason, care is needed when comparing the results of shading experiments conducted under different irradiances. © 2001 Annals of Botany Company Key words: Bromus, hydraulic conductivity, light, nutrients, phenotypic plasticity, Poa, Poaceae, root anatomy, stele.
I N T R O D U C T I O N
There is good reason to suppose that adjustments in anatomy and morphology of a plant in response to environ-mental conditions, i.e. phenotypic plasticity, are often adaptive, in the sense that they enhance the plant's fitness in that environment (Sultan, 2000). For example, plants tend to respond to resource limitation by allocating a larger proportion of their biomass to those organs involved in capturing the resource in shortest supply (Bloom et ai, 1985; Gedroc et al., 1996). Thus, nutrient depletion commonly leads to increased biomass allocation to roots, while shading causes increased allocation to leaves and/or stems (Corre
1983; Ryser and Lambers, 1995; Ryser and Eek, 2000). The capacity of plants to acquire resources above- and below-ground is not determined directly by the biomass of roots and leaves but by leaf surface area (Lambers and Poorter, 1992) and root length (Ryser, 1998); it is therefore affected by the morphology and anatomy of these organs. A large leaf area per unit mass or a long root system per unit mass can be a result of either thin leaves or thin roots, respectively, or a result of low tissue density (Dijkstra and Lambers, 1989; Witkowski and Lamont, 1991; Ryser and Lambers, 1995). Among grasses, there is a relationship between tissue density in leaves and the proportions of cell wall and sclerenchyma in leaf cross-sections (Gamier and Laurent, 1994; van Arendonk and Poorter, 1994). Tissue density in roots has been related to the proportion of stele, the proportion of cell wall in the stele, and to characteristics of the tracheary system (Wahl and Ryser, 2000).
* For correspondence. Fax +411 261 0595, e-mail ryser(5jgeobot. umnw.ethz.ch
0305-7364/01/121071+08 S35.00/00
We investigated phenotypic plasticity in the anatomical characteristics of roots in response to light and nutrient conditions. Such responses have been well studied in above-ground organs but less studied in roots. For example, it is known that under high light intensity many plants produce thicker leaves with more photosynthetically active tissue, while under shady conditions leaves have less sclerenchy-matous tissue and more leaf area per unit dry matter (Bjorkman, 1981; Strauss-Debenedetti and Bazzaz, 1991; Thompson et al., 1992). In contrast, leaves produced under low nutrient availability tend to contain a higher amount of sclerenchymatous tissue than those produced under high nutrient supply (van Arendonk et al., 1997), which increases their robustness and reduces damage and loss.
The plastic responses of roots to drought and anaerobic conditions have been studied in some detail. A lack of oxygen can lead to the development of more aerenchyma tissue (He et al., 1999), whereas drought causes increased deposition of suberin and lignin in the hypodermis and endodermis (Cruz et al., 1992), and deposition of hydro-phobic substances in epidermal cell walls (Watt et al., 1996). Less is known about phenotypic plasticity of roots in response to light or nutrients. In poplar, a high nutrient supply led to the production of larger xylem vessels (Harvey and van den Driessche, 1999). The grasses Dactylis
glomerata and Brachypodium pinnatum produced finer
roots with a higher tissue mass density when the supply of nitrogen or phosphorus was low (Ryser and Lambers, 1995). A decrease in root diameter and an increase in root tissue mass density have contrasting effects on specific root length, which has been found to increase, decrease or remain unchanged in response to low nutrient supply (Ryser, 1998). S- 2001 Annals of Botany Company
1072
The level of irradiance also influences root characteristics, compensating for the reduced biomass allocation to roots in shade. Shade-grown (30 % daylight) Dactylis glomerata and
D. polygama allocate less biomass to roots than those grown
in full daylight but have a higher specific root length; as a result, the total root length per plant and nutrient uptake are the same as under full daylight (Ryser and Eek, 2000). This indicates that phenotypic plasticity in root diameter and tissue mass density can also be due to variation in above-ground resources; however, the anatomical basis of these changes is unknown.
Interspecific variation in root anatomy and root diameter is closely associated with the ecological requirements of the plant species (Wahl and Ryser, 2000). The aim of this study was to investigate intraspecific variation in root structure in response to different availabilities of above- and below-ground resources. Which anatomical characteristics respond to nutrients and light, and to what extent can such responses be regarded as adaptive? We studied phenotypic plasticity in root anatomy in eight ecologically contrasting grass species. Grasses are convenient for such work because they are ecologically diverse and yet have a comparatively uniform growth form.
M A T E R I A L S A N D M E T H O D S
Experimental design and treatments
Eight grass species belonging to the genera Bromus and Poa were used (Table 1). The species selected, which included both annuals and perennials, varied widely in their habitat requirements with respect to nutrient and light conditions. Seeds were collected from populations in the Swiss Mittel-land or were obtained commercially from Fenaco Samer-eien, Winterthur, Switzerland (P. trivialis and P. annud). They were sown on perlite in a glasshouse. After germina-tion, seedlings were transplanted into 1 1 polyethylene bags (depth 0-32 m, width 0-064 m) containing quartz sand of 0-1-0-7 mm grain size. Small holes in the lower part of the bags ensured adequate drainage. There were six replicate plants per species and treatment combination.
T A B L E 1. The eight grass species studied, their indicator
values for nutrients and light and their characteristic habitat Ellenberg
indicator values
Bromus erectus Huds. Bromus sterilis* L. Bromus tectorum* L. Poa anguslifolia L. Poa annua* L. Poa nemoralis L. Poa pratensis L. Poa trivialis L. Nutrients 3 5 4 3 8 4 6 7 Light 8 7 8 7 7 5 6 6 Habitat Limestone grasslands Road verges, arable land Road verges, wasteland Dry grasslands Arable fields, wasteland Deciduous woodlands Productive grasslands Moist productive grasslands The indicator values according to Ellenberg et al. (1992) express nutrient or light availability in the characteristic habitat on a scale from 1 (low availability) to 9 (high availability). Annual species are indicated with an asterisk.
Six treatment combinations with three photon flux densities (PFD; 100, 30, 5-5% daylight) and two levels of nutrient supply were applied in a factorial design in an experimental garden at Zurich, Switzerland. The shade treatments were produced using frames (3 x 4 x 2-3 m) covered with an aluminium-coated shade cloth (OLS 60 and a combination of OLS 80 and black plastic net for 30 % PFD and 5-5 % PFD, respectively; Ludwig Svensson, Kinna, Sweden). Shading treatments were replicated in two blocks. The measured,mean PFD values for the two levels of shading were 30-4 + 0-4 % and 5-5 + 0-2 % of the unshaded treatment. The influence of shading treatment on the microclimate was generally small. In the tents with 5-5 % PFD, afternoon maximum temperatures of 20-25°C outside were reduced by 2-3°C, whereas the nightly minima in the tents of approx. 5°C were about 1°C higher than outside. On a sunny day relative humidity was 50-60 % inside the shadiest tents, compared to 30-40 % outside. The influence of the 30 % PFD treatment on temperature and humidity was less than that of the 5-5 % PFD treatment.
The two nutrient treatments differed by a factor of five in the amount of nutrients applied. Nutrients were supplied weekly as 90 ml of diluted Hoagland solution containing (low/high): 18-4/91-9 umol KH2PO4, 61-3/306 umol KNO3,
29-4/147 umol Ca(NO3)2, 16-6/83-1 umol MgSO4, 0-009/
0044 umol CuSO4, 00034/0017 umol ZnSO4, 0-074/
0-370 umol MnCl2, 0-19/0-95 umol H3BO3, 0002/
0010 umol Na2MoO4, 0009/0044 umol FeCl3 and 0-01/
005 umol tartaric acid. For the first week all plants received the low nutrient treatment; the different nutrient treatments were initiated subsequently. To avoid any treatment effects of water availability, the polyethylene bags were placed in trays filled with 30 mm water. Capillary movement ensured a continuous water supply to the plants.
Harvest and measurements
Plants were harvested on 25 Jun. 1997 after a growth period of 7 weeks, and were separated into above-ground biomass and roots. Fresh mass of above-ground parts was measured immediately after harvest, and dry mass after drying for at least 24 h at 70 °C.
To measure root tissue mass density, one nodal root per plant measuring 25-35 cm in length was selected. The root was rinsed in tap water to remove the sand and a section approx. 30 mm long was cut from the middle of the root. A sub-sample approx. 20 mm long was stored in 70 % ethanol for anatomical studies while the remainder was used to determine tissue mass density. For this purpose, root diameter was measured with a light microscope, and the volume was calculated by multiplying the cross-sectional area by the length, assuming a cylindrical form. Root samples were dried at 70cC for at least 24 h and the dry mass was determined to a precision of ±2 ug using an analytical balance (MT 5, Mettler Toledo GmbH, Greifensee, Switzerland). Root tissue mass density was calculated as dry mass per volume (mg mm"3).
For anatomical measurements, the root pieces were embedded in 2-hydroxyethylmethacrylate (HEMA), also known as GMA (Igersheim and Cichocki, 1996). Slices
Wahl et al.—Phenotypic Plasticity of Grass Roots 1073 4 urn thick were cut with a microtome. To distinguish cell
walls from the background, the material was stained with Toluidine Blue, which stains lignin blue-green and cellulose and polycarboxylic acids red to reddish purple (O'Brien
et al., 1964; Gerlach, 1984). The sections were examined by
light microscopy (x 100 and x200) and digital images were obtained using a video camera (JVC TK 1280) connected to a computer.
We used the public domain NIH Image program version 1-62 (developed at the U.S. National Institute of Health and available on the Internet) on a Macintosh computer to measure various anatomical features. The cross-sectional areas (CSA) of the whole root, of the stele, and of large metaxylem vessels were determined by tracing their outlines with the cursor. Based on these measurements, two ratios were calculated: CSA stele: CSA root and CSA xylem: CSA root. The number of stelar cells and xylem vessels was counted. The proportion of cell wall in the stele CSA (excluding xylem elements which were measured separately) was determined using randomly chosen segments represent-ing about 10 % of the total CSA. The lumen of the cells was outlined and subtracted from the total area of the segment.
Statistical analysis
For the statistical analyses, SyStat version 5-2 (SyStat Inc., Evanston, IL 1992) was used. A logarithmic trans-formation was used for size data, an arcsine-square root transformation for quotients, and a square root trans-formation for count data (Sokal and Rohlf, 1995). A three-factorial ANOVA was used with species, nutrient treatment and light treatment as factors. The two plots for each light treatment were used as the split-plot factor. When analysing treatment effects on plant morphology and anatomy it is important to differentiate between allometric effects, i.e. treatment effects which are a result of differences in plant size between treatments, and genuine phenotypic plasticity (Coleman et al., 1994). To correct for allometric effects, we used the log-transformed dry mass of above-ground plant parts as a covariate in the analyses of the above-ground dry mass to fresh mass ratio (DM/FMa) and root
cross-sectional area. For analyses of other root parameters, the log-transformed root CSA was used as covariate to correct for any effects it might have on anatomical characteristics.
Relationships between covariant and transformed values of the tested parameters were found to be linear.
RESULTS
Treatment effects on above-ground biomass and dry matter content
Both nutrient and light treatments had significant effects on the above-ground dry mass (DMa), and there was a
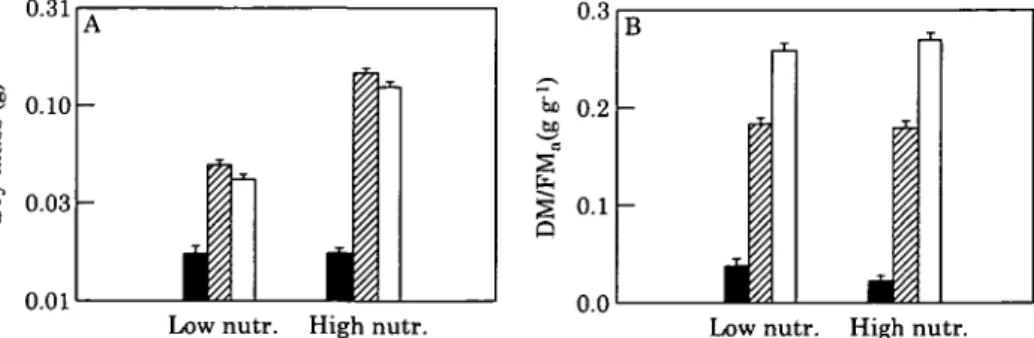
significant interaction between these factors (Fig. 1A; Table 2). In full daylight and at 30% PFD, above-ground biomass was more than three-times greater under high compared to low nutrient supply. At 5-5 % PFD there was no difference between the nutrient treatments. The two levels of shading had contrasting effects on growth. Under 30% daylight, above-ground biomass was slightly but significantly greater than under full daylight. In contrast, under 5-5% PFD, above-ground dry mass was only 14% of that in full daylight for the high nutrient treatment, and 42 % of that in full daylight for the low nutrient treatment. The nutrient and light treatments had contrasting effects on the dry mass to fresh mass ratio of the above-ground tissue (DM/FMa; Fig IB; Table 2). At 5-5% PFD, DM/
FMa was on average 41 % lower than in full daylight. Even
at 30 % PFD there was a significant response in above-ground tissue density, although growth was not reduced compared to full daylight (Fig. 1 A; Table 3). In contrast, a decrease in nutrient supply increased DM/FMa by 10%,
although the effect was only significant when size was included as a covariant in the analysis.
Root cross-sectional area and anatomy
The cross-sectional area of axile roots was significantly influenced both by nutrient and light treatments
(P < 0001); under high levels of both resources roots
tended to be thicker (Fig. 2A). However, root CSA was also closely associated with plant size: larger plants had thicker roots (Fig. 3). When the size effect was taken into account by including above-ground dry mass as a covariant in the analysis, the nutrient effect on root CSA was not significant, and the light effect was only weakly significant (Table 2).
All anatomical characteristics of the roots were signi-ficantly associated with root CSA (Table 2). Thus, as
c P 0.31 0.10 -0.03 -0.01 A
Low nutr. High nutr.
0.3 l*> 0.2 •SB 0.1 -0.0 B
i
I
i
i
Low nutr. High nutr.
FIG. 1. Above-ground dry mass (A) and above-ground dry mass to fresh mass ratio (DM/FMa; B) as a function of two levels of nutrient supply
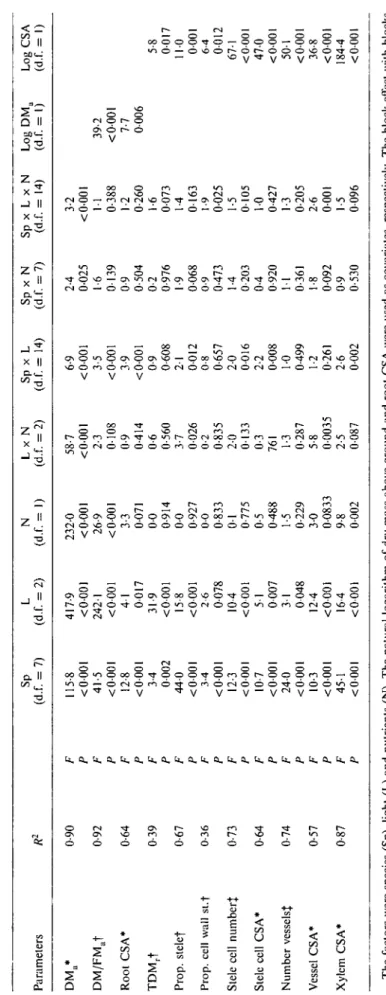
TABL E 2. Results of A NOVA for above-ground biomass (DMJ, dry mass to fresh mass ratio in above-ground organs (DMjFMJ, cross-sectional area (CSA) ofaxile roots, tissue mass density ofaxile roots (TDM r ) and the anatomical root traits: proportion of stele in root CSA, proportion of cell wall in stele CSA, number ofstelar cells, size of stelar cells (CSA), number of xylem vessels, mean xylem vessel CSA and total xylem CSA Parameter s R 2 S p (d.f . = 7 ) L (d.f . = 2 ) N (d.f . = 1 ) L x N (d.f . = 2 ) S p x L (d.f . = 14 ) S p x N (d.f . = 7 ) S p x L x N (d.f . = 14 ) Lo g DM a (d.f . = 1 ) Lo g CS A (d.f . = I ) DM a * DM/FM a t Roo t CSA * TDM r t Prop , stele f Prop , cel l wal l st. f Stel e cel l number j Stel e cel l CSA * Numbe r vessels | Vesse l CSA * Xyle m CSA * 0-9 0 0-9 2 0-6 4 0-3 9 0-6 7 0-3 6 0-7 3 0-6 4 0-7 4 0-5 7 0-8 7 F P F P F P F P F P F P F P F P F P F P F P 115-8 < 0-00 1 41-5 < 0-00 1 12-8 < 0-00 1 3-4 000 2 44 0 < 0-00 1 3-4 < 0-00 1 12 3 < 0-00 1 10 7 < 0-00 1 24 0 < 0-00 1 10 3 < 0-00 1 45-1 < 0-00 1 417-9 < 0-00 1 242-1 <000 1 4 1 001 7 31-9 < 0 00 1 15-8 < 0 00 1 2-6 007 8 10 4 < 0-00 1 5 1 000 7 3 1 004 8 12-4 < 0 00 1 16 4 <000 1 232-0 < 0-00 1 26-9 < 0-00 1 3-3 007 1 0 0 0-91 4 0 0 0-92 7 0-0 0-83 3 0 1 0-77 5 0-5 0-48 8 1-5 0-22 9 3 0 0083 3 9-8 0-00 2 58-7 <000 1 2-3 0-10 8 0-9 0-41 4 0-6 0-56 0 3-7 002 6 0-2 0-83 5 2-0 013 3 0-3 76 1 1-3 0-28 7 5-8 0-003 5 2-5 008 7 6-9 < 0-00 1 3-5 < 0-00 1 3-9 < 0-00 1 0-9 0-60 8 2-1 001 2 0-8 0-65 7 2 0 001 6 2-2 000 8 1-0 0-49 9 1-2 0-26 1 2-6 000 2 2-4 0-02 5 1-6 013 9 0-9 0-50 4 0-2 0-97 6 1-9 006 8 0-9 0-47 3 1-4 0-20 3 0-4 0-92 0 1 1 0-36 1 1-8 009 2 0-9 0-53 0 3-2 < 0-00 1 1 1 0-38 8 1-2 0-26 0 1-6 0-07 3 1-4 016 3 1-9 002 5 1-5 010 5 1 0 0-42 7 1-3 0-20 5 2-6 000 1 1-5 009 6 39-2 < 0-00 1 7-7 000 6 5-8 001 7 11 0 000 1 6-4 001 2 67-1 < 0-00 1 47 0 < 0-00 1 50-1 < 0-00 1 36-8 < 0-00 1 184-4 < 0-00 1 Th e factor s wer e specie s (Sp) , ligh t (L ) an d nutrient s (N) . Th e natura l logarith m o f dr y mas s above-groun d an d roo t CS A wer e use d a s covariates , respectively . Th e bloc k effec t wit h block s neste d withi n ligh t wa s no t significan t an d i s no t shown . R 2 an d degree s o f freedo m (d.f. ) ar e give n (tota l d.f . = 275) . Transformations : *natura l logarithm , tar e sine , {squar e root .
Wahl et al.—Phenotypic Plasticity of Grass Roots 1075 T A B L E 3. Contrasts between 100% and 30%, and between 30% and 5-5% photon flux density (PFD) for the measured
traits (see Table 2)
Parameters DMa DM/FMa Root CSA TDMr Proportion stele Prop, cell wall stele Stele cell number Stele cell CSA Number vessels Xylem vessel CSA Total xylem CSA
100%-30% PFD Pairwise mean differences
016 -0056 -0041 -0011 0032 -0022 0-656 0088 0117 0-175 0-305 P * *** — — *** — * ** *** Contrasts 30 %-5-5 % PFD Pairwise mean differences
-1-57 - 0 0 6 5 -0-228 - 0 0 4 2 - 0 0 4 3 - 0 0 0 9 - 2 0 6 2 0015 - 0 1 3 6 0137 -0-041 P *** *** — *** *** — *** — — — —
Pairwise mean difference in least square means and the level of significance are given. *** P < 0001; ** P < 001; *P < 005.
0.20 O 0.10 -§ 0.05 0.00 0.08 | 0.06 "8 0.04 £ 0.02 0.00 A r*i | D
I
.1
d stela r cell s No . E 0.12 0.09 0.06 0.03 0.00 400 300 200 100 000 800 600 B1
0.20 0.15 -EI
400 200 -HI
tio n Propo r o "aJu <D 'a) m em CS A 1 0.10 0.05 0.00 8.0 6.0 4.0 2.0 0 2000 1500 1000 500c
my, Fi
X -i 1 1 11
JLLow Nutr. High nutr. Low Nutr. High nutr. Low N u t r . High n u t r . F I G . 2. Reaction of axile root anatomical traits to two levels of nutrient supply and three levels of photon flux density (PFD). Mean values + 1 s.e. without size correction. A, Root cross-sectional area; B, root tissue mass density; C, proportion stele in root CSA; D, proportion of cell wall in stele CSA; E, number of stelar cells; F, stelarcell size (CSA); G, number of xylem vessels; H, mean xylem vessel CSA; and I, total xylem
CSA. 5-5% PFD ( • ) . 3 0 % PFD ( 0 ) , 100% PFD (•)•
nutrient supply influenced root CSA, it also had a strong influence on root anatomy in intermediate shade and in full daylight, but not at 5-5 % PFD (Fig. 2). Axile roots grown under high nutrient supply had more (P < 001) and larger
(P < 001) stelar cells, and also more xylem vessels (P < 0001) with a larger CSA (P < 0001). Total xylem
CSA was larger under high than under low nutrient supply
(P < 001). However, when root cross-sectional area was
included as a covariant in the analysis, nutrient effects on size and number of stelar cells and xylem vessels disappeared. Only the total xylem CSA remained signifi-cantly influenced by nutrient supply (Table 2); the P-value for the nutrient effect on mean xylem vessel size failed marginally to be significant (P = 0051).
Irradiance had a significant effect on all root anatomical parameters except on the proportion of cell walls in stele
1076
0.31
0.03
0.001 0.01 0.1 Above-ground dry mass (g)
1.0
F I G . 3. Cross-sectional area of axile roots of the eight species studied in the six treatment combinations plotted against above-ground dry mass. Squares: high nutrient treatment. Circles: low nutrient treatment. Filled symbols: 5-5% daylight. Hatched symbols: 30% daylight. Open symbols: 100% daylight. The line marks a significant regression
(R2 = 0-58, P < 0001).
CSA (P = 0-078), even when variation in root CSA was taken into account. The trends in response to increased shading were different for the progression from full daylight (100 % PFD) to 30 % PFD, compared with that from 30 % PFD to 5-5 % PFD (Fig. 2, Table 3). Thus, plants grown at 30 % PFD had a significantly higher proportion of stele than those grown under full daylight. This effect was due to the larger size of the xylem vessels and the parenchyma cells in the stele rather than to any difference in the numbers of xylem vessels and stelar cells. Total xylem CSA was significantly greater at 30 % PFD. The proportion of cell wall in the stele and the tissue mass density of axile roots (TMDr) were slightly lower in intermediate shade, but these
differences were not significant. In contrast, plants grown at 5-5 % PFD had a significantly smaller proportion of stele compared to those grown at 30 % PFD. This effect was due to a smaller number of stelar cells, the size of the cells being unchanged. Root tissue mass density was significantly lower at 5-5 % PFD than at 30 % PFD. Plants grown at 5-5 % PFD were smaller than those grown at higher light levels, and had thinner roots (P < 0001) with smaller stelar cells
(P < 001), fewer xylem vessels (P < 0001), and a smaller
area of total xylem (P < 0001, Fig 2). However, none of these differences were significant if above-ground biomass or root CSA was included as a covariate in the ANOVA (Table 3).
There was a significant nutrient x light interaction for xylem vessel CSA (Table 2). This was a result of the pronounced effect of nutrient supply on xylem vessel CSA at 30 % PFD, an effect that was not found either in full daylight or at 5-5 % PFD (Fig. 2).
Variation in root tissue mass density caused by the treat-ments was strongly associated with the variation in above-ground tissue density (General Linear Model with average TMDr of each species in each treatment as dependent
variables, species as categorical variables, and DM/FMa as
a continuous independent variable; P < 0001).
Interspecific variation in plastic response
There were no significant species x nutrient interactions for any of the morphological or anatomical traits investi-gated (Table 2), although there was a weak interaction for above-ground dry mass. In contrast, several of the traits showed a significant species x light interaction, indicating interspecific differences in light response. These traits included above-ground biomass, above-ground dry to fresh mass ratio, root CSA, proportion of stele in root CSA, stele cell size, stele cell number, and total xylem CSA (Table 2). In spite of this interspecific variation in light response, the rank order of species with respect to their parameter values across all six treatment combinations was remarkably stable. The Kendall Coefficient of Concordance (Zar, 1999) for above-ground biomass, DM/FMa and all
root parameters (corrected for the effects of above-ground biomass or root CSA, respectively) except TMDr was over
0-57, indicating a highly significant concordance of species' values across all treatments (six treatment combinations and eight species; P < 0001).
D I S C U S S I O N
Both nutrient supply and irradiance had an effect on root anatomical characteristics. The results for nutrient supply could be completely explained as allometric effects related to differences in plant size and root thickness in different treatments. However, the influence of irradiance on root anatomy was not solely a size effect. The observed influence of above-ground resources on below-ground anatomy clearly demonstrates the importance of regarding a plant as a whole when considering its response to environmental conditions. It is evident that the organs directly associated with the acquisition of the limiting resource are not the only ones that are affected by changes in the supply of that resource.
The lack of a nutrient effect on root characteristics (other than an effect due to size) could be because our measure-ments were limited to axile roots. Other work using the grasses Dactylis glomerata and Brachypodium pinnatum has shown that when the whole root system is considered, root tissue mass density tends to be higher in plants grown with a low supply of nitrogen and phosphorus compared with those grown with high levels of these nutrients (Ryser and Lambers, 1995). Nutrient supply is also known to influence root topology in dicots, and thus root diameter distribution (Fitter and Stickland, 1991).
Shade had two major effects on the anatomy of grass roots: firstly, it led to modifications of the water conducting system; and secondly, tissue with lower construction costs per volume was produced. The first effect was evident at 30 % PFD, although growth was not
Wahl et al.—Phenotypic Plasticity of Grass Roots 1077 reduced compared to 100% PFD. The second effect was
pronounced at 5-5 % PFD, and was associated with reduced biomass production. The qualitatively different responses of plants growing under 30 % PFD and 5-5 % PFD demonstrate the importance of considering actual levels of resource availability, and whether or not they are growth limiting, when drawing conclusions about pheno-typic plasticity.
The decrease in TMDr was especially pronounced when
irradiance became growth limiting, probably due to carbon limitation. The significance of this response may be that it allows plants to maintain root length and nutrient acquisi-tion capacity, though at the expense of tissue robustness. A similar conclusion was reached for two Daciylis species which were able to maintain their total root length when shaded (30 % daylight) although the relative biomass allocation to roots was strongly reduced (Ryser and Eek, 2000).
A decrease in the investment in dry mass per root volume in the deepest shade was mainly a result of a smaller proportion of stele per root cross-sectional area, attained by a reduced number of stelar cells. However, the functional characteristics of stele were hardly influenced; although xylem is part of the stele, a reduction in the proportion of stele had no influence on xylem characteristics, suggesting that plants maintain the transport capacity of their roots even if investment of dry matter in dense stelar tissue is reduced. The percentage of cell wall in the stele cross-sectional area also remained unchanged.
An increase in irradiance compared to intermediate shade also led to a decrease in the proportion of stele, although in contrast to the response in deeper shade this was mainly a result of smaller stelar cells. Furthermore, full daylight led to significant changes in functional character-istics of the root: xylem vessels and the total xylem cross-sectional area were smaller in full daylight than under intermediate shade.
There are two possible explanations for these responses to light. Firstly, it is well known that under low light conditions plants often increase their leaf area ratio strongly while reducing their biomass allocation to roots (Corre, 1983; Rice and Bazzaz, 1989). For example, Ryser and Eek (2000) found that leaf area ratio (LAR) of Daciylis glomerate/ almost doubled under 30 % PFD compared to full daylight, whereas the root mass ratio (RMR) was reduced by about 25 %. A higher relative transport capacity is required as the transpiring surface increases but the amount of roots decreases. According to the Hagen-Poiseuille law, conduct-ance of a pipe increases with the fourth power of its diameter. The most cost-efficient way to increase the transport capacity of a root system is thus to increase the vessel diameter rather than producing more vessels in one root or by producing more roots (McCully and Canny, 1988). An increased xylem vessel size and total xylem cross-sectional area in shade also correspond well to the known relative constancy of the ratio between conducting cross-sectional area and leaf area (Huber value; Losch, 2001).
Secondly, the difference in root anatomy between 30 % and 100 % daylight may also be regarded from the point of view of a potentially higher stress in full daylight.
Compared to plants growing in shade, those exposed to full daylight are often more prone to drought due to stronger winds, higher temperatures, and lower air humid-ities. In our experiment none of the plants were water-limited, but their response may still be adaptive to an increased risk of drought stress. Smaller cells in the stele and smaller xylem vessels indicate a higher resistance to low water potentials. It is known, for example, that local drought leads to smaller xylem vessels in sorghum (Cruz et
al., 1992). In above-ground parts of poplars and various
species of Pinaceae, negative correlations have been demonstrated between hydraulic conductivity and both xylem vessel diameter and resistance to cavitation (Harvey and van den Driessche, 1999; Pinol and Sala, 2000). Furthermore, smaller root xylem vessels are non-functional for a shorter period after an embolism as they refill more quickly (McCully et al., 1998). Small vessel size is associated with species found in habitats with a high probability of drought stress. For example, grasses of open and dry limestone grasslands, such as Bromus erectus,
Festuca ovina, Briza media and Poa angustifolia, have
smaller xylem vessels than species of more mesic open habitats, such as Lolium perenne, Dactylis glomerata or
Holcus lanatus, or species of mesic habitats in shade or
semi-shade, such as Deschampsia caespitosa, Helictotrichon
pubescens or Milium effusum (Wahl and Ryser, 2000).
We hypothesize that the response of total xylem CSA to nutrient supply reflects the interplay between requirements for hydraulic conductance and for protection against drought. A greater xylem CSA under high nutrient supply, even when the effect of root CSA is taken into account, can be understood in terms of a need for an increased transport capacity. At high nutrient supply, plants have a relatively larger leaf area than at low nutrient supply, and invest a smaller proportion of biomass below ground. At 30% PFD, the increase in total xylem area due to a higher nutrient supply was associated with a greater xylem vessel CSA. In full daylight the response may have been more 'cautious' with respect to a potential drought: mean xylem vessel size actually decreased, whereas the number of xylem vessels increased slightly.
Interspecific variation in plasticity has often been considered to reflect the ecological behaviour of the species (Crick and Grime, 1987; Grime et al., 1991; Sultan, 2000). However, our data are not consistent with this conclusion. All eight grass species reacted in a similar way to variation in nutrient levels, and differences in light response were not easy to interpret. The rank order of species with respect to most of the characteristics studied remained similar under all treatment combinations. We conclude that even if plastic responses of root characteristics are an important aspect of the plant's performance when resources are limiting, interspecific variation in ecological behaviour may be better explained by the average characteristics than by the amount of plasticity in these characteristics.
A C K N O W L E D G E M E N T S
We thank Anton Igersheim and Peter Endress from the University of Zurich for advice in anatomical work and for
facilities, Felix Wackers for the use of equipment and Cathy Bayliss for comments on the manuscript. Stefan Wahl received financial support from the Swiss National Science Foundation (Grant 31-43392-95).
L I T E R A T U R E CITED
Bjorkman O. 1981. Response to different quantum flux densities. In: Lange OL, Nobel PS, Osmond CB, Ziegler H, eds. Encyclopedia
of Plant Physiology. Berlin: Springer Verlag, 57-107.
Bloom AJ, Chapin FS, Mooney HA. 1985. Resource limitation in plants—an economic analogy. Annual Review of Ecology and
Systematics 16: 363-392.
Coleman J S , McConnaughay KDM, Ackerly DD. 1994. Interpreting phenotypic variation in plants. Trends in Ecology and Evolution 9: 187-191.
Corre W J . 1983. Growth and morphogenesis of sun and shade plants. III. The combined effects of light intensity and nutrient supply.
Ada Botanica Neerlandica 32: 277—294.
Crick J C , Grime J P . 1987. Morphological plasticity and mineral nutrient capture in two herbaceous species of contrasting ecology.
New Phytologist 107: 403-414.
Cruz RT, Jordan WR, Drew M C . 1992. Structural changes and associated reduction of hydraulic conductance in roots of
Sorghum bicolor L. following exposure to water deficit. Plant Physiology 99: 203-212.
Dijkstra PD, Lambers H. 1989. Analysis of specific leaf area and photosynthesis of two inbred lines of Planlago major differing in relative growth rate. New Phytologist 113: 283-290.
Fitter A, Stickland A. 1991. Architectural analysis of plant root systems. II. Influence of nutrient supply on architecture in contrasting plant species. New Phytologist 118: 383-389. Carnier E, Laurent G. 1994. Leaf anatomy, specific mass and water
content in congeneric annual and perennial grass species. New
Phytologist 128: 725-736.
Gedroc J J , McConnaughay KDM, Coleman JS. 1996. Plasticity in root/ shoot partitioning: Optimal, ontogenetic, or both? Functional
Ecology 10: 44-50.
Gerlach D. 1984. Botanische Mikrotechnik, 5th edn. Stuttgart: Georg Thieme Verlag.
Grime J P , Campbell BD, Mackey J M L , Crick J C . 1991. Root plasticity, nitrogen capture and competitive ability. In: Atkinson D, ed. Plant root growth. An ecological perspective. Oxford: Blackwell Scientific Publications, 381-397. Special publication of the British Ecological Society 10.
Harvey H P , van den Driessche R. 1999. Nitrogen and potassium effects on xylem cavitation and water-use efficiency in poplars. Tree
Physiology 19: 943-950.
He J B , Bogemann GM, van de Steeg H M , Rijnders J G H M , Voeseneck LACJ, Blom CWPM. 1999. Survival tactics of Ranunculus species in river floodplains. Oecologia 118: 1—8.
lgersheim A, Cichocki O. 1996. A simple method for microtome sectioning of prehistoric charcoal specimens, embedded in 2-hydroxyethyl methacrylate (HEMA). Review of Palaeobotanv and
Palynology 92: 389-393.
Lambers H, Poorter H. 1992. Inherent variation in growth rate between higher plants: a search for physiological causes and ecological consequences. Advances in Ecological Research 23: 187-261. Losch R. 2001. Wasserhaushall der Pflanzen. Wiebelsheim, Germany:
Quelle und Meyer Verlag.
McCully ME, Canny M J . 1988. Pathways and processes of water and nutrient movement in roots. Plant and Soil 111: 159-170. McCully ME, Huang CX, Ling LEC. 1998. Daily embolism and
refilling of xylem vessels in the roots of field-grown maize. New
Phytologist 138: 327-342.
O'Brien TP, Feder N, McCully ME. 1964. Polychromatic staining of plant cell walls by Toluidine Blue O. Proloplasma 59: 367-373. Pinol J, Sala A. 2000. Ecological implications of xylem cavitation for
several Pinaceae in the Pacific Northern USA. Functional Ecology 14: 538-545.
Rice SA, Bazzaz FA. 1989. Growth consequences of plasticity of plant traits in response to light conditions. Oecologia 78: 508-512. Ryser P. 1998. Intra- and interspecific variation in root length, root
turnover and the underlying parameters. In: Lambers H, Poorter H, van Vuuren MMI, eds. Inherent variation in plant growth.
Physiological mechanisms and ecological consequences. Leiden:
Backhuys Publishers, 441-465.
Ryser P, Eek L. 2000. Consequences of phenotypic plasticity vs. interspecific differences in leaf and root traits for acquisition of aboveground and belowground resources. American Journal of
Botany ST. 402-411.
Ryser P, Lambers H. 1995. Root and leaf attributes accounting for the performance of fast- and slow-growing grasses at different nutrient supply. Plant and Soil 170: 251-265.
Sokal RR, Rohlf FJ. 1995. Biometry. New York: W.H. Freeman and Co.
Strauss-Debenedetti S, Bazzaz FA. 1991. Plasticity and acclimation to light in tropical Moraceae of different successional positions.
Oecologia 87: 377-387.
Sultan SE. 2000. Phenotypic plasticity for plant development, function and life history. Trends in Plant Science 5: 537-542.
Thompson VVA, Kriedemann PE, Craig IE. 1992. Photosynthetic response to light and nutrients in sun-tolerant and shade-tolerant rainforest trees: I. Growth, leaf anatomy and nutrient content.
Australian Journal of Plant Physiology 19: 1-18.
van Arendonk J J C M , Poorter H. 1994. The chemical composition and anatomical structure of leaves of grass species differing in relative growth rate. Plant, Cell and Environment 17: 963-970.
van Arendonk J J C M , Niemann GJ, Boon J J , Lambers H. 1997. Effects of nitrogen supply on the anatomy and chemical composition of leaves of four grass species belonging to the genus Poa, as determined by image-processing analysis and pyrolysis-mass spectrometry. Plant Cell and Environment 20: 881-897.
Wahl S, Ryser P. 2000. Root tissue structure is linked to ecological strategies of grasses. New Phytologist 148: 459-471.
Watt M, van der Weele CM, McCully ME, Canny M J . 1996. Effects of local variations in soil moisture on hydrophobic deposits and dye diffusion in corn roots. Botanica Ada 109: 492-501.
Witkovtski ETF, Lamont BB. 1991. Leaf specific mass confounds leaf density and thickness. Oecologia 88: 486-493.
Zar JF. 1999. Biostatistical analysis, 4th edn. Upper Saddle River, New Jersey, USA: Prentice Hall.