Review Article
Dietary intakes of women during pregnancy in low- and
middle-income countries
Sun Eun Lee
1, Sameera A Talegawkar
1, Mario Merialdi
2and Laura E Caulfield
1,*
1Center for Human Nutrition, Department of International Health, The Johns Hopkins Bloomberg School of Public
Health, 615 North Wolfe Street, Baltimore, MD 21205, USA:2Department of Reproductive Health and Research, World Health Organization, Geneva, Switzerland
Submitted 30 January 2012: Final revision received 3 July 2012: Accepted 24 August 2012: First published online 9 October 2012 Abstract
Objective: To provide a better understanding of dietary intakes of pregnant women in low- and middle-income countries.
Design: Systematic review was performed to identify relevant studies which reported nutrient intakes or food consumption of pregnant women in developing countries. Macronutrient and micronutrient intakes were compared by region and the FAO/WHO Estimated Average Requirements. Food consumption was summarized by region.
Setting: Developing countries in Africa, Asia, and the Caribbean and Central/ South America.
Subjects: Pregnant women in the second or third trimester of their pregnancies. Results: From a total of 1499 retrieved articles, sixty-two relevant studies were analysed. The ranges of mean/median intakes of energy, fat, protein and carbohy-drate were relatively higher in women residing in the Caribbean and Central/South America than in Africa and Asia. Percentages of energy from carbohydrate and fat varied inversely across studies in all regions, whereas percentage of energy from protein was relatively stable. Among selected micronutrients, folate and Fe intakes were most frequently below the Estimated Average Requirements, followed by Ca and Zn. Usual dietary patterns were heavily cereal based across regions.
Conclusions: Imbalanced macronutrients, inadequate micronutrient intakes and predominantly plant-based diets were common features of the diet of pregnant women in developing countries. Cohesive public health efforts involving improving access to nutrient-rich local foods, micronutrient supplementation and fortification are needed to improve the nutrition of pregnant women in developing countries.
Keywords Pregnant women Nutrient intakes Food consumption Developing countries
Adequate nutrition during pregnancy is essential for maternal and child health. Pregnant women are vulnerable to inadequate nutritional status because of the high nutrient demands of pregnancy. Women living in developing countries are particularly at risk for malnutrition during pregnancy due to socio-economic constraints, poor diet quality, high intensity of agricultural labour, and frequent reproductive cycles. There is much evidence supporting the link between inadequate maternal nutritional status and adverse pregnancy outcomes(1–3), poor infant survi-val(4,5), and risk of chronic diseases and impaired mental development in later life(6–8).
Poor dietary intake during pregnancy is a significant contributor to global maternal malnutrition in less devel-oped countries(5). A previous review indicated that preg-nant women in developing countries suffer from energy
deficiencies due to relatively insufficient energy intake(9). In addition, 42 % of pregnant women worldwide(5) and more than 50 % of pregnant women in developing countries are anaemic, mainly due to Fe deficiency(10). Dietary defi-ciencies in other important vitamins and minerals, including vitamin A, folate, Ca and Zn, are also estimated to be high(5,11–16). The FAO/WHO have established diet-based guidelines for nutrient requirements and recommendations during pregnancy, as well as dietary guidelines for dietary assessment and utilization of dietary information(17–20). Yet there is limited information available on the food and nutrient intakes of pregnant women in low-resource settings across countries and regions(21).
Here we have synthesized information on dietary intakes of pregnant women using data from published studies conducted in low- and middle-income countries.
Intakes of macro- and micronutrients, as well as data on food consumption, are summarized and presented by region. It is anticipated that a better understanding of usual dietary intakes of women during pregnancy will provide insights for the development of sustainable intervention programmes to improve maternal nutrition in resource-poor settings.
Methods
Literature review and study selection
A literature review was undertaken to identify studies that reported the usual dietary intake of pregnant women in low- and middle-income countries. MEDLINE, EMBASE and SCOPUS databases were searched. Studies which were indexed only in the regional electronic bibliographic databases were searched through African Index Medicus, LILACS for Central and South America, and Index Medicus for the South-East Asia Region. Different combinations of search terms – ‘nutrient intake’, ‘food intake/consumption’, ‘dietary intake’, ‘food/dietary pattern’, ‘diet quality’, ‘(micro) nutrient (in)adequacy’, ‘dietary diversity’, ‘dietary composition’, and ‘(micro)nutrient deficiency’, ‘energy’, ‘protein/fat/carbohydrate’, ‘vitamins’, and ‘trace elements’, etc. – were used with ‘pregnancy’ and ‘developing coun-tries’ terms. Low- and middle-income countries in Africa, Asia, the Caribbean and Central/South America were included, based on the country classification by the World Bank(22). The publication dates were restricted to 1 January 1989 to 9 June 2011 to include recent articles which have been published after a previous report about maternal diet in developing countries(9). Language was not restricted if studies had abstracts in English.
The first filtering was primarily to identify potentially relevant studies by screening the titles and abstracts of initially retrieved studies. Studies were included if they reported energy, nutrient or food intakes or dietary patterns of pregnant women. Studies which had any type of dietary supplement intervention during pregnancy were excluded to capture nutrient intakes from usual food sources, unless the baseline dietary information of randomly sampled subjects was available. Inclusion criteria for subjects were healthy pregnant women free from pregnancy-related complications and clinical patients with infections such as HIV and malaria. Maternal age was not restricted, and most studies had a wide range of age of subjects. However, studies that solely recruited adolescents as defined by the study investigators were excluded.
The second filtering was performed by excluding studies which met exclusion criteria after reading through all previously selected studies. Studies which reflected the dietary intake mainly in the first trimester of pregnancy were excluded to avoid the fluctuating nature of dietary intake in early pregnancy due to nausea and vomiting(23). Studies which had total or sub-sample size ,20 were also
excluded. Only one representative article was included if several articles were published with the same study population by the same research team. We did not reject any study based on concerns about the validity of the dietary assessment method.
Data analysis
The characteristics of selected studies were summarized by reviewing study design, living area, gestational age at recruitment, recruitment method and dietary assessment. Maternal age, gestational age, weight, height and BMI, and the proportion of primipara at recruitment, were summarized by region for the studies with available information. Esti-mated mean/median energy/nutrient intakes, dietary patterns or food consumption were extracted from published papers; no attempt was made to contact study investigators to obtain primary data. Only frequently reported vitamins and minerals were evaluated. If studies separated the nutrient intakes by categories such as socio-economic status (low/ high), living area (urban/rural), trimester (second/third) and occupation (farmers/non-farmers), the weighted mean method was used to best estimate the average nutrient intakes of the study population.
Macro- and micronutrient intakes were visualized with dot plots, with each dot representing the estimated mean/ median nutrient intake of each study. For descriptive pur-poses, mean, standard deviation, median and the 25th and 75th percentiles were used to estimate central tendency and variability of nutrient intakes across studies, even though 85 % of studies originally reported mean nutrient intakes with the rest reporting median intakes. Micronutrient intakes of each study were compared with the Estimated Aver-age Requirements (EAR), which were back-calculated based on FAO/WHO Recommended Nutrient Intakes for pregnant women in the second trimester(19,24). Because only the lower bound of the EAR of Fe was available (.40?0 mg/d)(24), it was used as the EAR for Fe. Low bioavailability of Zn was used for the EAR of Zn, because of the low intakes of animal foods and high intakes of unrefined cereals/grains in developing countries. The unit of vitamin A was unified to mg RE (retinol equivalents) by considering that 1 RE equals 1 mg retinol, 12 mg of b-carotene and 3?33 International Units. For the intake of folate, studies which reported folic acid intakes were identified separately in Fig. 6d.
Insufficient information was available to assess the ade-quacy of the reported energy intakes. However, the average reported weights of women in sixteen studies were used to calculate the energy intake as a function of the calculated BMR based on the Oxford equation for females aged 18–30 years following the method of Goldberg(25,26). For fifteen studies, the ratio of energy intake to BMR was ,1?2–1?9. The ratio calculated for the study in Ethiopia was very low (0?8), but the energy and nutrient intakes of the study were included in the review because we speculate that food is less readily available during the rainy season when the diet data were collected(27).
The contributions of macronutrient intakes to total energy were plotted by region and compared with the goals of population nutrient intake defined by the joint WHO/FAO expert consultation(28). For studies that pro-vided information on macronutrient intakes only, the percentages from energy source were calculated using 16?7 kJ for 1 g of protein and carbohydrate, and 37?7 kJ for 1 g of fat(29).
Food consumption information in most of the studies was descriptive in nature and varied with respect to the measures described; therefore, this information was also summarized in a descriptive manner in the text by region. In the present review, the term ‘LAC’ is used to refer to Mexico, the Caribbean and Central/South America. All data analyses were performed using the statistical software package STATA/IC version 11?2.
Results
Selection of studies
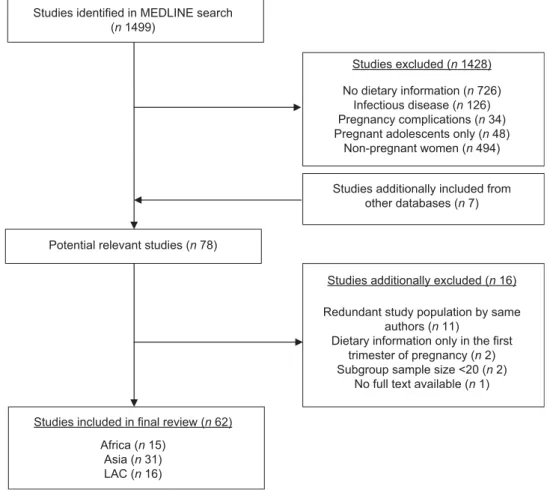
In total, 1499 articles were initially retrieved from the MEDLINE database and 1428 articles were filtered out for various reasons (Fig. 1). Seventy-eight studies including seven additionally added articles from LILACS, SCOPUS and EMBASE databases were retained for a detailed
evaluation. Sixteen articles were additionally excluded from the selection: eleven studies were conducted by same authors with redundant study populations, two articles had sub-sample sizes ,20, two articles had diet-ary information only for the first trimester and the full text was not available for one article. In total, sixty-two studies conducted in low- and middle-income countries in Africa, Asia and LAC were included in the review. Several countries had more than one eligible study: these included twelve studies from India, five studies each from China and Brazil, four studies each from Iran, Egypt and Mexico, three studies from Thailand, and two studies each from Malawi, Bangladesh, Pakistan and South Africa.
Characteristics of selected studies
Of the selected studies, the majority (80 %) were cross-sectional or prospective observational studies (18 %). Women in most of the studies based in Africa and Asia lived in rural/suburban areas and rural areas, respectively, whereas women in all studies from LAC resided in urban or semi-urban areas. Approximately 75 % of studies recruited participants through facilities including hospitals and health centres, but community- and census-based recruitments were also common in studies from Asia. Women in ,80 % of all studies were in their second or
Studies identified in MEDLINE search (n 1499)
Potential relevant studies (n 78)
Studies excluded (n 1428) No dietary information (n 726)
Infectious disease (n 126) Pregnancy complications (n 34) Pregnant adolescents only (n 48)
Non-pregnant women (n 494)
Studies included in final review (n 62) Africa (n 15)
Asia (n 31) LAC (n 16)
Studies additionally included from other databases (n 7)
Studies additionally excluded (n 16) Redundant study population by same
authors (n 11)
Dietary information only in the first trimester of pregnancy (n 2) Subgroup sample size <20 (n 2)
No full text available (n 1)
third trimester; women in the rest of the studies were interviewed in any trimester, but the proportions of women in the first trimester were not high. In terms of dietary collection methodology, ,45 % of studies used a 24 h dietary recall, 28 % of studies used an FFQ, 10 % of studies used both, 10 % of studies used a food diary/diet record/dietary history, and the rest or 7 % of studies used a weighed food record.
Demographic and anthropometric characteristics of study populations
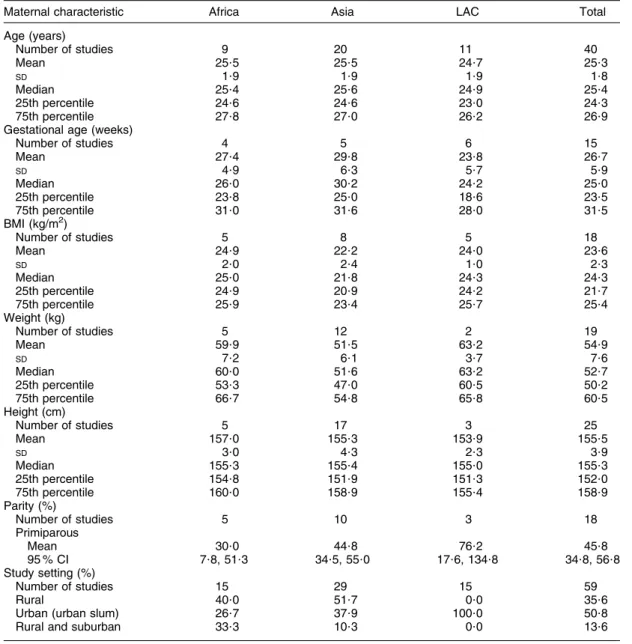
The studies varied in the detail provided about the characteristics of the women studied. Therefore, to describe the studies, we calculated selected maternal characteristics based on the data provided (Table 1). The mean (SD) maternal age was 25?3 (1?8) years and it
was comparable across regions. The mean (SD) gestational age, height and BMI at recruitment were 26?7 (5?9) weeks, 155?5 (3?9) cm and 23?6 (2?3) kg/m2. Gestational age was slightly lower in LAC than Asia and Africa, and BMI was lower in Asia than Africa and LAC. The mean prevalence (95 % CI) of primiparity was 45?8 (95 % CI 34?8, 56?8) %, and it varied by region.
Energy/macronutrient intakes
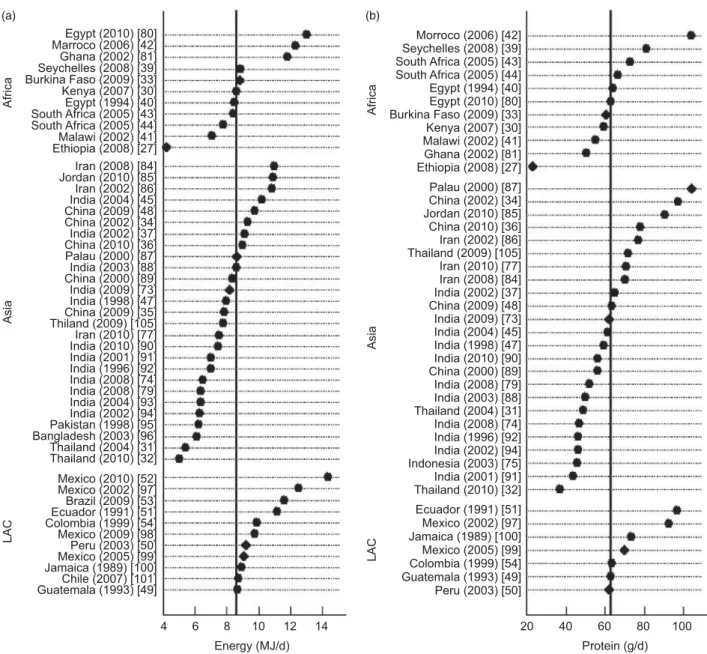
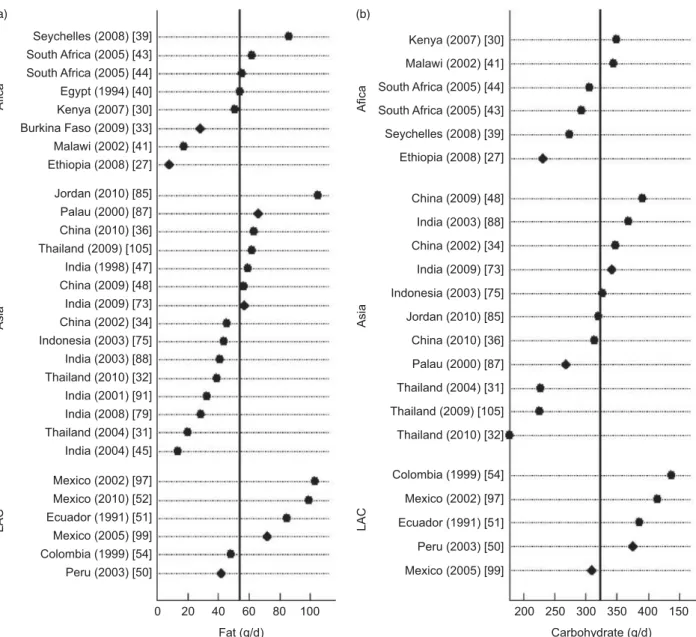
The median (25th, 75th percentiles) energy intake was 8?6 (7?5, 9?8) MJ/d or 2055 (1779, 2342) kcal/d; and the median (25th, 75th percentiles) macronutrient intakes were 63?0 (52?3, 73?2) g/d for protein, 54?0 (38?9, 63?0) g/d for fat and 323 (274, 369) g/d for carbohydrate. Energy and macronutrient intakes of women in LAC were generally higher than those of women in Africa and Asia (Figs 2 and 3).
Table 1 Characteristics of the pregnant women studied by region
Maternal characteristic Africa Asia LAC Total
Age (years) Number of studies 9 20 11 40 Mean 25?5 25?5 24?7 25?3 SD 1?9 1?9 1?9 1?8 Median 25?4 25?6 24?9 25?4 25th percentile 24?6 24?6 23?0 24?3 75th percentile 27?8 27?0 26?2 26?9
Gestational age (weeks)
Number of studies 4 5 6 15 Mean 27?4 29?8 23?8 26?7 SD 4?9 6?3 5?7 5?9 Median 26?0 30?2 24?2 25?0 25th percentile 23?8 25?0 18?6 23?5 75th percentile 31?0 31?6 28?0 31?5 BMI (kg/m2) Number of studies 5 8 5 18 Mean 24?9 22?2 24?0 23?6 SD 2?0 2?4 1?0 2?3 Median 25?0 21?8 24?3 24?3 25th percentile 24?9 20?9 24?2 21?7 75th percentile 25?9 23?4 25?7 25?4 Weight (kg) Number of studies 5 12 2 19 Mean 59?9 51?5 63?2 54?9 SD 7?2 6?1 3?7 7?6 Median 60?0 51?6 63?2 52?7 25th percentile 53?3 47?0 60?5 50?2 75th percentile 66?7 54?8 65?8 60?5 Height (cm) Number of studies 5 17 3 25 Mean 157?0 155?3 153?9 155?5 SD 3?0 4?3 2?3 3?9 Median 155?3 155?4 155?0 155?3 25th percentile 154?8 151?9 151?3 152?0 75th percentile 160?0 158?9 155?4 158?9 Parity (%) Number of studies 5 10 3 18 Primiparous Mean 30?0 44?8 76?2 45?8 95 % CI 7?8, 51?3 34?5, 55?0 17?6, 134?8 34?8, 56?8 Study setting (%) Number of studies 15 29 15 59 Rural 40?0 51?7 0?0 35?6
Urban (urban slum) 26?7 37?9 100?0 50?8
Rural and suburban 33?3 10?3 0?0 13?6
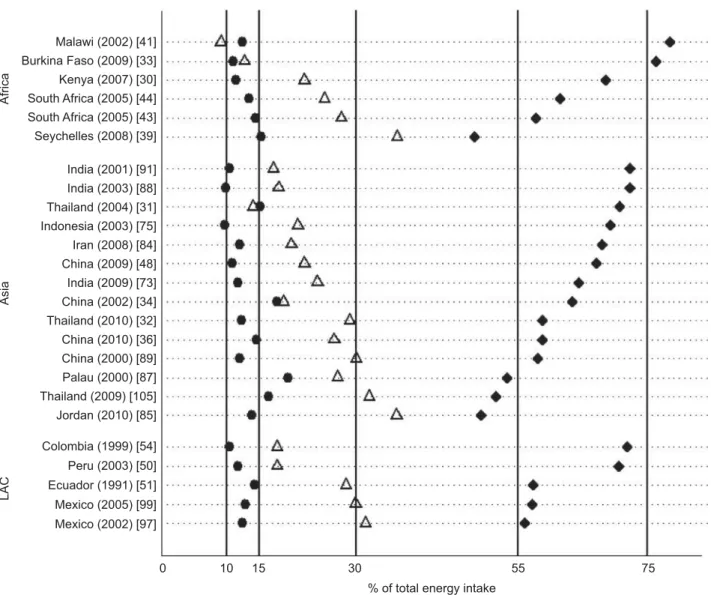
For the contributions of macronutrients to total energy intakes, there was a strong negative relationship between the percentages of energy from fat and carbohydrate across regions (Fig. 4). Compared with the WHO/FAO population goals for nutrient intake(28), only fourteen studies out of twenty-five studies were within the recommended ranges. Studies from Asia and Africa were relatively more likely to be out of the recommended ranges (as a percentage of energy), which are 10–15 % for protein, 15–30 % for fat and 55–75 % for carbohydrate. In eight out of twenty-five studies, fat intakes as a percen-tage of energy did not reach 20 %, which is the lower limit of that recommended by the FAO/WHO for women of childbearing age(17).
Micronutrient intakes
Estimated mean/median micronutrient intakes were plotted by country/region and compared with the EAR (Figs 5 to 7). Vitamin A intakes of all studies conducted in LAC were above the EAR (Fig. 5a), whereas approxi-mately half of the studies in Asia and more than half of the studies in Africa reported intakes below the EAR. High consumption of vitamin A was reported in the studies from Kenya and Thailand where provitamin A-rich green vegetables and fruit are commonly consumed(30–32). In most studies, vitamin C intakes were considerably above the EAR (Fig. 5b), except for Burkina Faso and Ethiopia where dietary assessments were conducted in the dry and rainy seasons, respectively(27,33). Among selected B vitamins,
Morroco (2006) [42] Seychelles (2008) [39] South Africa (2005) [43] South Africa (2005) [44] Egypt (1994) [40] Egypt (2010) [80] Burkina Faso (2009) [33] Kenya (2007) [30] Malawi (2002) [41] Ghana (2002) [81] Ethiopia (2008) [27] Ecuador (1991) [51] Mexico (2002) [97] Jamaica (1989) [100] Mexico (2005) [99] Colombia (1999) [54] Guatemala (1993) [49] Peru (2003) [50] Protein (g/d) 20 40 60 80 100 Palau (2000) [87] China (2002) [34] Jordan (2010) [85] China (2010) [36] Iran (2002) [86] Thailand (2009) [105] Iran (2010) [77] Iran (2008) [84] India (2002) [37] China (2009) [48] India (2009) [73] India (2004) [45] India (1998) [47] India (2010) [90] India (2003) [88] Thailand (2004) [31] India (2008) [74] India (1996) [92] India (2002) [94] Indonesia (2003) [75] India (2001) [91] Thailand (2010) [32] China (2000) [89] India (2008) [79] Africa Asia LAC Africa Asia LAC Egypt (2010) [80] Marroco (2006) [42] Ghana (2002) [81] Seychelles (2008) [39] Burkina Faso (2009) [33] Kenya (2007) [30] Egypt (1994) [40] South Africa (2005) [43] South Africa (2005) [44] Malawi (2002) [41] Ethiopia (2008) [27] Mexico (2010) [52] Mexico (2002) [97] Brazil (2009) [53] Ecuador (1991) [51] Colombia (1999) [54] Mexico (2009) [98] Peru (2003) [50] Mexico (2005) [99] Jamaica (1989) [100] Chile (2007) [101] Guatemala (1993) [49] Energy (MJ/d) 4 6 8 10 12 14 Iran (2008) [84] Jordan (2010) [85] Iran (2002) [86] India (2004) [45] China (2009) [48] China (2002) [34] India (2002) [37] China (2010) [36] Palau (2000) [87] India (2003) [88] India (1998) [47] China (2009) [35] Thiland (2009) [105] Iran (2010) [77] India (2010) [90] India (2001) [91] India (1996) [92] India (2008) [74] India (2008) [79] India (2004) [93] India (2002) [94] Pakistan (1998) [95] Bangladesh (2003) [96] Thailand (2004) [31] Thailand (2010) [32] China (2000) [89] India (2009) [73] (a) (b)
Fig. 2 (a) Energy and (b) protein intakes of pregnant women by region: vertical reference lines are the medians of energy and protein intakes across studies; >, mean values; E, median values; LAC refers to Mexico, the Caribbean and Central/South America; numbers in square brackets represent reference numbers
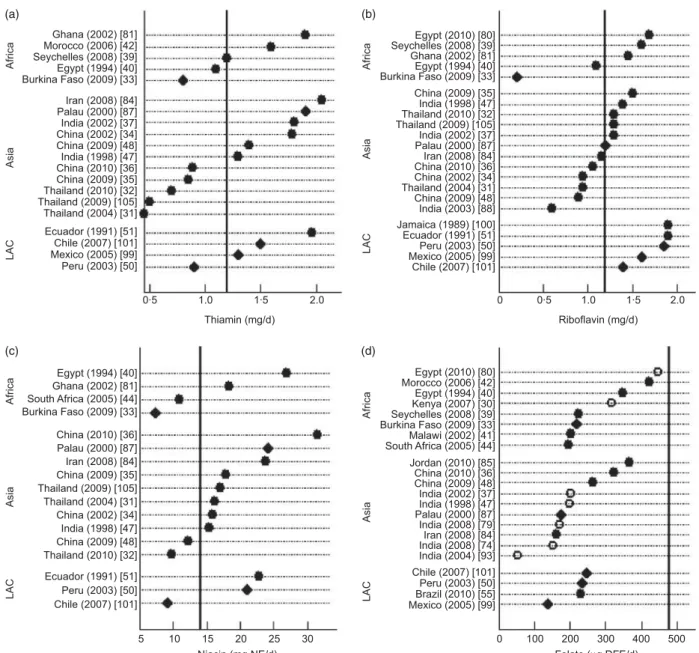
folate intakes were most frequently below the EAR (Fig. 6a to d). The range of folate intake was somewhat higher in Africa than in Asia and LAC; however, none of the reported intakes met the EAR. Riboflavin intakes were relatively higher in LAC than the other regions with no studies reporting intakes below the EAR. With respect to mineral intakes, the Fe intakes reported in all studies were substantially below the EAR (Fig. 7a). In most studies, Zn intakes were also below the recommenda-tion, except for the studies from China and Burkina Faso(33–36) (Fig. 7b). Ca intakes reported in most studies were below or close to the EAR and consistent across regions except for one study conducted in India, where milk was reported to be widely consumed by pregnant women(37)(Fig. 7c).
Food consumption by food groups and meal pattern
Africa
The reported usual dietary intake of pregnant women in Africa was predominantly plant based. Typical meals included maize porridge, brown or corn bread with small amounts of vegetables and animal foods. Maize was the most common cereal, followed by millet, wheat, rice and teff. The grain/cereal food group provided ,59 %, 78 % and 81 % of energy intake in Ethiopia, Malawi and Kenya, respectively(27,30,41). Also, it was the primary source of protein in the studies in Ethiopia, Malawi and Kenya; of Fe in the studies in Ethiopia, Malawi, Kenya, Burkina Faso and the Seychelles; and of Zn in Ethiopia, Malawi, Kenya,
Kenya (2007) [30] Malawi (2002) [41] South Africa (2005) [44] South Africa (2005) [43] Seychelles (2008) [39] Ethiopia (2008) [27] Colombia (1999) [54] Mexico (2002) [97] Ecuador (1991) [51] Peru (2003) [50] Mexico (2005) [99] China (2009) [48] India (2003) [88] China (2002) [34] India (2009) [73] Indonesia (2003) [75] Jordan (2010) [85] Palau (2000) [87] Thailand (2004) [31] Thailand (2009) [105] Thailand (2010) [32] China (2010) [36] Afica Asia LAC Afica Asia LAC Seychelles (2008) [39] South Africa (2005) [43] South Africa (2005) [44] Egypt (1994) [40] Kenya (2007) [30] Burkina Faso (2009) [33] Malawi (2002) [41] Ethiopia (2008) [27] Jordan (2010) [85] Palau (2000) [87] China (2010) [36] Thailand (2009) [105] India (1998) [47] China (2009) [48] India (2009) [73] China (2002) [34] Indonesia (2003) [75] India (2003) [88] Thailand (2010) [32] India (2001) [91] India (2008) [79] Thailand (2004) [31] India (2004) [45] Mexico (2002) [97] Mexico (2010) [52] Ecuador (1991) [51] Mexico (2005) [99] Colombia (1999) [54] Peru (2003) [50] 200 250 300 350 400 150 Carbohydrate (g/d) 0 20 40 60 80 100 Fat (g/d) (a) (b)
Fig. 3 (a) Fat and (b) carbohydrate intakes of pregnant women by region: vertical reference lines are the medians of fat and carbohydrate intakes across studies; >, mean values; E, median values; LAC refers to Mexico, the Caribbean and Central/South America; numbers in square brackets represent reference numbers
Burkina Faso, the Seychelles and Egypt(27,30,33,38–41). Animal foods were a good secondary source of Zn in the studies from the Seychelles, Burkina Faso, Egypt and Malawi(33,39–41), but only small amounts were consumed by women in most studies, except in the Seychelles study(39). Green leafy vegetables and other vegetables were secondary food sources of Fe in the studies from the Seychelles and Burkina Faso, following the grain/cereal group(33,39). Women in the study from Ethiopia had relatively high Fe intakes compared with women in other studies from Africa, because of their high consumption of enset (Enset ventricosum)(27). Milk and dairy products were not widely consumed in most countries. Pulse and tuber groups were regularly consumed, but none were identified as good contributors to nutrient intakes.
Overall, green leafy vegetables and fruits were occa-sionally eaten, but intakes varied greatly across studies. Beverages such as coffee and sweetened tea were widely and frequently consumed in the Morocco, Ethiopia and South Africa studies(27,42–44).
Asia
The typical dietary intake of pregnant women varied considerably across the countries of the region. Dietary patterns in India were predominantly cereal based. Typical meals consisted of rice, flat breads such as roti and naan, with small amounts of vegetables or meat. Potatoes were the main tuber or root consumed(45,46). Consumption of dairy products differed considerably by study: more than 500 g of milk and dairy products were
Malawi (2002) [41] Burkina Faso (2009) [33] Kenya (2007) [30] South Africa (2005) [44] South Africa (2005) [43] Seychelles (2008) [39] India (2001) [91] India (2003) [88] Thailand (2004) [31] Indonesia (2003) [75] Iran (2008) [84] China (2009) [48] India (2009) [73] China (2002) [34] Thailand (2010) [32] China (2010) [36] China (2000) [89] Palau (2000) [87] Thailand (2009) [105] Jordan (2010) [85] LAC Asia Africa Colombia (1999) [54] Peru (2003) [50] Ecuador (1991) [51] Mexico (2005) [99] Mexico (2002) [97] 0 10 15 30
% of total energy intake
55 75
Fig. 4 Contributions of macronutrients to total energy intakes of pregnant women by region: >, protein as a percentage of total energy intake; 4, fat as a percentage of total energy intake; E, carbohydrate as a percentage of total energy intake; LAC refers to Mexico, the Caribbean and Central/South America; numbers in square brackets represent reference numbers. Percentages of total energy intake of studies in the present review are compared with the ranges of recommended intake (represented by vertical reference lines; 10–15 % of total energy for protein, 15–30 % of total energy for fat and 55–75 % of total energy for carbohydrate) as defined by WHO/FAO(28). Only studies with intake information available for all three macronutrients are shown
consumed daily by women in Haryana state in north India(37,47), but only 12 g/d were consumed by the Khasi Tribal women in north-east India(45). Fruit and vegetable intakes also differed across studies. Dietary intakes of women in the studies from China were characterized by high intakes of animal foods and pulses, compared with those in the studies from India. Nevertheless, pregnant women in the studies from China consumed most of their energy and protein from plant sources, primarily grains(34,48). The diets of pregnant women in the studies from Thailand were cereal based, with intakes of fruits and green vegetables contributing to vitamin A and
vitamin C intakes. However, inadequate intakes of milk and dairy products were common, and were accompanied by insufficient intakes of Ca and thiamin(31,32).
Latin America and the Caribbean
The typical meal pattern of pregnant women in the studies from LAC consisted of grains, accompanied by beans, vegetables and animal products. Bread, pasta and rice were consumed daily by most women. The cereal/ grain group contributed ,50–60 % of energy intake in the studies from Peru, Guatemala and Ecuador(49–51), and it was a good source of Zn in the study from Peru and of Ca
Seychelles (2008) [39] Malawi (2002) [41] Morocco (2006) [42] Kenya (2007) [30] Egypt (1994) [40] Ghana (2002) [81] South Africa (2005) [44] Burkina Faso (2009) [33] Ethiopia (2008) [27] Pakistan (2008) [102] Thailand (2010) [32] Jordan (2010) [85] Thailand (2004) [31] Palau (2000) [87] China (2010) [36] China (2009) [48] China (2009) [35] India (2002) [37] Thailand (2009) [105] India (2004) [45] Iran (2008) [84] China (2002) [34] India (2008) [74] India (2003) [88] India (1998) [47] Mexico (2002) [97] Ecuador (1991) [51] Brazil (2010) [55] Peru (2003) [50] Mexico (2005) [99] Brazil (2008) [103] Chile (2007) [101] Kenya (2007) [30] South Africa (2005) [44] Egypt (1994) [40] Seychelles (2008) [39] Malawi (2002) [41] Burkina Faso (2009) [33] Mexico (2005) [99] Ecuador (1991) [51] Chile (2007) [101] Peru (2003) [50] Vitamin A (µg RE/d) 0 500 1000 1500 2500 2500 Vitamin C (mg/d) 200 300 400 0 100 LAC Asia Thailand (2004) [31] Thailand (2010) [32] China (2009) [35] India (2008) [79] China (2010) [36] Thailand (2009) [105] Palau (2000) [87] China (2009) [48] Jordan (2010) [85] Iran (2008) [84] Indonesia (2003) [75] India (2002) [37] India (2003) [88] China (2002) [34] Africa LAC Asia Africa (a) (b)
Fig. 5 (a) Vitamin A and (b) vitamin C intakes of pregnant women by region: >, mean values; E, median values; LAC refers to Mexico, the Caribbean and Central/South America; numbers in square brackets represent reference numbers. Estimated mean or median vitamin A and vitamin C intakes of studies in the present review are compared with the Estimated Average Requirement (represented by vertical lines; 571 mg RE (retinol equivalents) for vitamin A and 46 mg for vitamin C)(24)
in the study from Guatemala(49,50). Tortillas were the main staple in the studies from Mexico and Guatemala and a
primary source of energy, protein, Zn and Ca,
but contributed to phytate intakes as well(49,52). Most of the studies reported a regular consumption of animal products, and these contributed to intakes of Zn and Fe. Beans were also widely consumed by women, but their contributions to Fe, Zn and Ca intakes were not as high as animal products in most studies. Fruits and their juices were commonly consumed by the women as snacks and provided sufficient intakes of vitamin A and vitamin C in Brazil, Ecuador and Colombia(51,53,54). In Peru and Ecuador, milk and dairy products were frequently
consumed, and were a primary source of riboflavin and Ca(50,51). Coffee was also reported to be frequently con-sumed by women in the studies from Peru, Brazil and Colombia(50,54,55).
Discussion
To our knowledge, the current synthesis presents the most comprehensive report to date on the macro- and micronutrient intakes as well as food consumption pat-terns of pregnant women in low- and middle-income countries. Our results show that the distributions of
Jamaica (1989) [100] Ecuador (1991) [51] Peru (2003) [50] Mexico (2005) [99] Chile (2007) [101] China (2009) [35] India (1998) [47] Thailand (2010) [32] Thailand (2009) [105] India (2002) [37] Palau (2000) [87] Iran (2008) [84] China (2010) [36] China (2009) [48] India (2003) [88] China (2002) [34] Thailand (2004) [31] Egypt (2010) [80] Egypt (1994) [40] Burkina Faso (2009) [33] Seychelles (2008) [39] Ghana (2002) [81] Africa Asia LAC Africa Asia LAC Africa Asia LAC Africa Asia LAC Ghana (2002) [81] Morocco (2006) [42] Seychelles (2008) [39] Egypt (1994) [40] Burkina Faso (2009) [33] Iran (2008) [84] Palau (2000) [87] India (2002) [37] China (2002) [34] China (2009) [48] India (1998) [47] China (2010) [36] China (2009) [35] Thailand (2010) [32] Thailand (2009) [105] Thailand (2004) [31] Ecuador (1991) [51] Chile (2007) [101] Mexico (2005) [99] Peru (2003) [50] Egypt (1994) [40] Ghana (2002) [81] South Africa (2005) [44] Burkina Faso (2009) [33] Ecuador (1991) [51] Peru (2003) [50] Chile (2007) [101] Niacin (mg NE/d) 0 100 200 300 400 500 Folate (µg DFE/d) 5 10 15 20 25 30 China (2010) [36] Palau (2000) [87] Iran (2008) [84] China (2009) [35] China (2002) [34] India (1998) [47] China (2009) [48] Thailand (2010) [32] Thailand (2009) [105] Thailand (2004) [31] Thiamin (mg/d) 0·5 1.0 1·5 2.0 Riboflavin (mg/d) Jordan (2010) [85] China (2010) [36] China (2009) [48] India (2002) [37] India (1998) [47] Palau (2000) [87] India (2008) [79] Iran (2008) [84] India (2008) [74] India (2004) [93] Chile (2007) [101] Peru (2003) [50] Brazil (2010) [55] Mexico (2005) [99] Egypt (2010) [80] Egypt (1994) [40] Kenya (2007) [30] Seychelles (2008) [39] Burkina Faso (2009) [33] Malawi (2002) [41] South Africa (2005) [44] Morocco (2006) [42] 0·5 0 1.0 1·5 2.0 (a) (b) (c) (d)
Fig. 6 (a) Thiamin, (b) riboflavin, (c) niacin and (d) folate intakes of pregnant women by region: >, mean values; E, median values;
J, folic acid (mg); LAC refers to Mexico, the Caribbean and Central/South America; numbers in square brackets represent
reference numbers. Estimated mean or median thiamin, riboflavin, niacin and folate intakes of studies in the present review are compared with the Estimated Average Requirement (represented by vertical lines; 1?2 mg for thiamin and riboflavin, 14 mg NE (niacin equivalents) for niacin and 480 mg DFE (dietary folate equivalents) for folate)(24)
energy, protein, fat and carbohydrate intakes were approximately higher in the diet of pregnant women in LAC than in Africa and Asia. However, we cannot rule out that this result may reflect an over-representation of urban study populations in the LAC studies. There was less variability across regions in protein intake than in carbohydrate and fat intakes, leading to a strong inverse association when considered as of percentage of total energy intake. Of selected vitamins and minerals, folate and Fe intakes were most frequently below the EAR across regions, which underscores some of the high prevalences of anaemia among pregnant women living in developing countries(56,57). Inadequate intakes of vitamins and minerals were also evident across the regions. Dietary patterns were predominantly plant based with infrequent consumption of nutrient-rich foods, supporting the relative lack of diversity previously noted in the diet of pregnant women in low-resource settings(58).
Our findings of macro/micronutrient intakes are consistent with other studies that have examined nutrient intakes of pregnant women in developing countries. McGuire and Popkin summarized energy and protein
intakes of pregnant women in the studies conducted in developing countries and published between 1958 and 1988(9). The average energy and protein intakes in the present review (8?7 MJ/d or 2075 kcal/d and 64?3 g/d) are higher than in the previous report (7?6 MJ/d or 1816 kcal/d and 52?4 g/d). This suggests that energy and protein intakes of pregnant women in developing countries may have improved during the past several decades(9).
For micronutrient intakes, the results of the present review are consistent with previously reported findings of inadequate folate intakes across regions and higher con-sumption of vitamin A, vitamin C and riboflavin in LAC as compared with Africa and Asia(59). The intakes reported in some studies may be biased due to seasonality, which would affect intakes of vitamins A and C in particular. Vitamin C intakes were most frequently above the EAR; we speculate that this might be due to relatively constant consumption of vegetables such as cabbage, kale, peas and tomatoes, which are important sources of vitamin C(19). The low Ca intakes seen in the present review are con-sistent with the previously published literature(5,60). A recent review of randomized trials concluded that
Seychelles (2008) [39] Ghana (2002) [81] Egypt (2009) [82] Morocco (2006) [42] Malawi (2002) [41] Burkina Faso (2009) [33] Ethiopia (2008) [27] Kenya (2007) [30] Gambia (1993) [83] Egypt (1994) [40] South Africa (2005) [44] India (2002) [37] Jordan (2010) [85] China (2009) [35] India (1998) [47] India (2010) [90] Pakistan (2008) [102] Thailand (2009) [105] Iran (2008) [84] Iran (2005) [76] China (2002) [34] China (2010) [36] Iran (2010) [77] India (2003) [88] Thailand (2010) [32] Palau (2000) [87] China (2009) [48] China (2000) [89] India (2004) [45] Indonesia (2003) [75] India (1996) [92] Thailand (2004) [31] Ca (mg/d) 0 500 1000 1500 Mexico (2005) [99] Ecuador (1991) [51] Guatemala (1993) [49] Chile (2007) [101] Brazil (2010) [55] Argentina (2003) [106] Peru (2003) [50] Brazil (2008) [103] Brazil (2002) [104] Mexico (2009) [98] Burkina Faso (2009) [33] Morocco (2006) [42] Kenya (2007) [30] Egypt (2010) [80] Egypt (1994) [40] Seychelles (2008) [39] South Africa (2005) [44] Malawi (2002) [41] Ethiopia (2008) [27] China (2002) [34] China (2010) [36] China (2009) [35] Iran (2010) [77] Iran (2008) [84] Jordan (2010) [85] China (2009) [48] India (2010) [90] China (2000) [89] Palau (2000) [87] India (2004) [93] Thailand (2009) [105] Peru (2003) [50] Guatemala (1993) [49] Chile (2007) [101] Mexico (2005) [99] Ethiopia (2008) [27] Morocco (2006) [42] Kenya (2007) [30] Egypt (2010) [80] Malawi (2002) [41] Egypt (1994) [40] South Africa (2005) [43] South Africa (2005) [44] Seychelles (2008) [39] Gahana (2002) [81] Chile (2007) [101] Ecuador (1991) [51] Brazil (2008) [103] Mexico (2005) [99] Jamaica (1989) [100] Brazil (2010) [55] Peru (2003) [50] 10 20 30 40 Fe (mg/d) 0 5 10 15 20 Zn (mg/d) China (2000) [89] China (2002) [34] India (2008) [79] India (1996) [92] China (2009) [48] Pakistan (2008) [102] China (2009) [35] Thiland (2004) [31] India (2002) [37] India (1998) [47] India (2004) [45] India (2010) [90] Thailand (2010) [32] Iran (2010) [77] Thailand (2009) [105] India (2008) [74] India (2004) [93] Indonesia (2003) [75] Palau (2000) [87] Jordan (2010) [85] China (2010) [36] Iran (2008) [84] India (2003) [88] (a) (b) (c) Africa Asia LAC Africa Asia Asia LAC Africa LAC
Fig. 7 (a) Iron, (b) zinc and (c) calcium intakes of pregnant women by region: >, mean values; E, median values; LAC refers to Mexico, the Caribbean and Central/South America; numbers in square brackets represent reference numbers. Estimated mean or median iron, zinc and calcium intakes of studies in the present review are compared with the Estimated Average Requirement (represented by vertical lines; 40 mg for iron, 11?7 mg for zinc and 833 mg for calcium)(24)
Ca supplementation reduces the risk of pre-eclampsia mainly in women with low Ca intakes(61). Achieving adequate dietary Ca intakes before and in early preg-nancy may therefore be important in preventing the underlying pathologies of pre-eclampsia, which together with eclampsia are major causes of maternal and perinatal morbidity and mortality(61). This underscores the critical need to emphasize the consumption of Ca-rich foods such as milk and dairy products for pregnant women as well as those of childbearing age. Zn is thought to influ-ence fetal growth, duration of gestation and early neonatal survival(62). In the present review Zn intakes were below the EAR, except for the studies from China where the diets typically included a high proportion of animal foods and one study from Burkina Faso, where the diets were characterized by consumption of cereal/grains and animal products. With respect to Fe, inadequate Fe intake was more apparent now than in the previous review, mainly because of the higher EAR cut-off (40 v. 22 mg/d)(59). This higher EAR cut-off reflects the increased requirement for Fe during pregnancy for maternal physiological adap-tation and optimal fetal growth in developing countries, where bioavailability of Fe is usually low(19). Fe deficiency is the most common cause of anaemia and Fe-deficiency anaemia during pregnancy is a risk factor for maternal mortality, preterm birth and poor infant/child develop-ment in underprivileged areas(56).
Macro- and micronutrient intakes of women during pregnancy in developing countries differ from those of developed countries. Compared with studies of dietary intake of pregnant women living in developed countries including Denmark, Norway, the UK, Portugal, Greece, the USA and Australia(23,63–70), the average intakes of energy and macronutrients in the present review are lower than those reported for developed countries, except carbohydrate intake. It is noteworthy that even though intakes of micronutrients such as vitamin A, thiamin, riboflavin, vitamin C, Ca and Zn in developed countries were above the EAR, the Fe and folate intakes without supplementation were consistent with those reported from the developing countries in the present review(65,67,68,71). This supports the universality of inade-quate folate and Fe intakes among pregnant women(72) and the difficulties in meeting increased folate and Fe requirements during pregnancy with food sources.
There are limitations to this compilation worth noting. The results of the present review cannot be generalized across the entire population of pregnant women in low-and middle-income countries, because individual study populations included in the review were not nationally representative. Moreover, multiple studies from the same country might unduly influence the overall regional nutrient intakes. Because the review did not restrict study design, recruitment methods, dietary assessment methods employed and population characteristics, there were likely high variations in the internal validity of each study,
which would consequently affect the overall validity of the review. Intakes of energy, vitamin A and vitamin C are known to be influenced by season (e.g. dry/rainy or harvest/pre-harvest seasons), and thus dietary assess-ments may not have been repeated sufficiently to capture usual (long-term) intakes(41). A lack of country-specific food composition tables for some of the studies led researchers to employ tables from other countries, which could lead to the introduction of some inaccuracies. And lastly, some studies reported mean values for intake distributions that are non-normally distributed.
We also faced challenges in utilizing information. Among macronutrient intakes, fat and carbohydrate were less frequently reported than protein across regions, making it difficult to estimate the distributions of macro-nutrient consumption (Figs 2 and 3). In addition, the analysis relied on frequently reported micronutrients, and this was partially due to relatively fewer reported nutrients in LAC studies compared with studies in Africa and Asia. Finally, a variety of ways of reporting food consumption made it difficult to compile information: studies from Africa often reported food sources of specific nutrients, whereas studies from Asia reported the usual amount of food consumed (g/d).
Despite these limitations, the present review provides a snapshot of dietary intakes of pregnant women living in developing countries. It is evident that there is under-nutrition in some areas in Africa and Asia. Energy and macronutrients intakes in LAC were higher than in Africa and Asia, but still a substantial number of pregnant women may not meet their requirements for micronutrients in the LAC region. The characteristics of maternal dietary intakes in developing countries are expected to change with socio-economic changes and likely move to being characterized by higher and perhaps excess energy intakes with few gains in the intakes of key micronutrients. To improve poor dietary intakes of pregnant women in developing countries, population-level sustainable and globally standardized dietary monitoring is essential. The findings of relatively adequate intakes of Fe and vitamin A in studies from Ethiopia and Kenya suggest access to and consumption of local foods which are rich sources of these nutrients(27,30). Only a small number of studies reported that subjects took micronutrient supplements and even in these settings the proportion of supplement users was low(30,42,51,54,73–79). This underscores the need for greater access to and promotion of dietary counselling and antenatal Fe–folic acid or multiple micronutrient supplementations during pregnancy to combat maternal micronutrient deficiencies in developing countries.
Conclusions
The present review demonstrates commonalities in the dietary intakes of pregnant women in developing countries,
in terms of unbalanced macronutrient profiles and multiple micronutrient deficiencies. Multidimensional and systematic public health efforts are needed and should be imple-mented to improve the nutrition of pregnant women in developing countries.
Acknowledgements
Disclaimer: The opinions stated in this paper are those of the authors as individuals and do not necessarily represent the views of the WHO or its Member States. Sources of funding: This systematic review was partially supported by a WHO contract to the Johns Hopkins Bloomberg School of Public Health. A Harry D. Kruse Publication Award in Human Nutrition is gratefully acknowledged. Conflicts of interest: There are no conflicts of interests. Authors’ con-tributions: L.E.C. and S.A.T. contributed to the design of the study, interpretation and manuscript preparation. S.E.L. contributed to the analysis, interpretation and manuscript preparation. S.E.L. has full access to all of the data in the study and takes responsibility for the integrity of the data and the accuracy of the data analysis. All authors read and approved the final manuscript.
References
1. Abu-Saad K & Fraser D (2010) Maternal nutrition and birth outcomes. Epidemiol Rev 32, 5–25.
2. Kramer MS (2003) The epidemiology of adverse pregnancy outcomes: an overview. J Nutr 133, 5 Suppl. 2, 1592S–1596S. 3. Scholl TO (2008) Maternal nutrition before and during pregnancy. In Window of Opportunity: Pre-Pregnancy to 24 Months of Age, vol. 61, pp. 79–89. [DJP Barker, editor]. Basel: Karger.
4. Rush D (2001) Maternal nutrition and perinatal survival. J Health Popul Nutr 19, issue 3, S217–S264.
5. Black RE, Allen LH, Bhutta ZA et al. (2008) Maternal and child undernutrition: global and regional exposures and health consequences. Lancet 371, 243–260.
6. Barker DJ (1997) Maternal nutrition, fetal nutrition, and disease in later life. Nutrition 13, 807–813.
7. Gluckman PD & Hanson MA (2004) Living with the past: evolution, development, and patterns of disease. Science 305, 1733–1736.
8. Victora CG, Adair L, Fall C et al. (2008) Maternal and child undernutrition: consequences for adult health and human capital. Lancet 371, 340–357.
9. McGuire JS & Popkin BM (1990) Helping Women Improve Nutrition in the Developing World: Beating the Zero Sum Game. World Bank Technical Paper no. 114. Washington, DC: World Bank.
10. World Health Organization, Department of Nutrition for Health and Development (2001) Iron Deficiency Anaemia: Assessment, Prevention and Control: A Guide for Programme Managers. Geneva: WHO.
11. Caulfield LE, Zavaleta N, Shankar AH et al. (1998) Potential contribution of maternal zinc supplementation during pregnancy to maternal and child survival. Am J Clin Nutr 68, 2 Suppl., 499S–508S.
12. Costello AM & Osrin D (2003) Micronutrient status during pregnancy and outcomes for newborn infants in develop-ing countries. J Nutr 133, 5 Suppl. 2, 1757S–1764S.
13. Ingram CF, Fleming AF, Patel M et al. (1999) Pregnancy- and lactation-related folate deficiency in South Africa – a case for folate food fortification. S Afr Med J 89, 1279–1284. 14. Ramakrishnan U (2002) Prevalence of micronutrient
malnutrition worldwide. Nutr Rev 60, 5 Pt 2, S46–S52. 15. Tamura T & Picciano MF (2006) Folate and human
reproduction. Am J Clin Nutr 83, 993–1016.
16. World Health Organization (2009) Global Prevalence of Vitamin A Deficiency in Populations at Risk 1995–2005: WHO Global Database on Vitamin A Deficiency. Geneva: WHO.
17. World Health Organization & Food and Agriculture Organization of the United Nations (1993) Fats and Oils in Human Nutrition: Report of a Joint Expert Consultation, Rome, 19–26 October 1993. Rome: FAO.
18. World Health Organization (1998) Preparation and Use of Food-based Dietary Guidelines. Geneva: WHO.
19. World Health Organization & Food and Agriculture Organization of the United Nations (2005) Vitamin and Mineral Requirements in Human Nutrition, 2nd ed. Geneva: WHO.
20. Food and Agriculture Organization of the United Nations, World Health Organization & United Nations University (1985) Energy and Protein Requirements. Report of a Joint FAO/WHO/UNU Expert Consultation. WHO Technical Report Series no. 724. Geneva: WHO.
21. Ruel MT, Deitchler M & Arimond M (2010) Developing simple measures of women’s diet quality in developing countries: overview. J Nutr 140, issue 11, 2048S–2050S. 22. The World Bank (2011) Country and Lending Groups.
Washington, DC: The World Bank; available at http://data. worldbank.org/node/123.
23. Rifas-Shiman SL, Rich-Edwards JW, Willett WC et al. (2006) Changes in dietary intake from the first to the second trimester of pregnancy. Paediatr Perinat Epidemiol 20, 35–42.
24. Allen LH, De Benoist B, Dary O et al. (2006) Guidelines on Food Fortification with Micronutrients. Geneva: WHO. 25. Goldberg GR, Black AE, Jebb SA et al. (1991) Critical
evaluation of energy intake data using fundamental principles of energy physiology: 1. Derivation of cut-off limits to identify under-recording. Eur J Clin Nutr 45, 569–581.
26. Henry CJ (2005) Basal metabolic rate studies in humans: measurement and development of new equations. Public Health Nutr 8, 1133–1152.
27. Abebe Y, Bogale A, Hambidge KM et al. (2008) Inadequate intakes of dietary zinc among pregnant women from subsistence households in Sidama, Southern Ethiopia. Public Health Nutr 11, 379–386.
28. World Health Organization, Department of Nutrition for Health and Development (2003) Diet, Nutrition and the Prevention of Chronic Diseases. Report of a Joint WHO/ FAO Expert Consultation. WHO Technical Report Series no. 916. Geneva: WHO.
29. James WPT, Schofield EC & Food and Agriculture Organization of the United Nations (1990) Human Energy Requirements: A Manual for Planners and Nutritionists. Oxford: Oxford University Press.
30. Kamau-Mbuthia E & Elmadfa I (2007) Diet quality of pregnant women attending an antenatal clinic in Nakuru, Kenya. Ann Nutr Metab 51, 324–330.
31. Piammongkol S, Marks GC, Williams G et al. (2004) Food and nutrient consumption patterns in third trimester Thai-Muslim pregnant women in rural Southern Thailand. Asia Pac J Clin Nutr 13, 236–241.
32. Sukchan P, Liabsuetrakul T, Chongsuvivatwong V et al. (2010) Inadequacy of nutrients intake among pregnant women in the Deep South of Thailand. BMC Public Health 10, 572.
33. Huybregts LF, Roberfroid DA, Kolsteren PW et al. (2009) Dietary behaviour, food and nutrient intake of pregnant women in a rural community in Burkina Faso. Matern Child Nutr 5, 211–222.
34. Ma A, Chen X, Zheng M et al. (2002) Iron status and dietary intake of Chinese pregnant women with anaemia in the third trimester. Asia Pac J Clin Nutr 11, 171–175. 35. Peng Y, Zhou T, Wang Q et al. (2009) Fatty acid
composition of diet, cord blood and breast milk in Chinese mothers with different dietary habits. Prostaglandins Leukot Essent Fatty Acids 81, 325–330.
36. Zhang F, Yi C, Fang GH et al. (2010) Dietary intakes and behaviours in pregnant women of Li ethnicity: a compar-ison of mountainous and coastal populations in southern China. Asia Pac J Clin Nutr 19, 236–242.
37. Dahiya S (2002) Nutritional status assessment of pregnant women from Hisar city of Haryana. Nutr Health 16, 239–247. 38. Gibson RS & Huddle JM (1998) Suboptimal zinc status in pregnant Malawian women: its association with low intakes of poorly available zinc, frequent reproductive cycling, and malaria. Am J Clin Nutr 67, 702–709. 39. Bonham MP, Duffy EM, Robson PJ et al. (2009)
Contribu-tion of fish to intakes of micronutrients important for fetal development: a dietary survey of pregnant women in the Republic of Seychelles. Public Health Nutr 12, 1312–1320. 40. Kirksey A, Wachs TD, Yunis F et al. (1994) Relation of maternal zinc nutriture to pregnancy outcome and infant development in an Egyptian village. Am J Clin Nutr 60, 782–792.
41. Nyambose J, Koski KG & Tucker KL (2002) High intra/ interindividual variance ratios for energy and nutrient intakes of pregnant women in rural Malawi show that many days are required to estimate usual intake. J Nutr 132, 1313–1318.
42. Belgnaoui S & Belahsen R (2006) Nutrient intake and food consumption among pregnant women from an agricul-tural region of Morocco. Int J Food Sci Nutr 57, 19–27. 43. Kesa H & Oldewage-Theron W (2005) Anthropometric
indications and nutritional intake of women in the Vaal Triangle, South Africa. Public Health 119, 294–300. 44. Mostert D, Steyn NP, Temple NJ et al. (2005) Dietary
intake of pregnant women and their infants in a poor black South African community. Curationis 28, 12–19. 45. Agrahar-Murugkar D & Pal PP (2004) Intake of nutrients
and food sources of nutrients among the Khasi tribal women of India. Nutrition 20, 268–273.
46. Panwar B & Punia D (1998) Food intake of rural pregnant women of Haryana State, northern India: relationship with education and income. Int J Food Sci Nutr 49, 243–247. 47. Panwar B & Punia D (1998) Nutrient intake of rural
pregnant women of Haryana state, northern India: relationship between income and education. Int J Food Sci Nutr 49, 391–395.
48. Cheng Y, Dibley MJ, Zhang X et al. (2009) Assessment of dietary intake among pregnant women in a rural area of western China. BMC Public Health 9, 222.
49. Fitzgerald SL, Gibson RS, Quan de Serrano J et al. (1993) Trace element intakes and dietary phytate/Zn and Ca 3 phytate/Zn millimolar ratios of periurban Guatemalan women during the third trimester of pregnancy. Am J Clin Nutr 57, 195–201.
50. Sacco LM, Caulfield LE, Zavaleta N et al. (2003) Dietary pattern and usual nutrient intakes of Peruvian women during pregnancy. Eur J Clin Nutr 57, 1492–1497. 51. Weigel MM, Narvaez WM, Lopez A et al. (1991) Prenatal
diet, nutrient intake and pregnancy outcome in urban Ecuadorian primiparas. Arch Latinoam Nutr 41, 21–37. 52. Parra-Cabrera S (2011) Dietary intakes of polyunsaturated
fatty acids among pregnant Mexican women. Matern Child Health J 7, 140–147.
53. Buss C, Nunes MA, Camey S et al. (2009) Dietary fibre intake of pregnant women attending general practices in southern Brazil – the ECCAGE Study. Public Health Nutr 12, 1392–1398.
54. Dufour DL, Reina JC & Spurr GB (1999) Food and macronutrient intake of economically disadvantaged preg-nant women in Colombia. Am J Hum Biol 11, 753–762. 55. Sato APS & Tsunechiro MA (2010) Food consumption and
iron intake of pregnant and reproductive aged women. Rev Latino-Am Enfermagem 18, 247–254.
56. Allen LH (2000) Anemia and iron deficiency: effects on pregnancy outcome. Am J Clin Nutr 71, 5 Suppl., 1280S–1284S.
57. Stoltzfus RJ (2011) Iron interventions for women and children in low-income countries. J Nutr 141, issue 4, 756S–762S.
58. Arimond M, Wiesmann D, Becquey E et al. (2010) Simple food group diversity indicators predict micronutrient adequacy of women’s diets in 5 diverse, resource-poor settings. J Nutr 140, issue 11, 2059S–2069S.
59. Torheim LE, Ferguson EL, Penrose K et al. (2010) Women in resource-poor settings are at risk of inadequate intakes of multiple micronutrients. J Nutr 140, issue 11, 2051S–2058S. 60. Merialdi M, Mathai M, Ngoc NTN et al. (2005) World Health Organization systematic review of the literature and multinational nutritional survey of calcium intake during pregnancy. Fetal Matern Med Rev 16, 97–121. 61. Hofmeyr GJ, Duley L & Atallah A (2007) Dietary calcium
supplementation for prevention of pre-eclampsia and related problems: a systematic review and commentary. BJOG 114, 933–943.
62. Shah D & Sachdev HP (2006) Zinc deficiency in pregnancy and fetal outcome. Nutr Rev 64, 15–30. 63. Haugen M, Brantsaeter AL, Alexander J et al. (2008)
Dietary supplements contribute substantially to the total nutrient intake in pregnant Norwegian women. Ann Nutr Metab 52, 272–280.
64. Moore VM, Davies MJ, Willson KJ et al. (2004) Dietary composition of pregnant women is related to size of the baby at birth. J Nutr 134, 1820–1826.
65. Olsen SF, Mikkelsen TB, Knudsen VK et al. (2007) Data collected on maternal dietary exposures in the Danish National Birth Cohort. Paediatr Perinat Epidemiol 21, 76–86. 66. Petridou E, Stoikidou M, Diamantopoulou M et al. (1998) Diet during pregnancy in relation to birthweight in healthy singletons. Child Care Health Dev 24, 229–242. 67. Pinto E, Barros H & Santos Silva ID (2009) Dietary intake
and nutritional adequacy prior to conception and during pregnancy: a follow-up study in the north of Portugal. Public Health Nutr 12, 922–931.
68. Rogers I & Emmett P (1998) Diet during pregnancy in a population of pregnant women in South West England. ALSPAC Study Team. Avon Longitudinal Study of Preg-nancy and Childhood. Eur J Clin Nutr 52, 246–250. 69. Siega-Riz AM, Bodnar LM & Savitz DA (2002) What are
pregnant women eating? Nutrient and food group differ-ences by race. Am J Obstet Gynecol 186, 480–486. 70. Turner RE, Langkamp-Henken B, Littell RC et al. (2003)
Comparing nutrient intake from food to the estimated average requirements shows middle- to upper-income pregnant women lack iron and possibly magnesium. J Am Diet Assoc 103, 461–466.
71. Rifas-Shiman SL, Rich-Edwards JW, Kleinman KP et al. (2009) Dietary quality during pregnancy varies by maternal characteristics in Project Viva: a US cohort. J Am Diet Assoc 109, 1004–1011.
72. Ortiz-Andrellucchi A, Doreste-Alonso J, Henriquez-Sanchez P et al. (2009) Dietary assessment methods for micronutrient intake in pregnant women: a systematic review. Br J Nutr 102, Suppl. 1, S64–S86.
73. Dwarkanath P, Muthayya S, Thomas T et al. (2009) Polyunsaturated fatty acid consumption and concentra-tion among South Indian women during pregnancy. Asia Pac J Clin Nutr 18, 389–394.
74. Gautam VP, Taneja DK, Sharma N et al. (2008) Dietary aspects of pregnant women in rural areas of Northern India. Matern Child Nutr 4, 86–94.
75. Hartini TN, Winkvist A, Lindholm L et al. (2003) Nutrient intake and iron status of urban poor and rural poor without access to rice fields are affected by the emerging economic crisis: the case of pregnant Indonesian women. Eur J Clin Nutr 57, 654–666.
76. Karandish M (2005) Inadequate intake of calcium and dairy products among pregnant women in Ahwaz City, Iran. Mal J Nutr 11, 111–120.
77. Khoushabi F & Saraswathi G (2010) Impact of nutritional status on birth weight of neonates in Zahedan City, Iran. Nutr Res Pract 4, 339–344.
78. Muthayya S, Dwarkanath P, Thomas T et al. (2009) The effect of fish and omega-3 LCPUFA intake on low birth weight in Indian pregnant women. Eur J Clin Nutr 63, 340–346.
79. Singh MB, Fotedar R & Lakshminarayana J (2009) Micronutrient deficiency status among women of desert areas of western Rajasthan, India. Public Health Nutr 12, 624–629.
80. Abdel-Megeid FY (2010) Effects of bad nutritional habits on health of pregnant women. World J Med Sci 5, 22–29.
81. Nti CA, Larweh PM & Gyemfua-yeboah Y (2002) Food consumption patterns, dietary quality and health status of expectant mothers: case studies in suburban and rural communities in Ghana. Int J Consum Stud 26, 7–14. 82. Darwish AM, Mohamad SN, Al-Din HRG et al. (2009)
Prevalence and predictors of deficient dietary calcium intake during the third trimester of pregnancy: the experience of a developing country. J Obstet Gynaecol Res 35, 106–112.
83. Prentice A, Laskey MA, Shaw J et al. (1993) The calcium and phosphorus intakes of rural Gambian women during pregnancy and lactation. Br J Nutr 69, 885–896.
84. Esmaillzadeh A, Samareh S & Azadbakht L (2008) Dietary patterns among pregnant women in the west-north of Iran. Pak J Biol Sci 11, 793–796.
85. Bawadi HA, Al-Kuran O, Al-Bastoni LA et al. (2010) Gestational nutrition improves outcomes of vaginal deliveries in Jordan: an epidemiologic screening. Nutr Res 30, 110–117.
86. Kaseb F, Kimiagar M, Ghafarpoor M et al. (2002) Effect of traditional food supplementation during pregnancy on maternal weight gain and birthweight. Int J Vitam Nutr Res 72, 389–393.
87. Pobocik RS, Heathcote GM, Spiers JB et al. (2000) Nutritional and anthropometric assessment of a sample of pregnant women and young children in Palau. Asia Pac J Clin Nutr 9, 102–114.
88. Andersen LT, Thilsted SH, Nielsen BB et al. (2003) Food and nutrient intakes among pregnant women in rural Tamil Nadu, South India. Public Health Nutr 6, 131–137. 89. Yang YX, Chen XC, Liu JY et al. (2000) Effect of zinc intake on fetal and infant growth among Chinese pregnant and lactating women. Biomed Environ Sci 13, 280–286.
90. Khoushabi F & Saraswathi G (2010) Association between maternal nutrition status and birth weight of neonates in selected hospitals in Mysore city, India. Pak J Nutr 9, 1124–1130.
91. Rao S, Yajnik CS, Kanade A et al. (2001) Intake of micronutrient-rich foods in rural Indian mothers is associated with the size of their babies at birth: Pune Maternal Nutrition Study. J Nutr 131, 1217–1224. 92. Hutter I (1996) Reduction of food intake during
preg-nancy in rural south India. Trop Med Int Health 1, 399–405.
93. Pathak P, Kapil U, Kapoor SK et al. (2004) Prevalence of multiple micronutrient deficiencies amongst pregnant women in a rural area of Haryana. Indian J Pediatr 71, 1007–1014.
94. Kapil U (2002) Zinc and magnesium nutriture amongst pregnant mothers of urban slum communities in Delhi: a pilot study. Indian Pediatr 39, 365–368.
95. Zobairi SE, Freitas ML & Wasti SA (1998) Diet and nutrition: a knowledge, attitude and practice study of pregnant women in Karachi. Aust N Z J Obstet Gynaecol 38, 188–193.
96. Alam DS, Van Raaij JM, Hautvast JG et al. (2003) Energy stress during pregnancy and lactation: consequences for maternal nutrition in rural Bangladesh. Eur J Clin Nutr 57, 151–156.
97. Parra MS, Schnaas L, Meydani M et al. (2002) Erythrocyte cell membrane phospholipid levels compared against reported dietary intakes of polyunsaturated fatty acids in pregnant Mexican women. Public Health Nutr 5, 931–937. 98. Avendano-Badillo D, Avila M, Hernandez-Cadena L et al. (2009) High dietary calcium intake decreases bone mobilization during pregnancy in humans. Salud Publica Mex 51, Suppl 1, S100–S107. 99. Ramos Herna´ndez RI, Romero Quechol G, Reyes Morales H
et al. (2005) Dietary intake and nutritional status of pregnant women enrolled in the Mexican Institute of Social Security, living in a peri-urban area of Mexico City. Ginecol Obstet Mex 73, 3–10.
100. Landman JP & Hall JS (1989) Dietary patterns and nutrition in pregnancy in Jamaica. J Trop Pediatr 35, 185–190. 101. Dura´n Ferna´ndez E, Soto AD, Labran˜a TAM et al. (2007)
Dietetic adequation of micronutrients in pregnant women. Rev Chil Nutr 34, 321–329.
102. Janjua NZ, Delzell E, Larson RR et al. (2009) Determinants of low birth weight in urban Pakistan. Public Health Nutr 12, 789–798.
103. Zentner LE, Rondo PH, Duran MC et al. (2008) Relation-ships of blood lead to calcium, iron, and vitamin C intakes in Brazilian pregnant women. Clin Nutr 27, 100–104. 104. Bezerra FF, Laboissie`re FP, King JC et al. (2002) Pregnancy
and lactation affect markers of calcium and bone metabolism differently in adolescent and adult women with low calcium intakes. J Nutr 132, 2183–2187. 105. Jaruratanasirikul S, Sangsupawanich P, Koranantakul O
et al. (2009) Influence of maternal nutrient intake and weight gain on neonatal birth weight: a prospective cohort study in southern Thailand. J Matern Fetal Neonatal Med 22, 1045–1050.
106. Zeni SN, Ortela Soler CR, Lazzari A et al. (2003) Interrelationship between bone turnover markers and dietary calcium intake in pregnant women: a longitudinal study. Bone 33, 606–613.