S U P P L E M E N T A R T I C L E
Using Geographic Information Systems and
Spatial Analysis Methods to Assess Household
Water Access and Sanitation Coverage in the
SHINE Trial
Robert Ntozini,1Sara J. Marks,2Goldberg Mangwadu,1,3Mduduzi N. N. Mbuya,1,4Grace Gerema,1Batsirai Mutasa,1 Timothy R. Julian,2Kellogg J. Schwab,5Jean H. Humphrey,1,4and Lindiwe I. Zungu6; for the Sanitation Hygiene Infant Nutrition Efficacy (SHINE) Trial Teama
1
Zvitambo Institute for Maternal and Child Health Research, Harare, Zimbabwe;2Swiss Federal Institute of Aquatic Science and Technology (Eawag), Duebendorf, Switzerland;3Ministry of Health and Child Care, Harare, Zimbabwe;4Center for Human Nutrition and5Department of Environmental Health Sciences, Johns Hopkins Bloomberg School of Public Health, Baltimore, Maryland; and6Department of Health Studies, University of South Africa, Pretoria
Access to water and sanitation are important determinants of behavioral responses to hygiene and sanitation in-terventions. We estimated cluster-specific water access and sanitation coverage to inform a constrained random-ization technique in the SHINE trial. Technicians and engineers inspected all public access water sources to ascertain seasonality, function, and geospatial coordinates. Households and water sources were mapped using open-source geospatial software. The distance from each household to the nearest perennial, functional, protected water source was calculated, and for each cluster, the median distance and the proportion of households within <500 m and >1500 m of such a water source. Cluster-specific sanitation coverage was ascertained using a random sample of 13 households per cluster. These parameters were included as covariates in randomization to optimize balance in water and sanitation access across treatment arms at the start of the trial. The observed high variability between clusters in both parameters suggests that constraining on these factors was needed to reduce risk of bias. Keywords. spatial analysis; water access; water coverage; geographic information systems; georeferenced dataset.
Achievement of the Millennium Development Goal (MDG) Target 7c (halving the proportion of people without sustainable access to safe drinking water) was an important milestone toward universal access to suf-ficient quantity and quality of water, a human right es-sential for human health and survival [1–4]. Target 7c defined “access” as the availability of at least 20 L of
water per person per day from an improved source within 1 km [5].
However, the achievement of this target has been called an exaggeration of real progress because it does not account for several characteristics of water access proven to be important for human health: household-level walk time and distance to water, functionality and seasonality of water sources, per capita daily volume of water collected and used, and microbiological and chem-ical water quality at the point of use [6]. Additionally, achievement of MDG 7 at the country level often relied on combining national or subnational water-point sur-veys with population census data to calculate average or“theoretical” water coverage per capita. Because the density of both water points and populations may be highly variable across the regions assessed, such estimates often misrepresent access at the village and individual householdlevel [7]. Accordingly, the post-2015 monitoring
a
Members of the SHINE Trial Team are shown in SHINE Trial Team,“The Sanitation Hygiene Infant Nutrition Efficacy (SHINE) trial: rationale, design, and methods,” Clin Infect Dis 2015; 61(suppl 7):S685–702.
Correspondence: Robert Ntozini, MPH, Zvitambo Institute for Maternal and Child Health Research, 16 Lauchlan Ave, Meyrick Park, Harare, Zimbabwe (rntozini@ zvitambo.co.zw).
Clinical Infectious Diseases®
2015;61(S7):S716–25
© The Author 2015. Published by Oxford University Press for the Infectious Diseases Society of America. This is an Open Access article distributed under the terms of the Creative Commons Attribution License (http://creativecommons.org/licenses/by/4.0/), which permits unrestricted reuse, distribution, and reproduction in any medium, provided the original work is properly cited.
goals for“access to water” will likely include equity at the indi-vidual, household, or village level; microbial water quality; and infrastructure functionality [8]. In line with this shift, tools to measure and interpret these metrics will be required.
BACKGROUND
The Sanitation Hygiene Infant Nutrition Efficacy (SHINE) trial is a cluster-randomized trial testing the independent and com-bined effects of improved water, sanitation, and hygiene (WASH) and improved infant feeding on child stunting and anemia at 18 months of age [9]. SHINE is motivated by the pre-mise that environmental enteric dysfunction (EED) is a major underlying cause of stunting and anemia and that EED is pri-marily caused by infant ingestion of fecal microbes due to living in conditions of poor WASH. The SHINE WASH intervention includes provision of a ventilated improved pit latrine, Tippy Tap handwashing facilities and soap, a protected play space, point-of-use water chlorination solution, and behavior change communication to promote optimal WASH practices [10]. Notably, the intervention does not include a water access com-ponent. Because baseline water and sanitation access are both likely to affect uptake of the WASH interventions and trial outcomes through multiple pathways, we wanted to optimize balance of these parameters across treatment groups at the start of the trial. This required up-to-date cluster-specific esti-mates of water and sanitation coverage. The last comprehensive water and sanitation surveys in Zimbabwe had been conducted in 2004 and 2006, respectively [11]; neither provided data at the cluster level. Thus, we undertook the surveys described in this article to estimate cluster-specific water access and sanitation coverage to inform random allocation of clusters to treatment arms, thereby optimizing balance on these factors across arms. MATERIALS AND METHODS
Digital Mapping of Study Site and Administrative Boundaries
The SHINE study site is comprised of the 2 adjacent Chiruman-zu and Shurugwi districts, located in central Zimbabwe, with land areas of 4761 km2 and 3471 km2 and populations of 77570 and 80351, respectively [12] (seeFigure 1 in Supplemen-tary Appendix). Digital vector maps of administrative boundar-ies for the 2 districts were obtained from the Department of the Surveyor General [13] and Zimbabwe Statistics [14] as shape files [15], saved in the Universal Transverse Mercator projection datum WGS84 zone 35S [16].
Data Collection
Mapping of Households
In November–December 2010, Google Earth (Google, Moun-tain View, California) was used to identify the coordinates
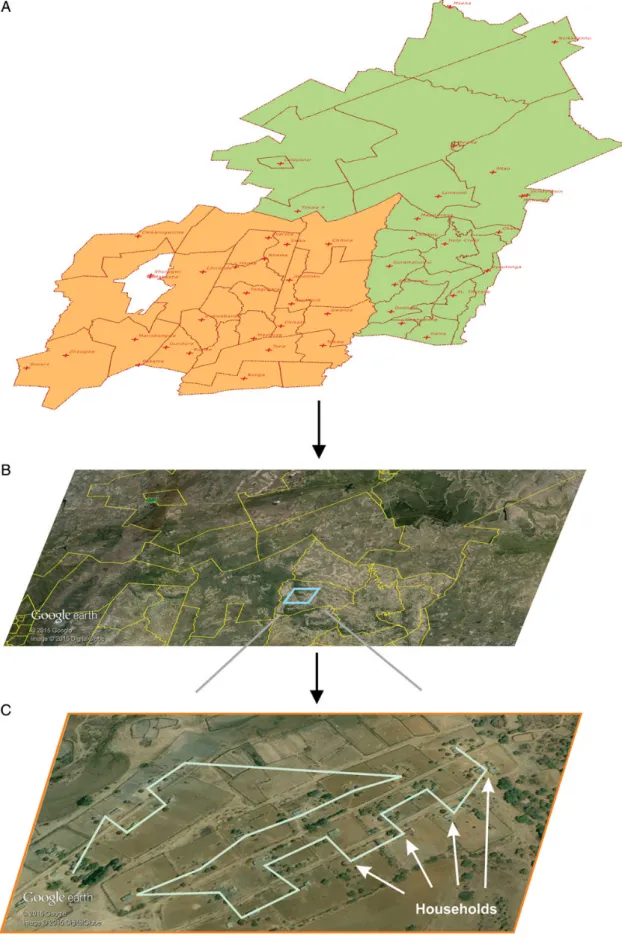
(longitude, latitude, and elevation) of all households and key landmarks (roads, clinics, schools, rivers) and build a georefer-enced household/key landmark dataset (Figure1):
1. The digital district boundaries map was overlaid on Google Earth imagery to identify the study area. Within the study area, settlements identified as urban (having sewage con-nection and or piped water) or institutions were excluded from the study population and not mapped.
2. In Zimbabwe, rural households are generally comprised of a clearly demarcated plot of land with either one round or rect-angular building or a grouping of several buildings each used for a different function (sleeping, cooking, storage, etc). Groups of households were mapped using the Google Earth“ADD PATH” tool by drawing a polyline where each vertex represented the center point of a household.
3. The polylines were exported from Google Earth as KML files (Open Geospatial Consortium 2012). Coordinates of each vertex (household) were extracted from the KMLfiles into a da-taset and assigned a unique identifier using a custom developed program. The georeferenced dataset of households and key landmarks was imported into QGIS version 2.6.1 (Open Source Geospatial Foundation, Arizona). The position accuracy of co-ordinates obtained by this method is comparable to that of land survey methods [17].
Mapping of Water Points
A desk study of available documents and organization docu-ments (District Development Fund, Ministry of Health and Child Care [MoHCC], United Nations agencies, nongovern-mental organizations, and district local authorities) was con-ducted to estimate the number and type of known water points in the study area to plan the survey. All water sources were physically inspected between January and June 2011. Four district water engineers assessed boreholes and deep wells while 22 MoHCC environmental health technicians (EHTs) assessed all other water points. At each water point, 2–4 key informants (pump minders, water committee mem-bers, village health workers, ward councilors, district mainte-nance officers, school heads, and village headmen) were interviewed. The data were collected electronically using per-sonal digital assistants (model HP iPAQ 211, Hewlett-Packard, Palo Alto, California) paired with geographic positioning sys-tem (GPS) receivers (model BT-386i GPS Bluetooth, Globalsat, New Taipei City, Taiwan). The data acquisition program was developed using CyberTracker version 3.0 (CyberTracker, Cape Town, South Africa), which integrates GPS data with other captured data. Questionnaires were based on World Health Organization (WHO)/United Nations Children’s Fund (UNICEF) guidelines [18] for water and sanitation house-hold surveys, adapted in consultation with local water and san-itation experts, and pilot-tested in a neighboring rural district
Figure 1. Households in the 2 districts were mapped by obtaining shapefiles for administrative boundaries (A), overlaying administrative boundaries on Google Earth imagery (B), and visually identifying and recording households using the ADD PATH tool in Google Earth (C). The jagged line in (C) is produced by the ADD PATH tool after sequentially selecting multiple households.
(Table 1 in Supplementary Appendix). The water-point dataset was exported from CyberTracker into a spreadsheet where each water point was assigned a unique identifier; thereafter, the georeferenced dataset was exported to QGIS for spatial analysis.
Formation of SHINE Clusters (Randomization Unit)
The study area was divided into 212 clusters, defined as the catchment area of 1–4 MoHCC village health workers (VHWs). Large-scale maps were produced by integrating the household/ key landmark dataset with the district boundary dataset as geo-graphic information system (GIS) layers. Each of the 360 VHWs circled the households they serve, creating a cluster boundary. Cluster-specific numbers of households, reproductive-aged women, and <2-year-old children were gathered from VHW registers. Cluster boundaries werefinalized by grouping up to 4 if (1) they were working habitually as a team and (2) their catchment areas largely comprised households within close proximity (Figure 2 in Supplementary Appendix). A final cluster/household dataset was produced assigning a unique identifier to each cluster and a cluster identifier to each household.
Sanitation Survey
A random sample of 2756 households was selected, 13 from each of the 212 clusters, using the cluster/household dataset as the sampling frame. EHTs visited each selected household between January and March 2012, guided by the GPS location (Table 2 in Supplementary Appendix). If >1 household was found near the GPS location, one was chosen using a random number generator. Similar to the water-point survey, data were collected on personal digital assistants loaded with a sanitation survey based on WHO/UNICEF [18] guidance. Data were exported to QGIS for spatial analysis.
Data Analysis
Spatial analysis and rendering of maps was performed using QGIS, and statistical analyses were performed using Stata/SE software version 13 (StataCorp, College Station, Texas). Water Coverage
Water points were categorized using several definitions, but for the purposes of the constrained randomization, we considered only those that were fully functional, perennial, protected, and had unrestricted public access (defined as “optimal water source”). Nearest-neighbor analysis was used to calculate the shortest geographic distance from each household to the nearest water point; using the “DISTANCE MATRIX” function, the household/key landmark GIS layer was used as the input vector layer and the water-point GIS layer as the target in the compu-tations, and results were exported for analyses using statistical software. Three cluster-specific metrics were used to constrain
randomization of the clusters: median (interquartile range [IQR]) distance of all households to the nearest optimal water source, and proportion (95% confidence interval [CI]) of house-holds <500 m or >1500 m from an improved water source. Het-erogeneity of water access among the clusters was assessed using the intraclass correlation computed using the distance to water points [19]. To visualize coverage area of each water point, a buffer around each water point at 2 radiuses (500 m and 1500 m) was created and displayed on the maps.
Sanitation Coverage
Sanitation coverage was defined 3 ways for constrained random-ization: the proportion of households per cluster with (1) any latrine, (2) a latrine less than half full, and (3) a latrine less than half full and a handwashing facility.
Ethical Approval
The study was approved by the Medical Research Council of Zimbabwe, the Research Institute of McGill University Health Centre, and the Johns Hopkins Bloomberg School of Public Health. Verbal assent was obtained from a household adult prior to household latrine inspection.
RESULTS
Household Mapping
We identified 32 927 georeferenced households across the 2 districts: 16 313 in Chirumanzu and 16 614 in Shurugwi. Spa-tial distribution of the population (Figure 3 in Supplementary Appendix) illustrates 2 distinct settlement patterns: (1) dense settlements in older communal areas established during the colonial era, and (2) clustered settlements in newer resettle-ment areas established following independence in 1980. Ap-plying average household size in each district according to the 2012 census, 32 927 households correspond to an estimat-ed population of 133 484 (84.5% of the population reportestimat-ed in the 2012 census for both districts) [12]. The remaining 15.5% of the population is likely accounted for by exclusion of urban and growth point settlements (also excluded from the SHINE trial), and areas that did not have clear satellite imagery to identify households.
Water-Point Mapping
A total of 8388 water points were mapped and characterized; this was approximately 50% more than those initially identified by key informants before the beginning of the survey. Our method of sourcing all water-point information from 2–4 key informants from the community likely yielded a complete count (census) of water points. Of the water points, 75% were shallow wells. Most water points had a bucket water removal system, were protected, and were publicly accessible, but only
60% were perennial (Table 3 in Supplementary Appendix).The spatial distribution of the 7906 (97.2%) functional water points is shown inFigure 4 of the Supplementary Appendix.
Water Coverage
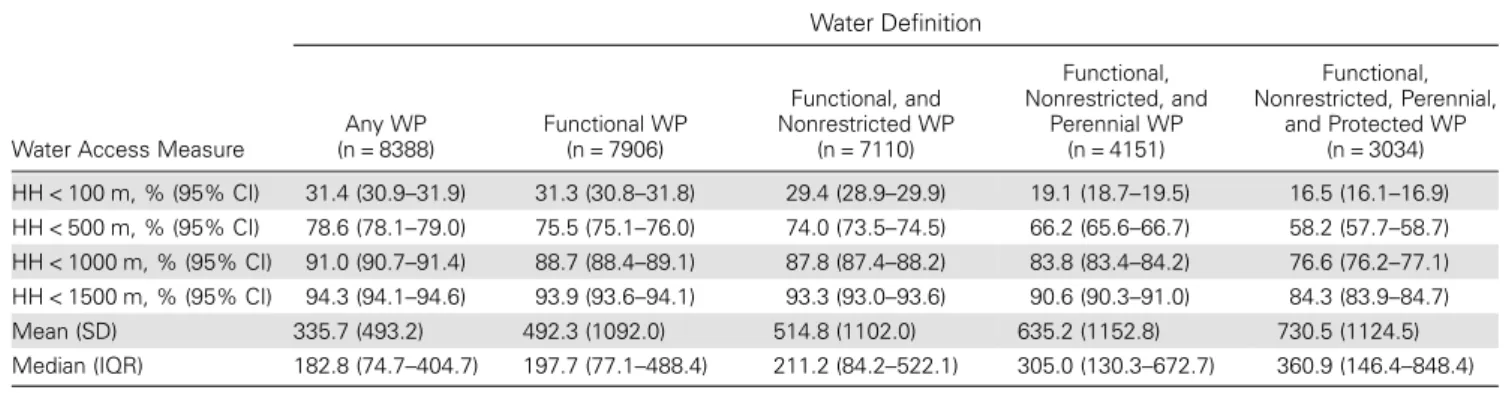
Across the SHINE study area, the median distance between households and any source of water was 182.8 m (IQR, 74.7– 404.7 m), and 31.4%, 78.6%, and 94.3% of households were within 100 m, 500 m, and 1500 m, respectively. When consid-ering only“optimal” water points, these respective values were 360.9 m (IQR, 146.4–848.4 m), and 16.5%, 58.2%, and 84.3%. Further estimates based on various definitions combining func-tionality, restricted use, protection, and seasonality are summa-rized in Table1. Thus, access to water was highly variable and skewed to high across the 33 000 households (Figure2A).
Ac-cess to water at the cluster level was similarly variable (intraclass correlation for distance to water point was 0.738;P < .0001) and skewed (Figure2B). Across the 212 clusters, the median
dis-tance of households within a cluster to optimal water ranged from 34.0 m (IQR, 18.2–68.1 m) for the cluster with best water
access to 5556 m (IQR, 4804–6964 m) for the cluster with the worst water access; the proportion of clusters with a median dis-tance to optimal water <100 m, <500 m, and >1500 m was 19.0%, 80.5%, and 93.5%, respectively. Maps depicting spatial water coverage were created (Figure3).
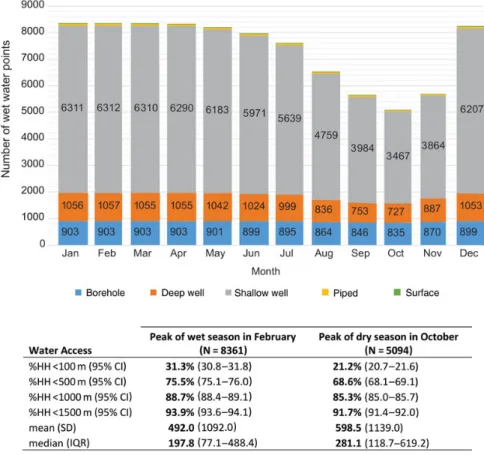
Seasonal Variation in Water Coverage
Seasonality was the most prevalent factor limiting water sources from being considered optimal. The number of water points with water ranged from 5094 in October to 8361 in February, bracketing the annual rainy season. The proportion of house-holds with access to a water point with water within 100 m, <500 m, and >1500 m was 31.3% (95% CI, 30.8%–31.8%), 75.5% (95% CI, 75.1%–76.0%), and 93.9% (95% CI, 93.6%– 94.1%), respectively, in February. In October, these relative values were 21.2% (95% CI, 20.7%–21.6%), 68.6% (95% CI, 68.1%–69.1%), and 91.7% (95% CI, 91.4%–92.0%), respectively. The predominant water-point type for households with water within <100 m was shallow wells, which were also the type most affected by seasonality, dropping by 45% between February and
Table 1. Summary of Water Access Using Various Definitions of Water
Water Access Measure
Water Definition Any WP (n = 8388) Functional WP (n = 7906) Functional, and Nonrestricted WP (n = 7110) Functional, Nonrestricted, and Perennial WP (n = 4151) Functional, Nonrestricted, Perennial, and Protected WP (n = 3034) HH < 100 m, % (95% CI) 31.4 (30.9–31.9) 31.3 (30.8–31.8) 29.4 (28.9–29.9) 19.1 (18.7–19.5) 16.5 (16.1–16.9) HH < 500 m, % (95% CI) 78.6 (78.1–79.0) 75.5 (75.1–76.0) 74.0 (73.5–74.5) 66.2 (65.6–66.7) 58.2 (57.7–58.7) HH < 1000 m, % (95% CI) 91.0 (90.7–91.4) 88.7 (88.4–89.1) 87.8 (87.4–88.2) 83.8 (83.4–84.2) 76.6 (76.2–77.1) HH < 1500 m, % (95% CI) 94.3 (94.1–94.6) 93.9 (93.6–94.1) 93.3 (93.0–93.6) 90.6 (90.3–91.0) 84.3 (83.9–84.7) Mean (SD) 335.7 (493.2) 492.3 (1092.0) 514.8 (1102.0) 635.2 (1152.8) 730.5 (1124.5) Median (IQR) 182.8 (74.7–404.7) 197.7 (77.1–488.4) 211.2 (84.2–522.1) 305.0 (130.3–672.7) 360.9 (146.4–848.4)
Abbreviations: CI, confidence interval; HH, household; IQR, interquartile range; SD, standard deviation; WP, water point.
Figure 2. Distribution of distance from household to closest water point across the Sanitation Hygiene Infant Nutrition Efficacy study area (A), and the median distance within clusters (B).
October. Figure 4shows the trend of available water sources over a calendar year.
Sanitation Coverage
A total of 2560 households (92.9% response rate) were assessed for sanitation coverage. Of these, 1148 (44.8%) had a latrine of any type, but 373 (32.5%) of these were full and no longer in use, resulting in a net sanitation coverage of 30.3% (775/ 2560). Moreover, of these 775, only 133 (12%) had a ventilation pipefitted that passed the ventilation test and had a fly screen. Only 75 latrines had handwashing facilities, and only 20 had water and 1 had soap. In 9 (0.8%) latrines, there was evidence the latrine was being used for storage or for a purpose other than urination or defecation. Sanitation coverage at the cluster level ranged widely; in the cluster with the poorest and best san-itation coverage, 7.7% and 92.3%, respectively, of the house-holds had a latrine of any type.
DISCUSSION
The primary purpose of this study was to constrain randomized allocation of clusters to treatment groups to ensure balance in
water access and sanitation coverage across treatment groups. The high variability between clusters in both water access (Figure5) and sanitation suggests that constraining on these factors was prudent in reducing risk of bias from imbalances across groups.
For most households in the SHINE study area, access to water represents a daily hardship: 16.5%, 58.2%, and 15.5% of the 32 927 households were <100 m, <500 m, and >1500 m, re-spectively, from the nearest optimal (ie, functioning, protected, publicly accessible, perennial) source of water; the median household was 361 m, or an approximately 11-minute one-way walk time, from such a water point. The Water Use Plateau describes the relationship between distance traveled to a source and volume of water consumed, with a rapid decline in con-sumption when distance exceeds 100 m (approximately a 3-minute one-way walk time) [20]. Bartram et al [7] estimate that where a water source is >1000 m (>15-minute one-way walk time), water volumes accessed are too little to support hy-dration or hygiene requirements and are thus associated with higher risk of adverse health consequences. Furthermore, they report that a basic water service level (within 100–1000 m) sup-ports hydration but not optimal hygiene and is similarly asso-ciated with higher risk of poor health. Only when water is
Figure 3. Spatial water coverage by functional, protected, perennial, and unrestricted water points across the Sanitation Hygiene Infant Nutrition Efficacy study area. The insert shows households that fall into the 3 regions: within <500 m, <1500 m, and >1500 m of a water point.
Figure 4. Seasonal variation of available functional water points showing water coverage during the wet and dry seasons. Abbreviations: CI, confidence interval; HH, household; IQR, interquartile range; SD, standard deviation.
Figure 5. The proportion of the population covered by functional, protected, perennial, and unrestricted water points as distance from the water point changes.
provided on-plot (within 100 m or <3 minutes) did consump-tion reach levels associated with lower risk of adverse health consequences.
In a large-scale empirical study, Pickering and Davis [21] used Demographic Health Survey data from 26 countries to model the effect of water collection time on child health. Each 15-minute reduction in one-way walk time to water was asso-ciated with substantial reductions in child morbidity and mortality, and, of most relevance to SHINE, increased linear growth. Consistent with previous studies, the child health effect of water access was modified by sanitation: Health impacts were greater among children in households with sanitation compared with those practicing open defecation. Moreover, even when households with an on-plot water source were excluded, the walk-time health effect decreased only slightly, suggesting that relative distance to off-site water remains strongly related to child health [21]. The authors suggested that the observed ad-verse effects of longer walk times might be mediated by reduced volumes available for hygiene, prolonged drinking water stor-age, less capacity for home gardening, and less maternal time for child care and income generation [21,22].
Seasonality in water access was also highly variable; from the end of the wet season to the end of the dry season, the number of water points with water declined by 39%. Thus, when infants age into particular vulnerable periods season may confound outcomes in the trial and/or modify intervention effects.
Less than half of the households (45%) had a latrine and 34% of these were full and no longer in use, such that net sanitation coverage was 30%. However, virtually none of the latrines were
being used for any purpose other than urination, defecation, and bathing. This is consistent with previous formative studies that revealed that having a latrine and using it for sanitation is highly valued in this population [10].
This study makes several methodological contributions to the growing area of water-point and sanitation service mapping. First, using a set of free and low-cost tools, we developed an in-tegrated system for estimating the geospatial distribution of households, water sources, and sanitation facilities and compu-tation of distance-based metrics for physical access to water re-sources. Several other open-source platforms are available to map water points (eg, Water Point Mapper, Field Level Opera-tions Watch [FLOW], and WASHTech), but none has the tech-nical capacity to integrate household coordinates. These other platforms rely on census data to gauge access to water and san-itation, and the averaged estimates lack the necessary resolution to reveal spatial trends that are critical for planning future in-vestments. The household-based strategy represents a particular improvement where populations are dispersed unequally and water is scarce.
Second, this study extends the literature on water and sani-tation mapping by demonstrating how mapping efforts can be fully integrated within existing institutions. Data collection at the household and community level was accomplished through close collaboration with personnel in the MoHCC. EHTs’ routine visits to rural wards provided the access to and knowledge of rural wards throughout the 2 study districts. Service providers are increasingly recognizing the importance of obtaining accurate and accessible geospatial data for
Figure 6. Modeling the cost of improving water coverage by mixing rehabilitation of broken boreholes and drilling for replacement boreholes based on fixed cost estimates for replacement and rehabilitation.
strategic planning and monitoring of water and sanitation pro-grams [23,24].
Third, the approach taken in this study may be especially sa-lient in the post-2015 development period, when definitions of access are likely to include aspects of equity, microbial water quality, and infrastructure functionality [8].
Fourth, this methodology reveals patterns and trends that may be obscured in regional- or national-level assessments. For example, it is possible to use spatial statistics to identify clusters of households where sanitation access is limited or to investigate key covariates of water-point functionality, such as proximity to roads or access to spare parts ( for repair and maintenance).
Finally, household-based geospatial data on water-point in-frastructure characteristics can be used to plan strategic invest-ments in their maintenance and upgrades. For example, using the functionality and location for each water point, we modeled the incremental proportion of the population with access to water for each additional dollar spent (Figure6). This model re-veals the most cost-effective mix of repair work and new con-struction to gain the greatest increases in the proportion of the population with water access.
There were 2 main limitations to our study. Google Earth may miss some households when the program is out of date, cloud coverage obscures imagery, or 2 households are close to-gether and appear as one. These limitations can be reduced by requesting EHTs to“ground-truth” data during their routine visits to communities, and override household geospatial data. EHTs can also be trained to routinely update the database with changes in water-point functionality, access, or protection. A second limitation is that the methodology depends on a geo-graphic distance–based measure for access which fails to ac-count for topography or social drivers of a household’s access to water.
CONCLUSIONS
In this context, the observed high variability in water and san-itation access between clusters confirms that the SHINE approach of constraining on these factors during cluster ran-domization was needed to reduce risk of bias. Linking the water-point data with SHINE participants will help to under-stand heterogeneity in WASH practices and child health out-comes [25]. The methods described in this article also have wider applications and utility, as they can be used to provide ac-curate estimates of geospatial distribution of water and sanita-tion facilities and computasanita-tion of distance-based metrics for physical access to water resources. These metrics are essential for the epidemiological study of child health and also in plan-ning, monitoring, and evaluating water and sanitation supply programs.
Supplementary Data
Supplementary materialsare available atClinical Infectious Diseases online (http://cid.oxfordjournals.org). Supplementary materials consist of data provided by the author that are published to benefit the reader. The posted materials are not copyedited. The contents of all supplementary data are the sole responsibility of the authors. Questions or messages regarding errors should be addressed to the author.
Notes
Acknowledgments. We thank the participants in the Sanitation Hygiene Infant Nutrition Efficacy (SHINE) trial and the community lead-ership and members of Chirumanzu and Shurugwi districts, Zimbabwe. The authors gratefully acknowledge Bernard Chasekwa, William Helyar, Simon Phiri, Alford Garikai, Kwanai Meki, Norbert Chimucheka, Antonella Mapuranga, Nokuthula Hoko-Sibanda, Vimbai F. Chikwavaire, the Envi-ronmental Health Technicians, and District Development Fund engineers for their roles in the oversight and implementation offield work, and Virginia Sauramba for her role in the preparation of this manuscript.
Financial support. The SHINE trial is funded by the Bill & Melinda Gates Foundation (OPP1021542); Department for International Development, UK; Wellcome Trust, UK (093768/Z/10/Z); Swiss Agency for Development and Cooperation; US National Institutes of Health (2R01HD060338-06); and the European Union.
Supplement sponsorship. This article appeared as part of the supple-ment“The Sanitation Hygiene Infant Nutrition Efficacy (SHINE) Trial,” sponsored by the Zvitambo Institute for Maternal and Child Health Research.
Potential conflicts of interest. All authors: No reported conflicts. All authors have submitted the ICMJE Form for Disclosure of Potential Conflicts of Interest. Conflicts that the editors consider relevant to the con-tent of the manuscript have been disclosed.
References
1. United Nations. The human right to water and sanitation. New York: UN General Assemly, 2010. Available at:http://daccess-dds-ny.un.org/doc/ UNDOC/GEN/N09/479/35/PDF/N0947935.pdf?OpenElement. Accessed 3 October 2015.
2. United Nations. Human rights and access to safe drinking water and sanitation; Human Rights Council. New York: United Nations, 2011. Available at:http://daccess-dds-ny.un.org/doc/RESOLUTION/GEN/ G11/124/85/PDF/G1112485.pdf?OpenElement. Accessed 3 October 2015.
3. Jeuland MA, Fuente DE, Ozdemir S, Allaire MC, Whittington D. The long-term dynamics of mortality benefits from improved water and sanitation in less developed countries. PLoS One 2013; 8.
4. Cheng JJ, Schuster-Wallace CJ, Watt S, Newbold BK, Mente A. An ecological quantification of the relationships between water, sanitation and infant, child, and maternal mortality. Environ Health 2012; 11: 1–8.
5. World Health Organization. WHO/UNICEF joint monitoring pro-gramme. Geneva, Switzerland: WHO, 2015. Available at:http://www. wssinfo.org/. Accessed 3 October 2015.
6. Kayser GL, Moriarty P, Fonseca C, Bartram J. Domestic water service de-livery indicators and frameworks for monitoring, evaluation, policy and planning: a review. Int J Environ Res Public Health 2013; 10:4812–35. 7. Bartram J, Brocklehurst C, Fisher MB, et al. Global monitoring of water
supply and sanitation: history, methods and future challenges. Int J En-viron Res Public Health 2014; 11:8137–65.
8. United Nations. Open working group proposal for sustainable develop-ment goal. Geneva, Switzerland: UN, 2015. Available at: http://undocs. org/A/68/970. Accessed 3 October 2015.
9. The Sanitation Hygiene Infant Nutrition Efficacy (SHINE) Trial Team. The Sanitation Hygiene Infant Nutrition Efficacy (SHINE) trial:
rationale, design, and methods. Clin Infect Dis 2015; 61(suppl 7): S685–702.
10. Mbuya MNN, Tavengwa NV, Stoltzfus RJ, et al. Design of an interven-tion to minimize ingesinterven-tion of fecal microbes by young children in rural Zimbabwe. Clin Infect Dis 2015; 61(suppl 7):S703–9.
11. United Nations Children’s Fund & National Action Committee Rural Water Supply and Sanitation. WASH inventory ATLAS Zimbabwe: inventory of the national rural water supply and sanitation facilities. Harare: UNICEF, 2006.
12. Zimbabwe National Statistics Agency. Census 2012: Provincial Report Midlands, Harare: ZIMSTAT, 2013.
13. Department of the Surveyor General, Zimbabwe. Cartography: Zimba-bwe districts map. Harare: DSG, 2015.
14. Zimbabwe National Statistics Agency. Census 2012: Census Enumera-tion Areas Map. Harare: ZIMSTAT, 2012.
15. Environmental Systems Research Institute. Shapefile technical descrip-tion: an ESRI white paper - July 1998. Redlands, CA: ESRI, 1998. Avail-able at:https://www.esri.com/library/whitepapers/pdfs/shapefile.pdf. Accessed 3 October 2015.
16. Snyder JP. Map projections–a working manual. Vol 1395. US Govern-ment Printing Office, 1987. Available at:http://pubs.usgs.gov/pp/1395/ report.pdf. Accessed 3 October 2015.
17. Mohammed NZ, Ghazi A, Mustafa HE. Positional accuracy testing of Google Earth. Int J Multidisciplinary Sci Eng 2013; 4:6.
18. United Nations Children’s Fund/World Health Organization. Rapid assessment of drinking water quality: A Handbook for Implementation. Geneva, Switzerland: WHO, 2012. Available at:http://www.who.int/ water_sanitation_health/publications/2012/rapid_assessment/en/. Ac-cessed 3 October 2015.
19. Hayes RJ, Moulton LH. Cluster randomised trials. Boca Raton, FL: Chapman & Hall/CRC, 2009.
20. Cairncross S, Feachem R. Environmental health engineering in the tropics: an introductory text. 2nd ed. John Wiley & Sons Ltd. Chiches-ter, UK, 1993.
21. Pickering AJ, Davis J. Freshwater availability and water fetching distance affect child health in sub-Saharan Africa. Environ Sci Technol 2012; 46:2391–7.
22. Sorenson SB, Morssink C, Campos PA. Safe accessto safewater in low income countries: water fetching in current times. Soc Sci Med 2011; 72:1522–6. 23. Gloeckner H, Mkanga M, Ndezi T. Local empowerment through
com-munity mapping for water and sanitation in Dar es Salaam. Environ Urban 2004; 16:185–98.
24. Jiménez A, Pérez-Foguet A. Challenges for water governance in rural water supply: lessons learned from Tanzania. Water Resource Dev 2010; 26:235–48.
25. Mbuya MNN, Jones AD, Ntozini R, et al. Theory-driven process eval-uation of the SHINE trial using a program impact pathway approach. Clin Infect Dis 2015; 61(suppl 7):S752–8.