Systematic Review
A systematic review of vitamin D status in populations worldwide
Jennifer Hilger
1, Angelika Friedel
2, Raphael Herr
1, Tamara Rausch
1, Franz Roos
2,
Denys A. Wahl
3, Dominique D. Pierroz
3, Peter Weber
2and Kristina Hoffmann
1*
1
Mannheim Institute of Public Health, Social and Preventive Medicine, Medical Faculty Mannheim,
Heidelberg University, Ludolf-Krehl-Strasse 7-11, D-68167 Mannheim, Germany
2
DSM Nutritional Products Limited, Kaiseraugst, Switzerland
3
International Osteoporosis Foundation, 1260 Nyon, Switzerland
(Submitted 12 July 2012 – Final revision received 8 March 2013 – Accepted 7 May 2013 – First published online 9 August 2013)
Abstract
Vitamin D deficiency is associated with osteoporosis and is thought to increase the risk of cancer and CVD. Despite these numerous poten-tial health effects, data on vitamin D status at the population level and within key subgroups are limited. The aims of the present study were to examine patterns of 25-hydroxyvitamin D (25(OH)D) levels worldwide and to assess differences by age, sex and region. In a systematic literature review using the Medline and EMBASE databases, we identified 195 studies conducted in forty-four countries involving more than 168 000 participants. Mean population-level 25(OH)D values varied considerably across the studies (range 4·9 – 136·2 nmol/l), with 37·3 % of the studies reporting mean values below 50 nmol/l. The highest 25(OH)D values were observed in North America. Although age-related differences were observed in the Asia/Pacific and Middle East/Africa regions, they were not observed elsewhere and sex-related differences were not observed in any region. Substantial heterogeneity between the studies precluded drawing conclusions on overall vitamin D status at the population level. Exploratory analyses, however, suggested that newborns and institutionalised elderly from several regions world-wide appeared to be at a generally higher risk of exhibiting lower 25(OH)D values. Substantial details on worldworld-wide patterns of vitamin D status at the population level and within key subgroups are needed to inform public health policy development to reduce risk for potential health consequences of an inadequate vitamin D status.
Key words:Vitamin D: Populations: Public health
Vitamin D plays an important role in bone mineralisation and other metabolic processes in the human body such as Ca and phosphate homeostasis and skeletal growth(1,2). Vitamin D deficiency, for example, causes rickets in children, leading to skeletal abnormalities, short stature, delayed development or failure to thrive(3). In adults, low values of vitamin D are associated with osteomalacia, osteopenia, osteoporosis and subsequent risk of fractures(1). In addition to beneficial effects on musculoskeletal health, observational studies have suggested that low 25-hydroxyvitamin D (25(OH)D) values are associated with an increased risk for several extra-skeletal diseases including cancer, infections, autoimmune diseases and CVD(4). In light of the global ageing population(5), an almost fourfold increase in osteoporotic hip fractures
since 1990(6) and the possible risk of other chronic diseases, patterns of low 25(OH)D levels are of substantial public health interest.
Vitamin D status is traditionally measured through assays of 25(OH)D, the major circulating form of vitamin D(7). Although 25(OH)D levels below 25 nmol/l have been associated with disorders of bone metabolism(8)and are used to indicate severe vitamin D deficiency, the threshold for defining adequate stores of vitamin D in humans has not been established clearly(9). The Institute of Medicine has suggested, for example, that approximately 97·5 % of the population across all age groups meet their requirements for vitamin D, having serum 25(OH)D values higher than 50 nmol/l(10). However, others consider 25(OH)D values of 75 nmol/l or higher to be adequate(11,12).
* Corresponding author: Dr K. Hoffmann, fax þ 49 621 383 9920, email [email protected] Abbreviation: 25(OH)D, 25-hydroxyvitamin D.
British Journal of Nutrition (2014), 111, 23–45 doi:10.1017/S0007114513001840
qThe Authors 2013
British
Journal
of
Nutrition
https:/www.cambridge.org/core/terms. https://doi.org/10.1017/S0007114513001840Given the absence of uniformly accepted definitions, previous reviews have reported substantial variations in the prevalence of vitamin D deficiency across countries throughout the world, with estimates ranging from 2 to 90 % depending on the cut-off value and study population selected(8,13 – 16). Insights from these earlier studies are limited, however, due to a focus on specific geographical regions, age or risk groups. Moreover, use of a binary approach to define the presence of vitamin D deficiency in some studies might have also obscured important relationships with chronic dis-ease that might exist across a broader spectrum of values.
To provide a basis for future efforts to limit the health consequences of vitamin D deficiency and insufficiency worldwide, we conducted a systematic literature review of studies performed worldwide using continuous values for 25(OH)D to enable comparisons across studies and between different subgroups within the population. The specific objective of the present study, therefore, was to assess vitamin D status across a range of values at the population level and within key population subgroups defined by age, sex and region.
Methods
Literature search
We searched the Medline and EMBASE databases for original articles on vitamin D status in the general population. Keywords were chosen from the Medical Subject Headings terms and the EMTREE thesaurus, respectively, using the following search strategy: (vitamin D/D3 OR 25-hydroxyvitamin D/D3 OR 25(OH)D/D3 OR calcidiol) AND (epidemiologic studies OR population-based OR population OR survey OR representative OR cross-sectional OR observational) NOT (dihydroxycholecal-ciferols OR case reports OR case – control studies OR clinical trials OR reviews) AND humans. Search terms for vitamin D included the controlled term ‘vitamin D’ (including calcifediol and 25-hydroxycholecalciferol) and several free-text terms taking different notations of 25(OH)D into account.
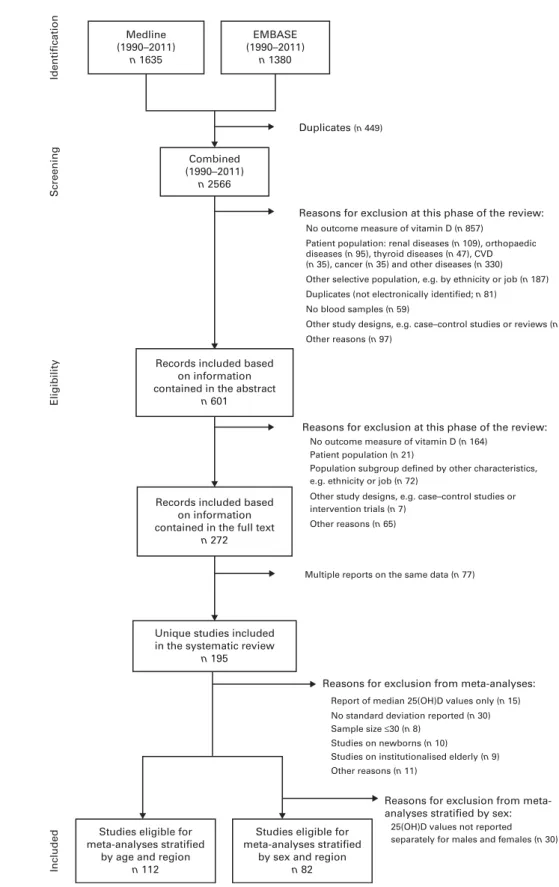
Articles published in English between 1 January 1990 and 28 February 2011 (date of the final screen) were considered. We excluded articles published before 1990 because of a general shift in lifestyle, particularly in industrialised nations (e.g. spending less time outdoors), that might have affected mean population-level 25(OH)D values(17). The final screen produced 2566 hits from both databases after excluding 449 exact duplicates identified using EndNote X6 (Thomson Reuters). Wherever possible, the methods used in the present review follow the Preferred Reporting Items for Systematic Reviews and Meta-Analyses (PRISMA) statement(18).
Study selection
Studies were included in the present review if they met the following criteria defined a priori: (1) outcomes – report of mean or median plasma level for 25(OH)D; (2) study participants – randomly selected samples from the general population as well as subgroups defined by age, sex and specific areas within a country; (3) study designs – cross-sectional
studies or baseline data from population-based cohorts. Studies were excluded if vitamin D status was estimated (e.g. through self-reported nutritional intake) or if data were available only on vitamin D2. We also did not consider studies using a binary indicator for vitamin D deficiency or insuffi-ciency as the sole outcome measure, given differing thresholds used in the literature to define either state(5). Fur-thermore, clinical samples or studies restricted to subgroups with specific characteristics (e.g. ethnicity, job and skin colour) were excluded, as they were not randomly selected from the general population.
All studies were independently screened and evaluated for selection by two of the authors (R. H. and A. F.). Inter-rater agree-ment was good to moderate, and disagreeagree-ments were discussed and resolved by consensus in each case (abstract selection: k ¼ 0·719; full-text selection: k ¼ 0·544). Following the appli-cation of exclusion criteria to information contained in the study abstract, we reduced the 2566 screened records to 601 (Fig. 1); application of these criteria following review of each full-text article reduced the pool of potentially eligible articles to 272. Given the presence of multiple reports based on the same data, our final analytical sample comprised 195 unique studies. In sev-eral instances, multiple articles from single studies were retained for analysis as they provided separate 25(OH)D values for sub-groups with the characteristics of interest (age, sex and region).
Data extraction, data elements and quality assessment
Each study was evaluated using a standardised data extraction form. In each case, we assessed a wide range of variables including vitamin D values, assays used and study character-istics as well as charactercharacter-istics of the study population and method of recruitment. Data from most studies were rep-resented in the dataset by a single entry for the total study population. Multiple subentries for a single study were included if data were presented by age, sex or region. All 25(OH)D values were expressed in nmol/l, following conver-sion from ng/ml (multiplied by a factor of 2·496) as necessary. Based on the WHO recommendations, we classified geographi-cal regions as follows: Latin America; North America; Europe; Asia/ Pacific; Middle East/Africa(19). To determine age-related differ-ences, we defined four age groups: newborns/infants (0–1 years); children/adolescents (.1–17 years); adults (.17–65 years); elderly (.65 years). In instances where details about age were not provided, we created a separate category (‘other’). Where possible, we also distinguished elderly living in nursing homes (institutionalised elderly) from those living in the community.We assessed study quality using data reported in each study on representativeness, validity and reliability. A study was considered representative if (1) this feature of the study was explicitly addressed in the corresponding full-text article or (2) any statement made by the authors suggested that the actual sample reflected the target population. A study was classified as non-representative if the corresponding full-text article contained information about an existing selection bias, which might also occur in a randomly selected sample (e.g. overestimation of females). Measurement validity was J. Hilger et al. 24
British
Journal
of
Nutrition
https:/www.cambridge.org/core/terms. https://doi.org/10.1017/S0007114513001840evaluated using information about the 25(OH)D measure (e.g. participation of the laboratory in the International Vitamin D Quality Assessment Scheme)(20). Finally, a study was classified as reliable if the intra- and inter-assay coefficients of variation
were below 10 and 15 %, respectively. In instances where details about representativeness, validity or reliability were not provided, we created a separate category (‘unknown’) for each quality criterion.
Medline (1990–2011) n 1635 Identification Screening Eligibility Included EMBASE (1990–2011) n 1380 Combined (1990–2011) n 2566
Records included based on information contained in the abstract
n 601
Records included based on information contained in the full text
n 272
Unique studies included in the systematic review
n 195
Studies eligible for meta-analyses stratified
by age and region
n 112
Studies eligible for meta-analyses stratified
by sex and region
n 82
Duplicates (n 449)
Reasons for exclusion at this phase of the review:
Reasons for exclusion at this phase of the review:
Reasons for exclusion from meta-analyses:
Reasons for exclusion from meta-analyses stratified by sex:
No outcome measure of vitamin D (n 857)
Patient population: renal diseases (n 109), orthopaedic diseases (n 95), thyroid diseases (n 47), CVD (n 35), cancer (n 35) and other diseases (n 330) Other selective population, e.g. by ethnicity or job (n 187) Duplicates (not electronically identified; n 81)
No blood samples (n 59)
Other study designs, e.g. case–control studies or reviews (n 33) Other reasons (n 97)
No outcome measure of vitamin D (n 164) Patient population (n 21)
Other reasons (n 65)
Multiple reports on the same data (n 77)
Report of median 25(OH)D values only (n 15) No standard deviation reported (n 30)
Sample size ≤30 (n 8)
Studies on newborns (n 10)
Studies on institutionalised elderly (n 9) Other reasons (n 11)
25(OH)D values not reported separately for males and females (n 30) Other study designs, e.g. case–control studies or intervention trials (n 7)
Population subgroup defined by other characteristics, e.g. ethnicity or job (n 72)
Fig. 1. Flow chart of the study selection (1990 – 2011). 25(OH)D, 25-Hydroxyvitamin D.
Systematic review of vitamin D status 25
British
Journal
of
Nutrition
https:/www.cambridge.org/core/terms. https://doi.org/10.1017/S0007114513001840
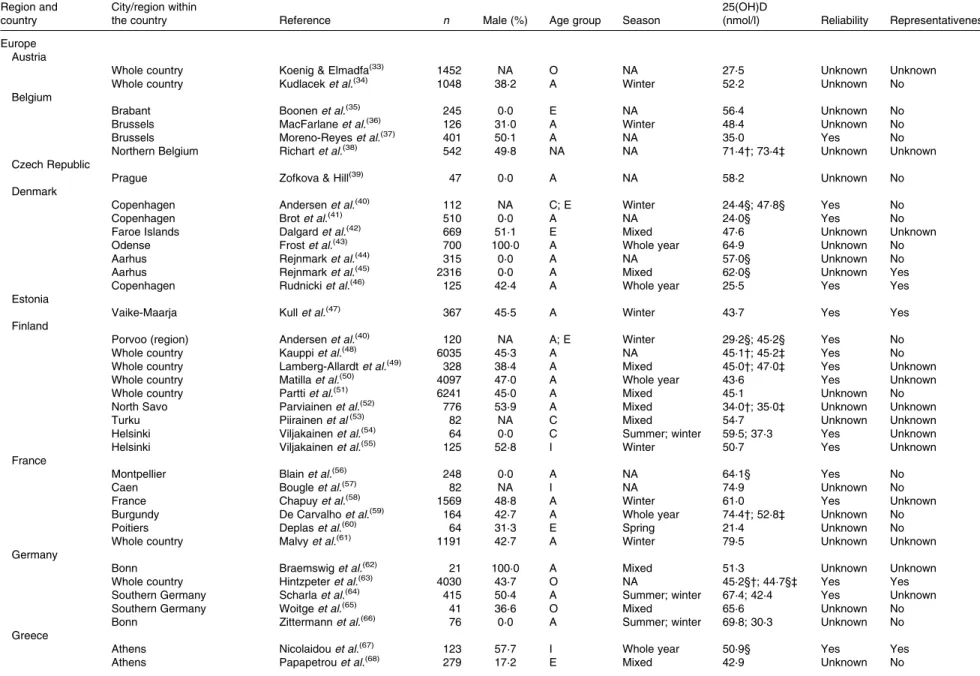
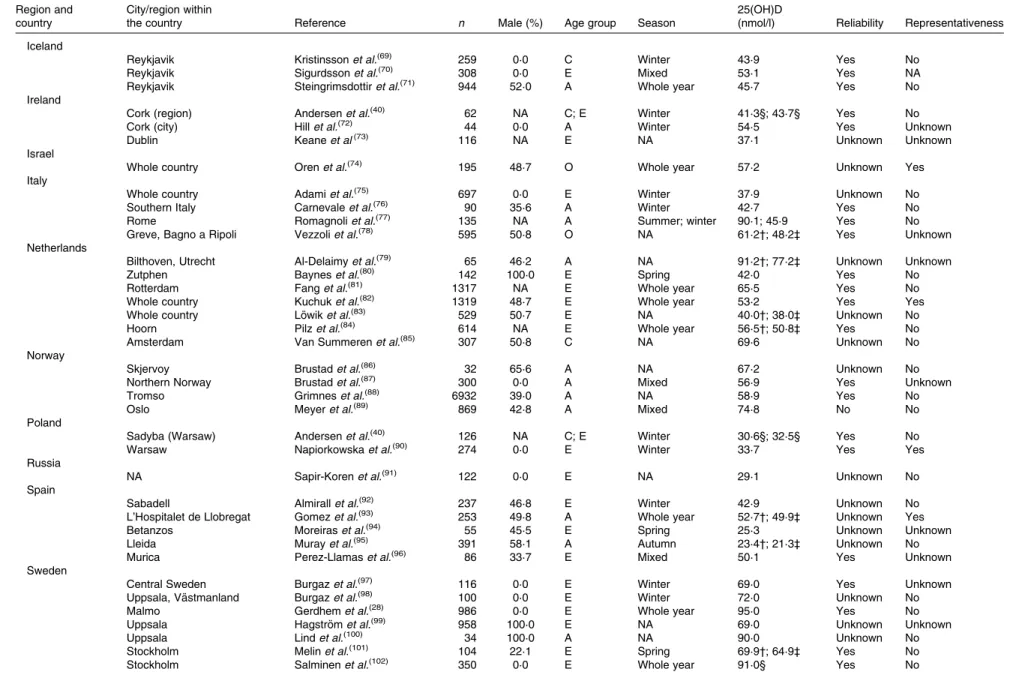
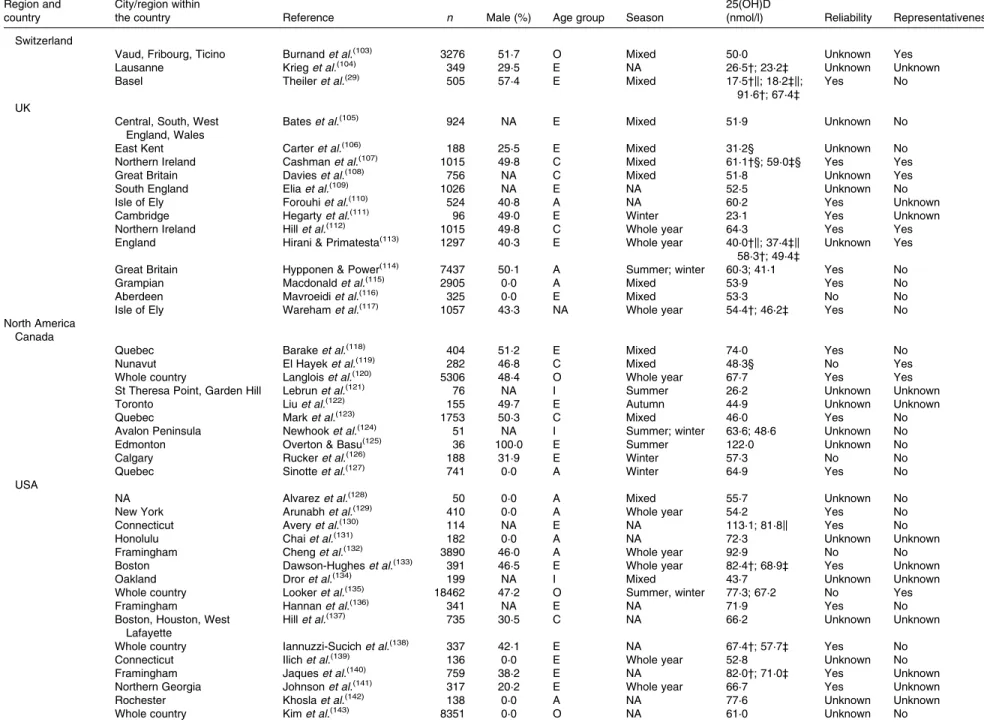
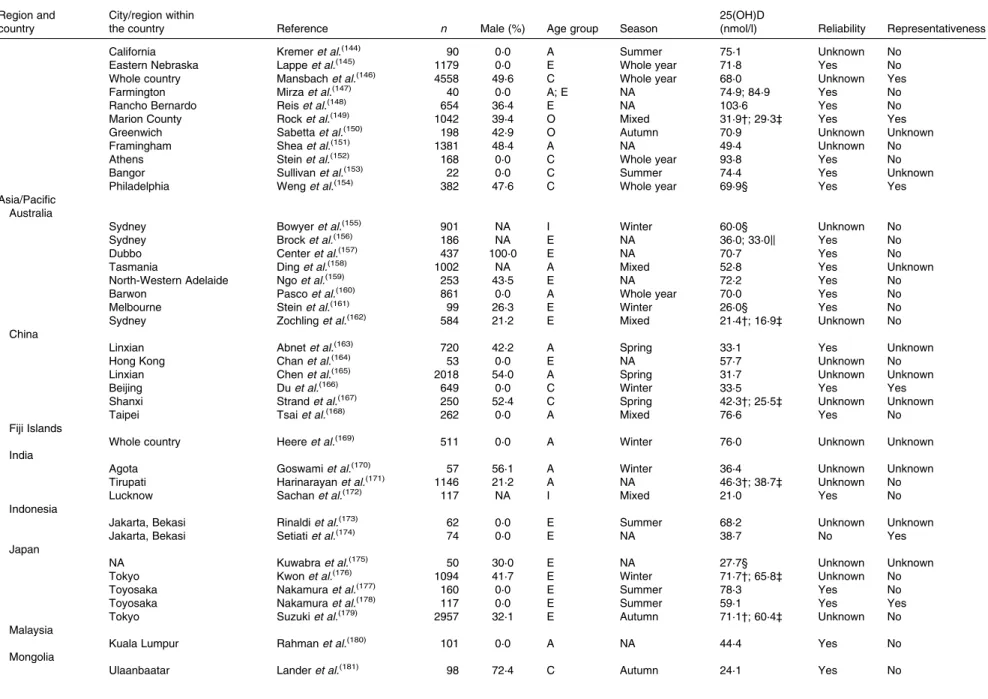
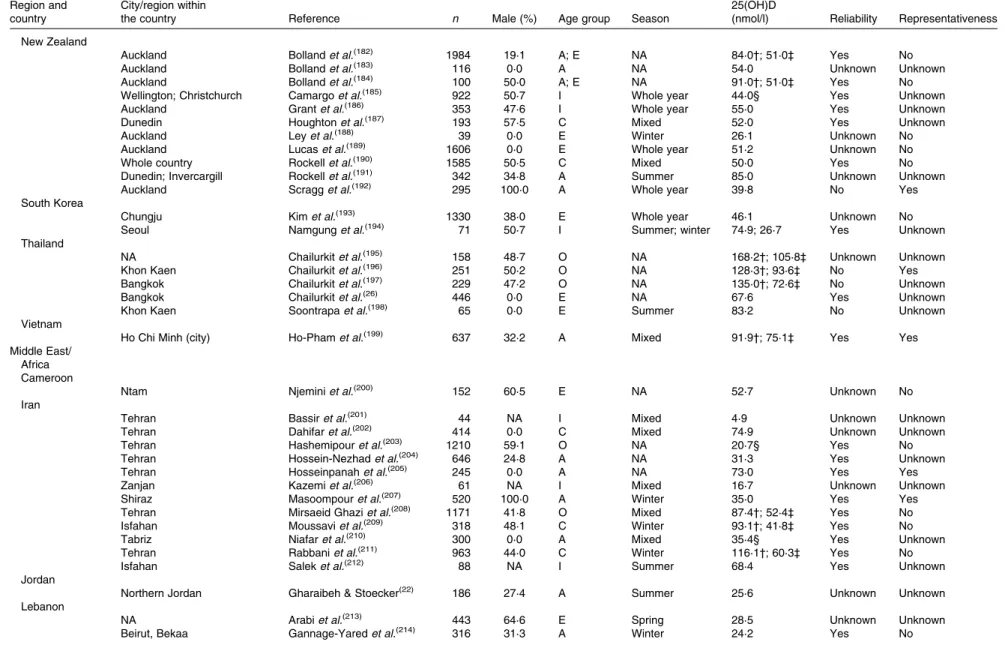
Table 1. Characteristics and main results from single studies on 25-hydroxyvitamin D (25(OH)D)* Region and
country
City/region within
the country Reference n Male (%) Age group Season
25(OH)D
(nmol/l) Reliability Representativeness Europe
Austria
Whole country Koenig & Elmadfa(33) 1452 NA O NA 27·5 Unknown Unknown
Whole country Kudlacek et al.(34) 1048 38·2 A Winter 52·2 Unknown No Belgium
Brabant Boonen et al.(35) 245 0·0 E NA 56·4 Unknown No
Brussels MacFarlane et al.(36) 126 31·0 A Winter 48·4 Unknown No
Brussels Moreno-Reyes et al.(37) 401 50·1 A NA 35·0 Yes No
Northern Belgium Richart et al.(38) 542 49·8 NA NA 71·4†; 73·4‡ Unknown Unknown Czech Republic
Prague Zofkova & Hill(39) 47 0·0 A NA 58·2 Unknown No Denmark
Copenhagen Andersen et al.(40) 112 NA C; E Winter 24·4§; 47·8§ Yes No Copenhagen Brot et al.(41) 510 0·0 A NA 24·0§ Yes No
Faroe Islands Dalgard et al.(42) 669 51·1 E Mixed 47·6 Unknown Unknown
Odense Frost et al.(43) 700 100·0 A Whole year 64·9 Unknown No
Aarhus Rejnmark et al.(44) 315 0·0 A NA 57·0§ Unknown No
Aarhus Rejnmark et al.(45) 2316 0·0 A Mixed 62·0§ Unknown Yes Copenhagen Rudnicki et al.(46) 125 42·4 A Whole year 25·5 Yes Yes
Estonia
Vaike-Maarja Kull et al.(47) 367 45·5 A Winter 43·7 Yes Yes
Finland
Porvoo (region) Andersen et al.(40) 120 NA A; E Winter 29·2§; 45·2§ Yes No
Whole country Kauppi et al.(48) 6035 45·3 A NA 45·1†; 45·2‡ Yes No Whole country Lamberg-Allardt et al.(49) 328 38·4 A Mixed 45·0†; 47·0‡ Yes Unknown
Whole country Matilla et al.(50) 4097 47·0 A Whole year 43·6 Yes Unknown
Whole country Partti et al.(51) 6241 45·0 A Mixed 45·1 Unknown No
North Savo Parviainen et al.(52) 776 53·9 A Mixed 34·0†; 35·0‡ Unknown Unknown
Turku Piirainen et al(53) 82 NA C Mixed 54·7 Unknown Unknown Helsinki Viljakainen et al.(54) 64 0·0 C Summer; winter 59·5; 37·3 Yes Unknown
Helsinki Viljakainen et al.(55) 125 52·8 I Winter 50·7 Yes Unknown France
Montpellier Blain et al.(56) 248 0·0 A NA 64·1§ Yes No Caen Bougle et al.(57) 82 NA I NA 74·9 Unknown No
France Chapuy et al.(58) 1569 48·8 A Winter 61·0 Yes Unknown
Burgundy De Carvalho et al.(59) 164 42·7 A Whole year 74·4†; 52·8‡ Unknown No
Poitiers Deplas et al.(60) 64 31·3 E Spring 21·4 Unknown No
Whole country Malvy et al.(61) 1191 42·7 A Winter 79·5 Unknown Unknown Germany
Bonn Braemswig et al.(62) 21 100·0 A Mixed 51·3 Unknown Unknown Whole country Hintzpeter et al.(63) 4030 43·7 O NA 45·2§†; 44·7§‡ Yes Yes
Southern Germany Scharla et al.(64) 415 50·4 A Summer; winter 67·4; 42·4 Yes Unknown Southern Germany Woitge et al.(65) 41 36·6 O Mixed 65·6 Unknown No
Bonn Zittermann et al.(66) 76 0·0 A Summer; winter 69·8; 30·3 Unknown No
Greece
Athens Nicolaidou et al.(67) 123 57·7 I Whole year 50·9§ Yes Yes
Athens Papapetrou et al.(68) 279 17·2 E Mixed 42·9 Unknown No
J. Hilger et al . 26
British Journal of Nutrition
https:/www.cambridge.org/core/terms
.
https://doi.org/10.1017/S0007114513001840
Downloaded from
https:/www.cambridge.org/core
. University of Basel Library
, on
10 Jul 2017 at 15:48:16
Table 1. Continued Region and country
City/region within
the country Reference n Male (%) Age group Season
25(OH)D
(nmol/l) Reliability Representativeness Iceland
Reykjavik Kristinsson et al.(69) 259 0·0 C Winter 43·9 Yes No
Reykjavik Sigurdsson et al.(70) 308 0·0 E Mixed 53·1 Yes NA Reykjavik Steingrimsdottir et al.(71) 944 52·0 A Whole year 45·7 Yes No
Ireland
Cork (region) Andersen et al.(40) 62 NA C; E Winter 41·3§; 43·7§ Yes No
Cork (city) Hill et al.(72) 44 0·0 A Winter 54·5 Yes Unknown
Dublin Keane et al(73) 116 NA E NA 37·1 Unknown Unknown
Israel
Whole country Oren et al.(74) 195 48·7 O Whole year 57·2 Unknown Yes
Italy
Whole country Adami et al.(75) 697 0·0 E Winter 37·9 Unknown No
Southern Italy Carnevale et al.(76) 90 35·6 A Winter 42·7 Yes No
Rome Romagnoli et al.(77) 135 NA A Summer; winter 90·1; 45·9 Yes No Greve, Bagno a Ripoli Vezzoli et al.(78) 595 50·8 O NA 61·2†; 48·2‡ Yes Unknown
Netherlands
Bilthoven, Utrecht Al-Delaimy et al.(79) 65 46·2 A NA 91·2†; 77·2‡ Unknown Unknown
Zutphen Baynes et al.(80) 142 100·0 E Spring 42·0 Yes No
Rotterdam Fang et al.(81) 1317 NA E Whole year 65·5 Yes No
Whole country Kuchuk et al.(82) 1319 48·7 E Whole year 53·2 Yes Yes
Whole country Lo¨wik et al.(83) 529 50·7 E NA 40·0†; 38·0‡ Unknown No
Hoorn Pilz et al.(84) 614 NA E Whole year 56·5†; 50·8‡ Yes No
Amsterdam Van Summeren et al.(85) 307 50·8 C NA 69·6 Unknown No Norway
Skjervoy Brustad et al.(86) 32 65·6 A NA 67·2 Unknown No Northern Norway Brustad et al.(87) 300 0·0 A Mixed 56·9 Yes Unknown
Tromso Grimnes et al.(88) 6932 39·0 A NA 58·9 Yes No
Oslo Meyer et al.(89) 869 42·8 A Mixed 74·8 No No
Poland
Sadyba (Warsaw) Andersen et al.(40) 126 NA C; E Winter 30·6§; 32·5§ Yes No
Warsaw Napiorkowska et al.(90) 274 0·0 E Winter 33·7 Yes Yes
Russia
NA Sapir-Koren et al.(91) 122 0·0 E NA 29·1 Unknown No
Spain
Sabadell Almirall et al.(92) 237 46·8 E Winter 42·9 Unknown No
L’Hospitalet de Llobregat Gomez et al.(93) 253 49·8 A Whole year 52·7†; 49·9‡ Unknown Yes Betanzos Moreiras et al.(94) 55 45·5 E Spring 25·3 Unknown Unknown
Lleida Muray et al.(95) 391 58·1 A Autumn 23·4†; 21·3‡ Unknown No
Murica Perez-Llamas et al.(96) 86 33·7 E Mixed 50·1 Yes Unknown
Sweden
Central Sweden Burgaz et al.(97) 116 0·0 E Winter 69·0 Yes Unknown
Uppsala, Va¨stmanland Burgaz et al.(98) 100 0·0 E Winter 72·0 Unknown No
Malmo Gerdhem et al.(28) 986 0·0 E Whole year 95·0 Yes No Uppsala Hagstro¨m et al.(99) 958 100·0 E NA 69·0 Unknown Unknown
Uppsala Lind et al.(100) 34 100·0 A NA 90·0 Unknown No Stockholm Melin et al.(101) 104 22·1 E Spring 69·9†; 64·9‡ Yes No
Stockholm Salminen et al.(102) 350 0·0 E Whole year 91·0§ Yes No
Systematic review of vitamin D status 27
British Journal of Nutrition
https:/www.cambridge.org/core/terms
.
https://doi.org/10.1017/S0007114513001840
Downloaded from
https:/www.cambridge.org/core
. University of Basel Library
, on
10 Jul 2017 at 15:48:16
Table 1. Continued Region and country
City/region within
the country Reference n Male (%) Age group Season
25(OH)D
(nmol/l) Reliability Representativeness Switzerland
Vaud, Fribourg, Ticino Burnand et al.(103) 3276 51·7 O Mixed 50·0 Unknown Yes
Lausanne Krieg et al.(104) 349 29·5 E NA 26·5†; 23·2‡ Unknown Unknown
Basel Theiler et al.(29) 505 57·4 E Mixed 17·5†k; 18·2‡k;
91·6†; 67·4‡
Yes No UK
Central, South, West England, Wales
Bates et al.(105) 924 NA E Mixed 51·9 Unknown No East Kent Carter et al.(106) 188 25·5 E Mixed 31·2§ Unknown No
Northern Ireland Cashman et al.(107) 1015 49·8 C Mixed 61·1†§; 59·0‡§ Yes Yes
Great Britain Davies et al.(108) 756 NA C Mixed 51·8 Unknown Yes
South England Elia et al.(109) 1026 NA E NA 52·5 Unknown No
Isle of Ely Forouhi et al.(110) 524 40·8 A NA 60·2 Yes Unknown
Cambridge Hegarty et al.(111) 96 49·0 E Winter 23·1 Yes Unknown Northern Ireland Hill et al.(112) 1015 49·8 C Whole year 64·3 Yes Yes
England Hirani & Primatesta(113) 1297 40·3 E Whole year 40·0†k; 37·4‡k 58·3†; 49·4‡
Unknown Yes Great Britain Hypponen & Power(114) 7437 50·1 A Summer; winter 60·3; 41·1 Yes No Grampian Macdonald et al.(115) 2905 0·0 A Mixed 53·9 Yes No
Aberdeen Mavroeidi et al.(116) 325 0·0 E Mixed 53·3 No No
Isle of Ely Wareham et al.(117) 1057 43·3 NA Whole year 54·4†; 46·2‡ Yes No
North America Canada
Quebec Barake et al.(118) 404 51·2 E Mixed 74·0 Yes No
Nunavut El Hayek et al.(119) 282 46·8 C Mixed 48·3§ No Yes Whole country Langlois et al.(120) 5306 48·4 O Whole year 67·7 Yes Yes
St Theresa Point, Garden Hill Lebrun et al.(121) 76 NA I Summer 26·2 Unknown Unknown Toronto Liu et al.(122) 155 49·7 E Autumn 44·9 Unknown Unknown
Quebec Mark et al.(123) 1753 50·3 C Mixed 46·0 Yes No
Avalon Peninsula Newhook et al.(124) 51 NA I Summer; winter 63·6; 48·6 Unknown No
Edmonton Overton & Basu(125) 36 100·0 E Summer 122·0 Unknown No
Calgary Rucker et al.(126) 188 31·9 E Winter 57·3 No No
Quebec Sinotte et al.(127) 741 0·0 A Winter 64·9 Yes No
USA
NA Alvarez et al.(128) 50 0·0 A Mixed 55·7 Unknown No
New York Arunabh et al.(129) 410 0·0 A Whole year 54·2 Yes No Connecticut Avery et al.(130) 114 NA E NA 113·1; 81·8k Yes No
Honolulu Chai et al.(131) 182 0·0 A NA 72·3 Unknown Unknown Framingham Cheng et al.(132) 3890 46·0 A Whole year 92·9 No No
Boston Dawson-Hughes et al.(133) 391 46·5 E Whole year 82·4†; 68·9‡ Yes Unknown
Oakland Dror et al.(134) 199 NA I Mixed 43·7 Unknown Unknown
Whole country Looker et al.(135) 18462 47·2 O Summer, winter 77·3; 67·2 No Yes
Framingham Hannan et al.(136) 341 NA E NA 71·9 Yes No Boston, Houston, West
Lafayette
Hill et al.(137) 735 30·5 C NA 66·2 Unknown Unknown
Whole country Iannuzzi-Sucich et al.(138) 337 42·1 E NA 67·4†; 57·7‡ Yes No
Connecticut Ilich et al.(139) 136 0·0 E Whole year 52·8 Unknown No Framingham Jaques et al.(140) 759 38·2 E NA 82·0†; 71·0‡ Yes Unknown
Northern Georgia Johnson et al.(141) 317 20·2 E Whole year 66·7 Yes Unknown
Rochester Khosla et al.(142) 138 0·0 A NA 77·6 Unknown Unknown
Whole country Kim et al.(143) 8351 0·0 O NA 61·0 Unknown No
J. Hilger et al . 28
British Journal of Nutrition
https:/www.cambridge.org/core/terms
.
https://doi.org/10.1017/S0007114513001840
Downloaded from
https:/www.cambridge.org/core
. University of Basel Library
, on
10 Jul 2017 at 15:48:16
Table 1. Continued Region and country
City/region within
the country Reference n Male (%) Age group Season
25(OH)D
(nmol/l) Reliability Representativeness California Kremer et al.(144) 90 0·0 A Summer 75·1 Unknown No
Eastern Nebraska Lappe et al.(145) 1179 0·0 E Whole year 71·8 Yes No
Whole country Mansbach et al.(146) 4558 49·6 C Whole year 68·0 Unknown Yes
Farmington Mirza et al.(147) 40 0·0 A; E NA 74·9; 84·9 Yes No
Rancho Bernardo Reis et al.(148) 654 36·4 E NA 103·6 Yes No Marion County Rock et al.(149) 1042 39·4 O Mixed 31·9†; 29·3‡ Yes Yes
Greenwich Sabetta et al.(150) 198 42·9 O Autumn 70·9 Unknown Unknown Framingham Shea et al.(151) 1381 48·4 A NA 49·4 Unknown No
Athens Stein et al.(152) 168 0·0 C Whole year 93·8 Yes No Bangor Sullivan et al.(153) 22 0·0 C Summer 74·4 Yes Unknown
Philadelphia Weng et al.(154) 382 47·6 C Whole year 69·9§ Yes Yes
Asia/Pacific Australia
Sydney Bowyer et al.(155) 901 NA I Winter 60·0§ Unknown No Sydney Brock et al.(156) 186 NA E NA 36·0; 33·0k Yes No
Dubbo Center et al.(157) 437 100·0 E NA 70·7 Yes No Tasmania Ding et al.(158) 1002 NA A Mixed 52·8 Yes Unknown
North-Western Adelaide Ngo et al.(159) 253 43·5 E NA 72·2 Yes No Barwon Pasco et al.(160) 861 0·0 A Whole year 70·0 Yes No
Melbourne Stein et al.(161) 99 26·3 E Winter 26·0§ Yes No
Sydney Zochling et al.(162) 584 21·2 E Mixed 21·4†; 16·9‡ Unknown No
China
Linxian Abnet et al.(163) 720 42·2 A Spring 33·1 Yes Unknown
Hong Kong Chan et al.(164) 53 0·0 E NA 57·7 Unknown No
Linxian Chen et al.(165) 2018 54·0 A Spring 31·7 Unknown Unknown Beijing Du et al.(166) 649 0·0 C Winter 33·5 Yes Yes
Shanxi Strand et al.(167) 250 52·4 C Spring 42·3†; 25·5‡ Unknown Unknown Taipei Tsai et al.(168) 262 0·0 A Mixed 76·6 Yes No
Fiji Islands
Whole country Heere et al.(169) 511 0·0 A Winter 76·0 Unknown Unknown
India
Agota Goswami et al.(170) 57 56·1 A Winter 36·4 Unknown Unknown
Tirupati Harinarayan et al.(171) 1146 21·2 A NA 46·3†; 38·7‡ Unknown No
Lucknow Sachan et al.(172) 117 NA I Mixed 21·0 Yes No Indonesia
Jakarta, Bekasi Rinaldi et al.(173) 62 0·0 E Summer 68·2 Unknown Unknown Jakarta, Bekasi Setiati et al.(174) 74 0·0 E NA 38·7 No Yes
Japan
NA Kuwabra et al.(175) 50 30·0 E NA 27·7§ Unknown Unknown
Tokyo Kwon et al.(176) 1094 41·7 E Winter 71·7†; 65·8‡ Unknown No
Toyosaka Nakamura et al.(177) 160 0·0 E Summer 78·3 Yes No
Toyosaka Nakamura et al.(178) 117 0·0 E Summer 59·1 Yes Yes
Tokyo Suzuki et al.(179) 2957 32·1 E Autumn 71·1†; 60·4‡ Unknown No Malaysia
Kuala Lumpur Rahman et al.(180) 101 0·0 A NA 44·4 Yes No Mongolia
Ulaanbaatar Lander et al.(181) 98 72·4 C Autumn 24·1 Yes No
Systematic review of vitamin D status 29
British Journal of Nutrition
https:/www.cambridge.org/core/terms
.
https://doi.org/10.1017/S0007114513001840
Downloaded from
https:/www.cambridge.org/core
. University of Basel Library
, on
10 Jul 2017 at 15:48:16
Table 1. Continued Region and country
City/region within
the country Reference n Male (%) Age group Season
25(OH)D
(nmol/l) Reliability Representativeness New Zealand
Auckland Bolland et al.(182) 1984 19·1 A; E NA 84·0†; 51·0‡ Yes No Auckland Bolland et al.(183) 116 0·0 A NA 54·0 Unknown Unknown
Auckland Bolland et al.(184) 100 50·0 A; E NA 91·0†; 51·0‡ Yes No Wellington; Christchurch Camargo et al.(185) 922 50·7 I Whole year 44·0§ Yes Unknown
Auckland Grant et al.(186) 353 47·6 I Whole year 55·0 Yes Unknown
Dunedin Houghton et al.(187) 193 57·5 C Mixed 52·0 Yes Unknown
Auckland Ley et al.(188) 39 0·0 E Winter 26·1 Unknown No
Auckland Lucas et al.(189) 1606 0·0 E Whole year 51·2 Unknown No Whole country Rockell et al.(190) 1585 50·5 C Mixed 50·0 Yes No
Dunedin; Invercargill Rockell et al.(191) 342 34·8 A Summer 85·0 Unknown Unknown Auckland Scragg et al.(192) 295 100·0 A Whole year 39·8 No Yes
South Korea
Chungju Kim et al.(193) 1330 38·0 E Whole year 46·1 Unknown No
Seoul Namgung et al.(194) 71 50·7 I Summer; winter 74·9; 26·7 Yes Unknown
Thailand
NA Chailurkit et al.(195) 158 48·7 O NA 168·2†; 105·8‡ Unknown Unknown
Khon Kaen Chailurkit et al.(196) 251 50·2 O NA 128·3†; 93·6‡ No Yes Bangkok Chailurkit et al.(197) 229 47·2 O NA 135·0†; 72·6‡ No Unknown
Bangkok Chailurkit et al.(26) 446 0·0 E NA 67·6 Yes Unknown Khon Kaen Soontrapa et al.(198) 65 0·0 E Summer 83·2 No Unknown
Vietnam
Ho Chi Minh (city) Ho-Pham et al.(199) 637 32·2 A Mixed 91·9†; 75·1‡ Yes Yes
Middle East/ Africa Cameroon
Ntam Njemini et al.(200) 152 60·5 E NA 52·7 Unknown No
Iran
Tehran Bassir et al.(201) 44 NA I Mixed 4·9 Unknown Unknown Tehran Dahifar et al.(202) 414 0·0 C Mixed 74·9 Unknown Unknown
Tehran Hashemipour et al.(203) 1210 59·1 O NA 20·7§ Yes No Tehran Hossein-Nezhad et al.(204) 646 24·8 A NA 31·3 Yes Unknown
Tehran Hosseinpanah et al.(205) 245 0·0 A NA 73·0 Yes Yes Zanjan Kazemi et al.(206) 61 NA I Mixed 16·7 Unknown Unknown
Shiraz Masoompour et al.(207) 520 100·0 A Winter 35·0 Yes Yes
Tehran Mirsaeid Ghazi et al.(208) 1171 41·8 O Mixed 87·4†; 52·4‡ Yes No
Isfahan Moussavi et al.(209) 318 48·1 C Winter 93·1†; 41·8‡ Yes No
Tabriz Niafar et al.(210) 300 0·0 A Mixed 35·4§ Yes Unknown Tehran Rabbani et al.(211) 963 44·0 C Winter 116·1†; 60·3‡ Yes No
Isfahan Salek et al.(212) 88 NA I Summer 68·4 Yes Unknown Jordan
Northern Jordan Gharaibeh & Stoecker(22) 186 27·4 A Summer 25·6 Unknown Unknown Lebanon
NA Arabi et al.(213) 443 64·6 E Spring 28·5 Unknown Unknown Beirut, Bekaa Gannage-Yared et al.(214) 316 31·3 A Winter 24·2 Yes No
J. Hilger et al . 30
British Journal of Nutrition
https:/www.cambridge.org/core/terms
.
https://doi.org/10.1017/S0007114513001840
Downloaded from
https:/www.cambridge.org/core
. University of Basel Library
, on
10 Jul 2017 at 15:48:16
Statistical analyses
Descriptive statistics were calculated for baseline character-istics of all the included studies. If mean 25(OH)D values were not reported in an article, we used median values (9·2 % of the studies) in our descriptive analyses.
Meta-analyses were performed for subgroups stratified by age, sex and geographical region using random-effects models. Studies reporting median 25(OH)D values (n 15) or mean values without a corresponding standard deviation (n 30) were not included in this phase of the analyses (Fig. 1). In addition, our focus in the meta-analyses was limited to studies/subgroups with sample sizes greater than 30, given concerns about the precision of estimates. Studies on newborns (n 10) and institutionalised elderly (n 9) were also not included in the meta-analyses. For analyses stratified by sex, we also excluded studies that did not report separate 25(OH)D values for males and females (n 30).
Heterogeneity between the studies was assessed by visual inspection of forest plots and calculation of I2statistics. Because we found substantial heterogeneity across the studies, we decided to further explore potential explanatory factors. Therefore, we conducted heterogeneity analyses within each subgroup by accounting for a range of characteristics other than age and sex, which included season, assay type, distance from the equator(5)and components of study quality. Studies were grouped by study characteristics (e.g. season and assay type) to assess whether heterogeneity was reduced as indicated by the I2statistics and the inspection of forest plots.
Supplementary analyses explored patterns of vitamin D status within specific subgroups (e.g. institutionalised elderly) and for selected associations reported in previous work. The purpose of these exploratory analyses was to support further research in this area by generating hypotheses that might be tested more thoroughly in future studies. All statistical analyses were conducted using STATA version 12.1 (StataCorp).
Results
Description of studies
Studies included in the present review (Table 1) contained data on a total of 168 389 participants from forty-four countries. The sample size of individual studies ranged from 11 to 18 462 participants with a median of 316 (interquartile range 117–861). While the majority of studies contained data on males and females, nine studies (4·7 %) restricted their focus to males, while fifty-four studies (28·0 %) contained data on only females. The overall proportions of males and females were 33·3 and 66·7 %, respectively, and the mean age of the participants was 51·7 (SD24·3) years. Most studies
were conducted in Europe (45·1 %), followed by the Asia/Pacific region (23·8 %) and North America (19·7 %). In terms of the country in which studies were conducted, most were carried out in the USA (n 28), followed by Iran (n 12), New Zealand (n 11) and Canada (n 10).
The assays reported to measure 25(OH)D values included RIA (55·9 %), competitive protein-binding assays (14·0 %) and other methods such as chemiluminescence immunoassay and HPLC. Table 1 . Continued Region and country City/region within the country Reference n Male (%) Age group Season 25(OH)D (nmol/l) Reliability Representativeness Nigeria Jos P fitzner et al. (215) 218 4 5 ·0 C Mixed 6 6 ·8 U nknown Unknown South A frica Cape Town Charlton et al. (216) 173 4 8 ·0 E 36 ·9 Unknown N o Gambia Whole country Aspray et al. (21 7 ) 113 0 ·0 O N A 9 7 ·7 N o N o Latin America Argentina Ushuaia Oliveri et al. (21 8 ) 42 57 ·1 C W inter 2 4 ·5 U nknown N o Brazil Sao Paulo C anto-Costa et al. (219) 11 36 ·4 E N A 6 1 ·2 Y es No Sao Paulo Saraiva et al. (22 0 ) 250 3 0 ·8 E Whole year 5 2 ·4 N o Yes NA, no t availa ble; O, others; A, adults; E , e lderly; C , c hildren and adolescen ts; I, newborns/infan ts. * Data from three studi es not indicating g eographical region ha ve been excluded (221 – 223) ; data from a sin g le study (40) providing country-spec ific d ata o n four nations in Eu rope are represented separately. In some cases, 25(OH)D mean values were available b y age, sex or region only. For some studies, multiple reports have been published, which are not listed in this table (23,27,30,224 – 297) . † 25(OH)D mean values for men . ‡ 25(OH)D mean values for w o men. § 25(OH)D median values. k 25(OH)D mean values for institutio nalised elderly.
Systematic review of vitamin D status 31
British
Journal
of
Nutrition
https:/www.cambridge.org/core/terms. https://doi.org/10.1017/S0007114513001840
In terms of study quality, more than half of the studies (50·2 %) were classified as non-representative of the target population and 14·9 % qualified as representative according to the criteria defined previously. Evidence of representativeness could not be established in 34·9 % of the studies due to missing infor-mation. Information on assay reliability was provided in 61·0 % of the studies with 52·8 % classified as providing reliable 25(OH)D measurements. Assay validity was reported in a min-ority of studies (9·7 %).
Global vitamin D status
There was a significant variability in the estimates of 25(OH)D values across the studies with mean and median values ranging from 4·9 to 136·2 nmol/l and 20·7 to 91·0 nmol/l, respectively. We found that 88·1 % of the samples presented in the present review had mean 25(OH)D values below 75 nmol/l, 37·3 % had mean values below 50 nmol/l and 6·7 % had mean values below 25 nmol/l. Fig. 2 provides an overview
Europe (ninety studies) Austria (n 2) Belgium (n 4) Czech Republic (n 1) Denmark (n 7) Estonia (n 1) Finland (n 9) France (n 6) Germany (n 5) Greece (n 2) Iceland (n 3) Ireland (n 3) Israel (n 1) Italy (n 4) Netherlands (n 7) Norway (n 4) Poland (n 2) Russia (n 1) Spain (n 5) Sweden (n 7) Switzerland (n 3) UK (n 13) Canada (n 10) USA (n 28) Australia (n 8) China (n 6) Fiji Islands (n 1) India (n 3) Indonesia (n 2) Japan (n 5) Malaysia (n 1) Mongolia (n 1) New Zealand (n 11) South Korea (n 2) Thailand (n 5) Vietnam (n 1) Cameroon (n 1) Gambia (n 1) Iran (n 12) Jordan (n 1) Lebanon (n 2) Nigeria (n 1) South Africa (n 1) Argentina (n 1) Brazil (n 2) 0 25 50 75 100 125
North America (thirty-eight studies)
Asia Pacific (forty-six studies)
Middle East and Africa (nineteen studies)
South America (three studies)
Fig. 2. Mean/median 25-hydroxyvitamin D (25(OH)D) values, by geographical region and country. Note: medians ( ) are shown where mean values ( ) are not reported; Study size is indicated by circle size. The background colour scheme is intended to reflect the current uncertainty around the definition of thresholds for deficient, insufficient and adequate 25(OH)D levels. Mean/median values falling within the intensely red zone are most consistent with severe vitamin D deficiency; those in the green zone reflect adequate vitamin D levels. Values within the yellow zone are those thought to be indicative of insufficiency. Data from three studies not indicating geographical region have been excluded(221 – 223); data from a single study(40)providing country-specific data on four nations in Europe
are represented separately. One study(195)reported a mean 25(OH)D value of 136·2 nmol/l and therefore is not presented in the figure due to graphical reasons.
J. Hilger et al. 32
British
Journal
of
Nutrition
https:/www.cambridge.org/core/terms. https://doi.org/10.1017/S0007114513001840of the distribution of country- and study-specific mean 25(OH)D values, stratified by region. In addition, a visualisation of the available data on a global map can be found elsewhere(21).
Vitamin D status by age, sex and region
Due to a limited number of studies being identified from Latin America, it was not possible to perform meta-analyses for this region. Depending on the stratifying variable, I2 values ranged from 84·5 to 99·7 %, indicating substantial heterogeneity between the studies.
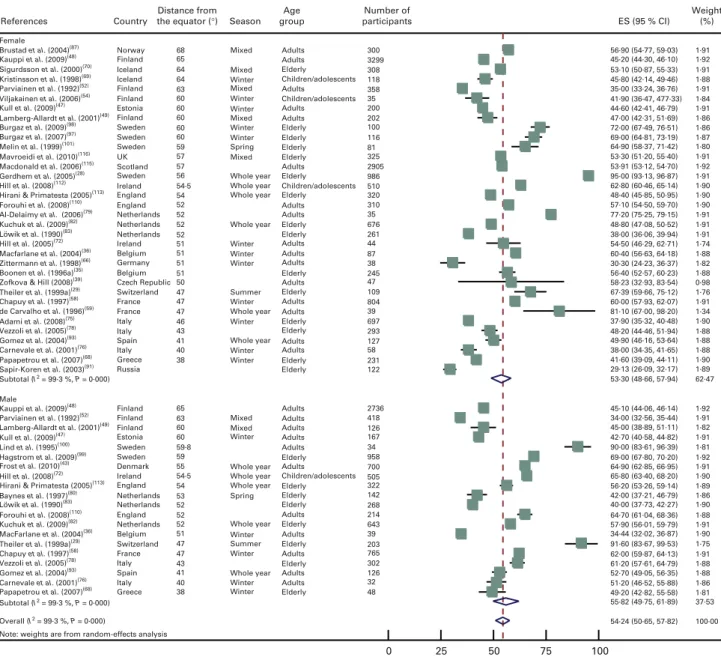
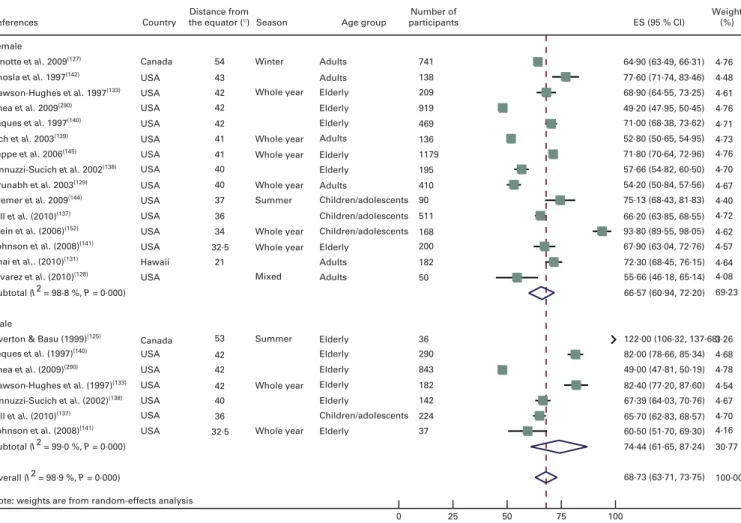
No significant age- or sex-related differences in 25(OH)D values were observed in the sample of eligible studies world-wide (data not shown). However, we observed differences by region with values being significantly higher in North America than in Europe or the Middle East/Africa region (Figs. 3 – 6). In an analysis stratified by age and region, we
did not find age-related differences for Europe and North America (Table 2). However, in the Asia/Pacific region, chil-dren/adolescents were found to have significantly lower 25(OH)D values than adults and elderly. In contrast, children/ adolescents from the Middle East/Africa region had signifi-cantly higher values than the other two age groups. No significant sex-related differences were observed in any of the regions (Figs. 3 – 6). However, reports of 25(OH)D values in women tended to be lower, especially in the Asia/Pacific and Middle East/Africa regions.
Heterogeneity analyses
The substantial heterogeneity that we observed within the different geographical regions could not be explained by the characteristics of the study population or features of study qual-ity. Grouping studies by age category and sex, assay type,
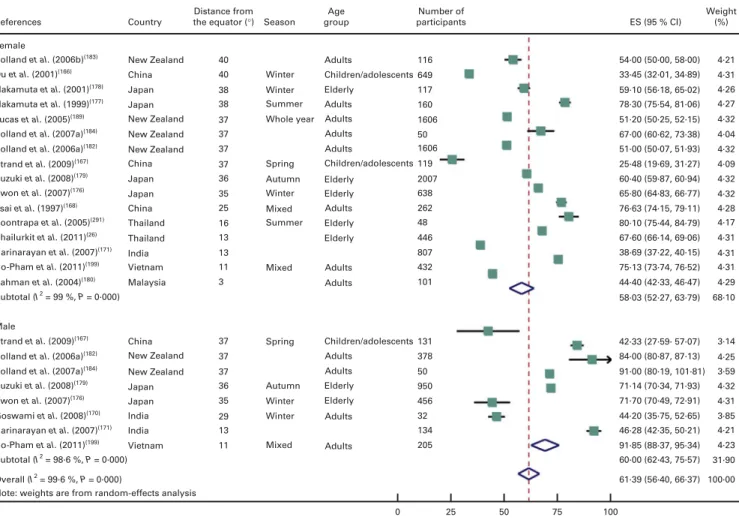
References Female Norway 68 300 56·90 (54·77, 59·03) 45·20 (44·30, 46·10) 53·10 (50·87, 55·33) 45·80 (42·14, 49·46) 35·00 (33·24, 36·76) 41·90 (36·47, 477·33) 44·60 (42·41, 46·79) 47·00 (42·31, 51·69) 72·00 (67·49, 76·51) 69·00 (64·81, 73·19) 64·90 (58·37, 71·42) 53·30 (51·20, 55·40) 53·91 (53·12, 54·70) 95·00 (93·13, 96·87) 62·80 (60·46, 65·14) 48·40 (45·85, 50·95) 57·10 (54·50, 59·70) 77·20 (75·25, 79·15) 48·80 (47·08, 50·52) 38·00 (36·06, 39·94) 54·50 (46·29, 62·71) 60·40 (56·63, 64·18) 30·30 (24·23, 36·37) 56·40 (52·57, 60·23) 58·23 (32·93, 83·54) 67·39 (59·66, 75·12) 60·00 (57·93, 62·07) 81·10 (67·00, 98·20) 37·90 (35·32, 40·48) 48·20 (44·46, 51·94) 49·90 (46·16, 53·64) 38·00 (34·35, 41·65) 41·60 (39·09, 44·11) 29·13 (26·09, 32·17) 53·30 (48·66, 57·94) 45·10 (44·06, 46·14) 34·00 (32·56, 35·44) 45·00 (38·89, 51·11) 42·70 (40·58, 44·82) 90·00 (83·61, 96·39) 69·00 (67·80, 70·20) 64·90 (62·85, 66·95) 65·80 (63·40, 68·20) 56·20 (53·26, 59·14) 42·00 (37·21, 46·79) 40·00 (37·73, 42·27) 64·70 (61·04, 68·36) 57·90 (56·01, 59·79) 34·44 (32·02, 36·87) 91·60 (83·67, 99·53) 62·00 (59·87, 64·13) 61·20 (57·61, 64·79) 52·70 (49·05, 56·35) 51·20 (46·52, 55·88) 49·20 (42·82, 55·58) 55·82 (49·75, 61·89) 54·24 (50·65, 57·82) 1·91 1·92 1·91 1·88 1·91 1·84 1·91 1·86 1·86 1·87 1·80 1·91 1·92 1·91 1·90 1·90 1·90 1·91 1·91 1·91 1·74 1·88 1·82 1·88 0·98 1·76 1·91 1·34 1·90 1·88 1·88 1·88 1·90 1·89 62·47 1·92 1·91 1·82 1·91 1·81 1·92 1·91 1·90 1·89 1·86 1·90 1·88 1·91 1·90 1·75 1·91 1·88 1·88 1·86 1·81 37·53 100·00 0 25 50 75 100 3299 308 118 358 35 200 202 100 116 81 325 2905 986 510 320 310 35 676 261 44 87 38 245 47 109 804 39 697 293 127 58 231 122 2736 418 126 167 34 958 700 505 322 142 268 214 643 39 203 765 302 126 32 48 Mixed Adults Adults Adults Adults Adults Adults Adults Adults Adults Adults Adults Adults Adults Adults Adults Adults Adults Adults Adults Adults Adults Adults Adults Adults Adults Adults Adults Elderly Elderly Elderly Elderly Elderly Elderly Elderly Elderly Elderly Elderly Elderly Elderly Elderly Elderly Elderly Elderly Elderly Elderly Elderly Elderly Elderly Elderly Elderly Children/adolescents Children/adolescents Children/adolescents Children/adolescents Mixed Mixed Mixed Mixed Whole year Whole year Whole year Whole year Whole year Whole year Whole year Whole year Whole year Whole year Whole year Spring Winter Winter Winter Winter Winter Winter Winter Winter Winter Winter Winter Winter Winter Winter Winter Winter Winter Summer Mixed Mixed Summer Spring 65 64 64 63 60 60 60 60 60 59 57 57 56 54·5 54 52 52 52 52 51 51 51 51 50 47 47 47 46 43 41 40 38 65 63 60 60 59·8 59 55 54·5 54 53 52 52 52 51 47 47 43 41 40 38 Finland Iceland Iceland Finland Finland Finland Sweden Sweden Sweden UK Scotland Sweden Ireland Ireland Belgium Germany Belgium Czech Republic Switzerland France France Italy Italy Greece Russia Finland Finland Finland Estonia Sweden Sweden Denmark Ireland England England Netherlands Netherlands Belgium Switzerland France Italy Italy Greece Spain Netherlands Italy Spain England England Netherlands Netherlands Netherlands Estonia Brustad et al. (2004)(87) Kauppi et al. (2009)(48) Sigurdsson et al. (2000)(70) Kristinsson et al. (1998)(69) Parviainen et al. (1992)(52) Viljakainen et al. (2006)(54) Kull et al. (2009)(47) Lamberg-Allardt et al. (2001)(49) Burgaz et al. (2009)(98) Burgaz et al. (2007)(97) Melin et al. (1999)(101) Mavroeidi et al. (2010)(116) Macdonald et al. (2006)(115) Gerdhem et al. (2005)(28) Hill et al. (2008)(112) Hirani & Primatesta (2005)(113) Forouhi et al. (2008)(110) Al-Delaimy et al. (2006)(79) Kuchuk et al. (2009)(82) Löwik et al. (1990)(83) Hill et al. (2005)(72) Macfarlane et al. (2004)(36) Zittermann et al. (1998)(66) Boonen et al. (1996a)(35) Zofkova & Hill (2008)(39) Theiler et al. (1999a)(29) Chapuy et al. (1997)(58) de Carvalho et al. (1996)(59) Adami et al. (2008)(75) Vezzoli et al. (2005)(78) Gomez et al. (2004)(93) Carnevale et al. (2001)(76) Papapetrou et al. (2007)(68) Sapir-Koren et al. (2003)(91) Subtotal (I2 = 99·3 %, P = 0·000) Male Kauppi et al. (2009)(48) Parviainen et al. (1992)(52) Lamberg-Allardt et al. (2001)(49) Kull et al. (2009)(47) Lind et al. (1995)(100) Hagstrom et al. (2009)(99) Frost et al. (2010)(43) Hill et al. (2008)(72) Hirani & Primatesta (2005)(113) Baynes et al. (1997)(80) Löwik et al. (1990)(83) Forouhi et al. (2008)(110) Kuchuk et al. (2009)(82) MacFarlane et al. (2004)(36) Theiler et al. (1999a)(29) Chapuy et al. (1997)(58) Vezzoli et al. (2005)(78) Gomez et al. (2004)(93) Carnevale et al. (2001)(76) Papapetrou et al. (2007)(68) Subtotal (I2 = 99·3 %, P = 0·000) Overall (I2 = 99·3 %, P = 0·000)
Note: weights are from random-effects analysis
Country
Distance from
the equator (°) Season
Age group Number of participants ES (95 % CI) Weight (%)
Fig. 3. Forest plot for Europe stratified by sex. ES, effect estimator. (A colour version of this figure can be found online at http://www.journals.cambridge.org/bjn)
Systematic review of vitamin D status 33
British
Journal
of
Nutrition
https:/www.cambridge.org/core/terms. https://doi.org/10.1017/S0007114513001840
season, distance from the equator or representativeness, for example, did not significantly reduce heterogeneity across the studies in our sample, as measured by the I2statistics.
Exploratory analyses
We found that mean 25(OH)D values for institutionalised elderly were lower than those for non-institutionalised elderly, especially in Europe and the Asia/Pacific region. Moreover, in specific subgroups in single countries within Europe, we observed differences, with Swedish elderly having higher 25(OH)D mean values than the elderly in other European countries. In addition, we found that newborns had lower 25(OH)D values than the other three age groups in several countries worldwide.
Discussion
Summary of the main findings
The published evidence on vitamin D status at the population level, as assessed by mean or median 25(OH)D values, is characterised by a high degree of variability across studies, countries and regions. Although no age- or sex-related signifi-cant differences in 25(OH)D values were observed across the sample of studies that we reviewed, we did observe differences by region with values being significantly higher
in North America than in Europe or the Middle East/Africa region. In stratified analyses, significant age-related differ-ences were observed in the Asia/Pacific and Middle East/ Africa regions, but not elsewhere. However, exploratory analyses suggested that newborns and institutionalised elderly were more likely to have lower reported 25(OH)D values in several regions worldwide. We found substantial heterogeneity between the studies in our sample from each geographical region that could not be explained in a detailed analysis.
Interpretation and comparison with previous studies
In contrast to previous reviews(5,13,14), we could not find differ-ences in 25(OH)D values for children/adolescents, adults and elderly. However, in analyses stratified by geographical region, significant age-related differences could be observed for the Asia/Pacific region, with children/adolescents having lower 25(OH)D values than older groups. This might be primarily due to the low 25(OH)D values found for Chinese children/adolescents as reported in previous work(13), who were observed to have low dietary Ca intake and limited sun-light exposure as possible reasons. In contrast, in the Middle East/Africa region, children/adolescents were found to have significantly higher 25(OH)D values than adults and elderly, a finding consistent with at least one previous study(8). OneReferences Female Sinotte et al. 2009(127) Canada 54 741 64·90 (63·49, 66·31) 77·60 (71·74, 83·46) 68·90 (64·55, 73·25) 49·20 (47·95, 50·45) 71·00 (68·38, 73·62) 52·80 (50·65, 54·95) 71·80 (70·64, 72·96) 57·66 (54·82, 60·50) 54·20 (50·84, 57·56) 75·13 (68·43, 81·83) 66·20 (63·85, 68·55) 93·80 (89·55, 98·05) 67·90 (63·04, 72·76) 72·30 (68·45, 76·15) 55·66 (46·18, 65·14) 66·57 (60·94, 72·20) 122·00 (106·32, 137·68) 82·00 (78·66, 85·34) 49·00 (47·81, 50·19) 82·40 (77·20, 87·60) 67·39 (64·03, 70·76) 65·70 (62·83, 68·57) 60·50 (51·70, 69·30) 74·44 (61·65, 87·24) 68·73 (63·71, 73·75) 138 209 919 469 136 1179 195 410 90 511 168 200 182 50 36 290 843 182 142 224 37 Winter Adults Adults Adults Adults Adults Adults Elderly Elderly Elderly Elderly Elderly Elderly Elderly Elderly Elderly Elderly Elderly Elderly Children/adolescents Children/adolescents Children/adolescents Children/adolescents Whole year Whole year Whole year Whole year Whole year Whole year Whole year Whole year Mixed Summer Summer 43 42 42 42 41 41 40 40 37 36 34 32·5 21 53 42 42 42 40 36 32·5 Canada USA USA USA USA USA USA USA USA USA USA USA USA USA USA USA USA USA USA USA Hawaii Khosla et al. 1997(142) Dawson-Hughes et al. 1997(133) Shea et al. 2009(290) Jaques et al. 1997(140) Ilich et al. 2003(139) Lappe et al. 2006(145) Iannuzzi-Sucich et al. 2002(138) Arunabh et al. 2003(129) Kremer et al. 2009(144) Hill et al. (2010)(137) Stein et al. (2006)(152) Johnson et al. (2008)(141) Chai et al.. (2010)(131) Alvarez et al. (2010)(128) Subtotal (I2 = 98·8 %, P = 0·000) Male
Overton & Basu (1999)(125)
Jaques et al. (1997)(140) Shea et al. (2009)(290) Dawson-Hughes et al. (1997)(133) Iannuzzi-Sucich et al. (2002)(138) Hill et al. (2010)(137) Johnson et al. (2008)(141) Subtotal (I2 = 99·0 %, P = 0·000) Overall (I2 = 98·9 %, P = 0·000)
Note: weights are from random-effects analysis Country
Distance from
the equator (°) Season Age group
Number of participants ES (95 % CI) Weight (%) 4·76 4·48 4·61 4·76 4·71 4·73 4·76 4·70 4·67 4·40 4·72 4·62 4·57 4·64 4·08 69·23 3·26 4·68 4·78 4·54 4·67 4·70 4·16 30·77 100·00 0 25 50 75 100
Fig. 4. Forest plot for North America stratified by sex. ES, effect estimator. (A colour version of this figure can be found online at http://www.journals.cambridge.org/bjn)
J. Hilger et al. 34
British
Journal
of
Nutrition
https:/www.cambridge.org/core/terms. https://doi.org/10.1017/S0007114513001840potential explanation for this pattern in the Middle East/Africa region could be that children/adolescents from this region gen-erally spend more time outdoors compared with the other age groups (e.g. indoor working by the adult population)(22). How-ever, others have also found age-related differences in other regions(5,13,14), which could not be confirmed in the present meta-analyses. A reduction in differences and thus greater simi-larities across age groups might be attributable to lifestyle changes over the course of time in which younger individuals from industrialised countries spend more time indoors watching television, using computers and playing video games compared with older adults(23).
In contrast to previous reviews, we were also unable to find significant sex-related differences(8,13,16). On examining our data by region, however, we observed that females tended to have lower 25(OH)D values, especially in the Middle East/Africa and Asia/Pacific regions. Some have suggested that this finding may be related to cultural factors such as differences in clothing styles that may impede vitamin D conversion in the skin(24).
The highest mean 25(OH)D values were generally observed in North America, a finding that might be explained by the routine fortification of several foods (e.g. milk, juice and
cer-eals) in the USA(25). The absence of significant differences between studies conducted in North America and those car-ried out in the Asia/Pacific region, however, may have been influenced by relatively high values found in Thailand, a country located near the equator with significant year-round sunlight exposure and higher daytime temperatures, resulting in the use of lighter-weight clothes, which afford less UV pro-tection(26). Studies conducted in Japan and other Asian countries may have further contributed to somewhat higher regional values, resulting from diets rich in vitamin D foods such as oily fish(27).
Previous reviews(5,8,15) have reported an apparent north – south gradient for 25(OH)D in Europe, with Scandinavian countries showing generally higher values than the Southern European countries. This finding is thought to result, in part, from population-based differences in skin pigmentation, diets rich in oily fish, the common use of cod-liver oil and a higher degree of vitamin D supplementation in Scandinavian countries(14,15). Although we did not find such a gradient in the present review, we observed generally higher 25(OH)D values in Swedish elderly than in those from other European countries. Some have suggested that this finding can be
References Female
Bolland et al. (2006b)(183)
New Zealand Adults 116
649 117 160 1606 1606 119 2007 638 262 48 446 807 432 101 131 378 50 950 456 32 134 205 50 Adults Adults Adults Adults Adults Adults Adults Adults Adults Adults Adults Children/adolescents Children/adolescents Children/adolescents Elderly Elderly Elderly Elderly Elderly Elderly Elderly Winter Winter Summer Whole year Spring Autumn Winter Mixed Mixed Spring Autumn Winter Winter Mixed Summer 40 40 38 38 37 37 37 37 36 35 25 16 13 13 11 3 37 37 37 36 35 29 13 11 New Zealand New Zealand New Zealand New Zealand New Zealand Japan Japan India India Vietnam China China China China Thailand Thailand India Vietnam Malaysia Japan Japan Japan Japan Du et al. (2001)(166) Nakamuta et al. (2001)(178) Nakamuta et al. (1999)(177) Lucas et al. (2005)(189)
Bolland et al. (2007a)(184)
Bolland et al. (2006a)(182)
Strand et al. (2009)(167) Suzuki et al. (2008)(179) Kwon et al. (2007)(176) Tsai et al. (1997)(168) Soontrapa et al. (2005)(291) Chailurkit et al. (2011)(26) Harinarayan et al. (2007)(171) Ho-Pham et al. (2011)(199) Rahman et al. (2004)(180) Subtotal (I2 = 99 %, P = 0·000) Male Strand et al. (2009)(167)
Bolland et al. (2006a)(182)
Bolland et al. (2007a)(184)
Suzuki et al. (2008)(179) Kwon et al. (2007)(176) Goswami et al. (2008)(170) Harinarayan et al. (2007)(171) Ho-Pham et al. (2011)(199) Subtotal (I2 = 98·6 %, P = 0·000) Overall (I2 = 99·6 %, P = 0·000)
Note: weights are from random-effects analysis
Country Season Age group Number of participants ES (95 % CI) 54·00 (50·00, 58·00) 4·21 4·31 4·26 4·27 4·32 4·04 4·32 4·09 4·32 4·32 4·28 4·17 4·31 4·31 4·31 4·29 68·10 3·14 4·25 4·32 4·31 3·85 4·21 4·23 31·90 100·00 3·59 33·45 (32·01, 34·89) 59·10 (56·18, 65·02) 78·30 (75·54, 81·06) 51·20 (50·25, 52·15) 67·00 (60·62, 73·38) 51·00 (50·07, 51·93) 25·48 (19·69, 31·27) 60·40 (59·87, 60·94) 65·80 (64·83, 66·77) 76·63 (74·15, 79·11) 80·10 (75·44, 84·79) 67·60 (66·14, 69·06) 38·69 (37·22, 40·15) 75·13 (73·74, 76·52) 44·40 (42·33, 46·47) 58·03 (52·27, 63·79) 42·33 (27·59· 57·07) 84·00 (80·87, 87·13) 91·00 (80·19, 101·81) 71·14 (70·34, 71·93) 71·70 (70·49, 72·91) 44·20 (35·75, 52·65) 46·28 (42·35, 50·21) 91·85 (88·37, 95·34) 60·00 (62·43, 75·57) 61·39 (56·40, 66·37) 0 25 50 75 100 Weight (%) Distance from the equator (°)
Fig. 5. Forest plot for the Asia/Pacific region stratified by sex. ES, effect estimator. (A colour version of this figure can be found online at http://www.journals. cambridge.org/bjn)
Systematic review of vitamin D status 35
British
Journal
of
Nutrition
https:/www.cambridge.org/core/terms. https://doi.org/10.1017/S0007114513001840
explained by the routine fortification of oil and low-fat milk products with vitamin D in Sweden(28).
In accordance with other reviews(5,8,15), our exploratory ana-lyses also suggested that institutionalised elderly in Europe and the Asia/Pacific region had lower mean 25(OH)D values than the elderly living in the community. It is possible that such a find-ing may result from less time spent outdoors due to poorer health status(29), although similar findings in other groups of
institutionalised individuals could be expected elsewhere. Further investigations of the patterns of vitamin D deficiency and insufficiency are needed in this vulnerable subgroup. Another interesting finding from our exploratory analyses was that newborns/infants were reported to have lower 25(OH)D values than the members of other age groups in several countries worldwide. Because newborn vitamin D status is mainly deter-mined by maternal vitamin D status(30), this finding may be
References
Female
Rabbani et al. (2009)(211) Iran 36 Winter
60·34 (56·45, 64·23) 6·67 6·75 6·39 6·72 6·74 6·70 6·74 6·67 6·75 60·13 6·60 6·69 6·68 6·72 6·43 6·75 39·87 100·00 0 25 50 75 100 30·92 (29·31, 32·53) 73·00 (65·20, 80·80) 37·69 (35·06, 40·32) 18·62 (16·70, 20·54) 41·83 (38·65, 45·02) 25·60 (23·65, 27·55) 74·88 (71·08, 78·68) 28·90 (27·17, 30·63) 43·24 (33·80, 52·67) 116·14 (111·00, 121·28) 32·57 (29·21, 35·93) 35·74 (32·01, 39·48) 36·19 (33·67, 38·72) 93·08 (85·66, 100·50) 35·00 (33·54, 36·46) 57·91 (39·19, 76·63) 49·05 (40·61, 57·48) 539 486 245 90 217 165 93 414 676 424 160 96 83 153 520 Children/adolescents Children/adolescents Children/adolescents Children/adolescents Children/adolescents Adults Adults Adults Adults Adults Adults Adults Adults Elderly Elderly Winter Winter Winter Winter Winter Winter Winter Winter Winter Summer Other 36 35 34 34 32 31 30·5 29 36 36 34 34 32 29 Iran Iran South Africa Lebanon Iran Iran Iran Iran Iran Iran Iran Lebanon South Africa Jordan Hossein-Nezhad et al. (2009)(204) Hosseinpanah et al. (2008)(205) Charlton et al. (1996)(216) Gannage-Yared et al. (2000)(214) Moussavi et al. (2005)(209) Gharaibeh & Stoecker (2009)(22) Dahifar et al. (2007)(202) Omrani et al. (2006)(285) Subtotal (I2 = 990·3 %, P = 0·000) Male Rabbani et al. (2009)(211) Hossein-Nezhad et al. (2009)(204) Gannage-Yared et al. (2000)(214) Charlton et al. (1996)(216) Moussavi et al. (2005)(209) Masoompour et al. (2008)(207) Subtotal (I2 = 99·6 %, P = 0·000) Overall (I2= 99·4 %, P = 0·000)
Note: weights are from random-effects analysis
Country
Distance from
the equator (°) Season
Age group Number of participants ES (95% CI) Weight (%)
Fig. 6. Forest plot for the Middle East/Africa region stratified by sex. ES, effect estimator. (A colour version of this figure can be found online at http://www. journals.cambridge.org/bjn)
Table 2. Effect estimators (ES) from the meta-analyses stratified by age and region* (ES and 95 % confidence intervals)
Regions I2(%) n (studies) n (participants) ES 95 % CI
Europe Children/adolescents (. 1 – 17 years) 99·5 6 1816 50·56 34·35, 66·77 Adults (. 17 – 65 years) 99·4 35 28 844 52·98 45·01, 56·58 Elderly (. 65 years) 99·4 30 10 894 51·74 45·81, 57·66 North America Children/adolescents (. 1 – 17 years) 98·5 3 993 78·35 59·44, 97·25 Adults (. 17 – 65 years) 99·7 8 6201 71·83 57·71, 86·00 Elderly (. 65 years) 99·3 15 5307 71·70 64·84, 78·57 Asia/Pacific Children/adolescents (. 1 – 17 years) 85·4 3 899 31·89† 24·94, 38·84 Adults (. 17 – 65 years) 99·5 13 3709 67·99 59·73, 76·25 Elderly (. 65 years) 98·8 9 4965 66·16 62·16, 70·22 Middle East/Africa Children/adolescents (. 1 – 17 years) 99·2 6 1913 75·41† 56·43, 94·38 Adults (. 17 – 65 years) 98·5 6 2079 34·66 29·32, 40·01 Elderly (. 65 years) 99·2 4 874 38·20 29·15, 47·25
* Meta-analyses were not conducted for studies carried out in Latin America due to the limited number of eligible studies. † Values were significantly different from those of the other age groups.
J. Hilger et al. 36