Crowdsourcing facial responses to
online videos: Extended abstract
The MIT Faculty has made this article openly available.
Please share
how this access benefits you. Your story matters.
Citation
McDuff, Daniel, Rana el Kaliouby, and Rosalind W. Picard.
“Crowdsourcing Facial Responses to Online Videos: Extended
Abstract.” 2015 International Conference on Affective Computing
and Intelligent Interaction (ACII), Xi'an, China, 21-24 September,
2015. IEEE, 2015. 512–518.
As Published
http://dx.doi.org/10.1109/ACII.2015.7344618
Publisher
Institute of Electrical and Electronics Engineers (IEEE)
Version
Author's final manuscript
Citable link
http://hdl.handle.net/1721.1/110774
Terms of Use
Creative Commons Attribution-Noncommercial-Share Alike
Crowdsourcing Facial Responses to Online Videos:
Extended Abstract
Daniel McDuff
∗, Rana el Kaliouby
∗and Rosalind W. Picard
†∗ Affectiva
Waltham, MA 02452, USA
Email: {daniel.mcduff, kaliouby}@affectiva.com
†Media Lab, Massachusetts Institute of Technology, MA 02139, USA
Email: picard@media.mit.edu
Abstract—Traditional observational research methods required an experimenter’s presence in order to record videos of partic-ipants, and limited the scalability of data collection to typically less than a few hundred people in a single location. In order to make a significant leap forward in affective expression data collection and the insights based on it, our work has created and validated a novel framework for collecting and analyzing facial responses over the Internet. The first experiment using this framework enabled 3,268 trackable face videos to be collected and analyzed in under two months. Each participant viewed one or more commercials while their facial response was recorded and analyzed. Our data showed significantly different intensity and dynamics patterns of smile responses between subgroups who reported liking the commercials versus those who did not. Since this framework appeared in 2011, we have collected over three million videos of facial responses in over 75 countries using this same methodology, enabling facial analytics to become significantly more accurate and validated across five continents. Many new insights have been discovered based on crowd-sourced facial data, enabling Internet-based measurement of facial responses to become reliable and proven. We are now able to provide large-scale evidence for gender, cultural and age differences in behaviors. Today such methods are used as part of standard practice in industry for copy-testing advertisements and are increasingly used for online media evaluations, distance learning, and mobile applications.
I. INTRODUCTION
The face is one of the richest sources of communicating af-fective and cognitive information [1]. In relation to advertising it has been shown that facial expressions exhibited in viewers while watching commercials can predict strength of recall of the commercial [2], skipping behavior [3] and purchase intent [4], [5]. The face has been described as the window to the soul, to quote Cicero (circa 100 b.c.) ‘Ut imago est animi voltus sic indices oculi’ (the face is a picture of the mind as the eyes are its interpreter).
Online and mobile video is the fastest growing medium in
history1. In 2011, when we first launched this methodology,
178 million people or 85.6% of the US internet audience watched more than 6.2 billion videos per month. In 2014 188
million Americans watched 46.6 billion videos per month2.
Following this shift in consumer behavior, marketers are
1http://www.wpp.com/wpp/press 2 http://www.comscore.com/Insights/Press-Releases/2014/4/comScore-Releases-March-2014-US-Online-Video-Rankings MEDIA Video of webcam footage stored Video processed to calculate smile intensity REPORT 3. 4. 5. 6.
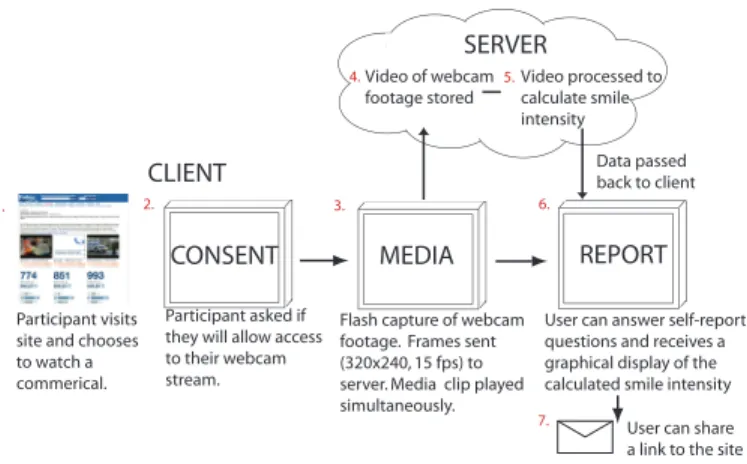
Flash capture of webcam footage. Frames sent (320x240, 15 fps) to server. Media clip played simultaneously.
SERVER
CLIENT
7.
User can answer self-report questions and receives a graphical display of the calculated smile intensity
CONSENT
2.
Participant asked if they will allow access to their webcam stream.
User can share a link to the site Data passed back to client
1.
Participant visits site and chooses to watch a commerical.
Fig. 1: Overview of what the user experience was like and Affectiva’s (www.affectiva.com) web-based framework that was used to crowdsource the facial videos. From the viewer’s perspective, all that is needed is a browser with Flash support and a webcam. The video from the webcam is streamed in real-time to a server where automated facial expression analysis is performed, and the results are rendered back to the browser for display. All the video processing was done on the server side. This framework is now deployed globally and has been used to collect and analyze over three million videos. moving advertising spending to online video, with over $1 billion in annual global video marketing spending in 2011. The total spending has now risen to $5.75 billion.
With so much content out there competing for the viewer’s eyeballs, there is an increasing desire for content creators, marketers and advertisers to objectively measure engagement with content. In addition, brands are increasingly striving to build emotional connections with consumers, while mar-keters are struggling to objectively measure their success. In advertising, the emotional response of viewers has been shown to influence attitude to both the commercial and the brand [6] as well as the engagement of viewers [3]. However, most of these studies are performed in laboratory settings, which, in addition to being time-consuming and costly, leads to an unnatural setting for participants. Setting may heavily influence how people experience and engage with content, with real-world contexts producing different facial behavior than expected from lab studies [7]. This may be due to the
subject being restricted in terms of motion, or limited due to social expectations, or simply affected by an unfamiliar room, device or people [8]. As an example, Fridlund [9] shows that viewer’s responses to videos are influenced by context, responses in social situations are heightened when compared to responses in non-social settings. Furthermore, this effect occurs even when the sociality of the situation is implicit. In this study the participants were in everyday settings and were aware that they were being recorded, which might have caused a certain amount of behavior change; however, their everyday environment is expected to be more comfortable and familiar for them than a test laboratory. Thus, our framework enables the data to more closely reflect the real consumption environment for viewing Internet advertisements.
Traditionally consumer testing of video advertising, whether TV or Internet, has been conducted in laboratory settings [3], [10] where self-report is the standard measure of affect: People are interviewed or asked to rate their feeling on a Likert scale or turn a dial to quantify their state. While convenient and inexpensive, self-report is problematic because it is subject to biasing from the interviewer, the context and other factors of little relevance to the stimulus [11]. The act of introspection is challenging to perform in conjunction with another task and may in itself alter that state [12]. Unlike self-report, facial expressions are implicit and do not interrupt a person’s experience. In addition, facial expressions are continuous and dynamic, allowing for a representation of how affect changes over time. Collecting video data of naturalistic facial responses is challenging. Traditional laboratory data collection requires an experimenter to be present in order to record the responses of the subject, severely limiting scalability. In our paper Crowdsourcing Facial Responses to Online Videos, we presented results validating a first-in-the-world framework for collecting and analyzing ecologically valid facial responses to media content over the Internet. Since 2011, we have deployed this methodology globally and at scale. We have collected over three million face videos in response to thousands of media clips ranging from advertisements to movie trailers to TV shows and political debates.
The main contribution of this paper is to present the new corpus of data collected, and provide analysis and results from the first-in-the-world crowdsourcing of facial responses over the web. We show that despite significant individual differences in responses and challenging real world data we are able to distinguish significant patterns within the results and relate these to difference in self-report measures. We believe that this new method of collecting and analyzing facial video can provide unobtrusive evaluation of facial responses to media content without relying on self-report ratings. It also has the potential to truly accelerate research in automated understanding of facial expressions and gestures by allowing the collection of huge corpuses of naturalistic and spontaneous data. We show that the method can also provide a mechanism to ask entirely new research questions, and to answer those questions with data that is ecologically valid. We present a massive (by 2011 standards) dataset, collected via the
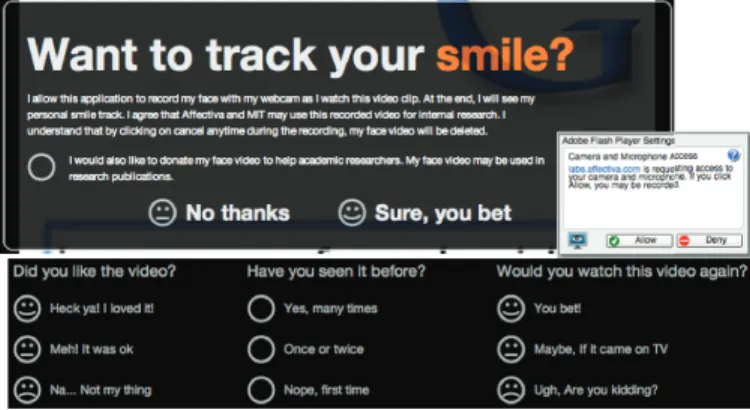
Fig. 2: Screen shots from the website created to collect the data. Top) The consent form that participants were presented with before taking part in the study. Bottom) The self-report questions participants answered following each commercial. Internet in 54 days, containing 3,268 videos captured in natural environments whilst the viewers were presented with public stimuli, one of three commercials.
II. CROWDSOURCINGPLATFORM
Figure 1 shows the web-based framework that was used to crowdsource the facial videos and the user experience. The website was promoted on Forbes.com for the first day that it was live. Visitors may have found it via this route, a search engine or a shared link. Visitors to the website opt-in to watch short videos while their facial expressions are being recorded and analyzed. Immediately following each video, visitors get to see where they smiled and with what intensity. They can compare their “smile track” to the aggregate smile track. On the client-side, all that is needed is a browser with Flash support and a webcam. The video from the webcam is streamed in real-time at 15 frames a second at a resolution of 320x240 to a server where automated facial expression analysis is performed, and the results are rendered back to the browser for display. There is no need to download or install anything on the client side, making it very simple for people to participate. Furthermore, it is straightforward to easily set up and customize experiments to enable new research questions to be posed. For our first experiment, we chose three successful Super Bowl commercials: 1. Doritos (“House sitting”, 30 s), 2. Google (“Parisian Love”, 53 s) and 3. Volkswagen (“The Force”, 62 s). Large sums of money are spent on Super Bowl commercials and as such their effectiveness is of particular interest. All three ads were somewhat amusing and were designed to elicit smile or laughter responses. Results showed that significant smiles were present in 71%, 65% and 80% of the responses to the respective ads.
On selecting a commercial to watch, visitors are asked to 1) grant access to their webcam for video recording and 2) to allow Affectiva and MIT to use the facial video for internal research. Further consent for the data to be shared with the research community at large is also sought, and only videos with consent to be shared publicly are shown in this paper. This data collection protocol was approved by the Massachusetts
Fig. 3: Map showing the location of the 3,268 viewers, based on their IP address. No viewers IP was located outside of the latitudes shown.
Institute of Technology Committee On the Use of Humans as Experimental Subjects (COUHES) prior to launching the site. A screenshot of the consent form is shown in Figure 2. If consent is granted, the commercial is played in the browser whilst simultaneously streaming the facial video to a server. In accordance with MIT COUHES, viewers could opt-out at any point while watching the videos, in which case their facial video was immediately deleted from the server. If a viewer watches a video to the end, then his/her facial video data is stored along with the time at which the session was started, its IP address, the ID of the video they watched, and responses (if any) to the self-report questions. No other data is stored.
Following each commercial, the webcam is automatically stopped and a message clearly states that the “webcam has now been turned off”. Viewers could then optionally answer three multiple choice questions: “Did you like the video?”, “Have you seen it before?” and “Would you watch this video again?” A screenshot of the questions is shown in Figure 2. Finally, viewers were provided with a graphical representation of their smile intensity during the clip compared to other viewers who watched the same video; viewers were also given the option to tweet their result page or email it to a friend. All in all, it took under 5 seconds to turn around the facial analysis results once the video was completed so viewers perceived the results as instantaneous. Viewers were free to watch one, two or three videos and could watch a video as many times as they liked.
III. DATACOLLECTION
Using the framework described we collected 3,268 videos (2,615,800 frames) over a period of 54 days from 03/03/2011 to 04/25/2011. The application was promoted on the Forbes website [13]. We refer to the data collected as the Forbes dataset. We don’t know how many viewed the site but the number of visitors who clicked a video was 16,366. Of these 7,562 (46.2%) had a webcam, had a computer that met the system requirements and opted-in to allow webcam access. A total of 5,268 (32.2%) completed the experiment. For the analysis here we disregard videos for which the Nevenvision tracker was unable to identify a face in at least 90% of frames; this left 3,268 videos (20.0%). All videos were recorded with a resolution of 320x240 and a frame rate of 15 fps.
A. Demographics
We use IP information to provide statistics on the locations of viewers by finding the latitude and longitude corresponding to each address. Statistics for gender and facial hair were obtained by a labeler who watched the videos. IP addresses have been shown to be a reliable measure of location [14].
The IP address geo-location was performed using IPInfoDB3.
We could not guarantee that the same viewer would watch all three of the commercials or that some may watch them more than once. As we do not have identifiable information from the viewers and we do not have the number of distinct viewers who took part, only a coarse calculation can be provided by the number of distinct IP addresses 1,495 (45.8%). This suggests that on average each location successfully completed the task for two viewings. A majority of the viewers were located in North America and Europe. The geographic location of each of the viewers is shown in Figure 3.
Of the 3,268 videos, 1,121 (34.3%) featured females as the main subject. The age of viewers was restricted to those over the age of 13 or with a parent or legal guardian’s consent. In 924 (28.3%) of the videos the viewer was wearing glasses. In 664 (20.3%) of the videos the viewer had some form of facial hair. Both glasses and facial hair are likely to introduce some degree of error in the feature tracking.
IV. SMILEDETECTION ANDDYNAMICS
The Nevenvision facial feature tracker4 was used to
auto-matically detect the face and track 22 facial feature points within each frame of the videos. To compute the smile probability measure we used a custom algorithm developed by Affectiva. This tracks a region around the mouth using the facial feature tracker and computes Local Binary Pattern (LBP) [15] features within this region. The segmented face images were rescaled to 120x120 pixels, with the region around the mouth 32x64. An affine warp was performed on the bounded face region to account for in-planar head movement. An ensemble of bagged decision trees is used for classification. SVMs and Gabor Energy filters have been shown to perform well on smile detection [16] but we found that the bagged decision tree classifier using LBP features has better performance. The classifier outputs a probability that the expression is a smile. A smile probability value between (0 to 1) is calculated for every frame in which a face was tracked, yielding a one-dimensional smile track for each video. We refer to the classifier output as the smile intensity.
The smile classifier was trained on examples from the CK+
and MPL-GENKI5 databases. All frames were were labeled
for smile vs. non-smile by coders. We tested the classifier on 3,172 frames from the CK+ database (the test videos were not included in the training set). The area under the resulting ROC curve is 0.98. We also tested how well the smile classifier performs on crowdsourced face videos from a webcam where
3http://www.ipinfodb.com/ip location api.php
4Licensed from Google, Inc.
5 10 15 20 25 0 Time (s) 5 10 15 20 25 0 Time (s) 5 10 15 20 25 0 Time (s) 0 0.1 0.2 0.3 0.1 0.2 0.3
Meh. It was ok. N = 206 Heck ya! I loved it! N = 230 Na... Not my thing. N = 62
N o rma lise d n o . o f ma x a n d mi n in te n si ty p e a ks 0 0 0.1 0.2 0.3 0.4 0.5 0.6 Me a n Smi le I n te n si ty 5 10 15 20 25 30 Time (s)
Na... Not my thing. N = 62 Meh. It was ok. N = 206 Heck ya! I loved it! N = 230
(a) Doritos 0 5 10 15 20 25 30 0 0.1 0.2 0.3 0.4 0.5 0.6 Time (s) Me a n Smi le I n te n si ty
Na... Not my thing. N = 62 Meh. It was ok. N = 206 Heck ya! I loved it! N = 230
10 20 30 40 50
0
Time (s) Time (s) Time (s)
0 0.1 0.2
0.1
0.2
Meh. It was ok. N = 290 Heck ya! I loved it! N = 265
Na... Not my thing. N = 67
10 20 30 40 50 0 0 10 20 30 40 50 0 5 10 15 20 25 30 35 40 45 50 0 0.1 0.2 0.3 0.4 0.5 0.6 Time (s) Me a n Smi le I n te n si ty
Na... Not my thing. N = 67 Meh. It was ok. N = 290 Heck ya! I loved it! N = 265
N o rma lise d n o . o f ma x a n d mi n in te n si ty p e a ks
Na... Not my thing. N = 67 Meh. It was ok. N = 290 Heck ya! I loved it! N = 265
(b) Google 0 5 10 15 20 25 30 0 0.1 0.2 0.3 0.4 0.5 0.6 Time (s) Me a n Smi le I n te n si ty
Na... Not my thing. N = 62 Meh. It was ok. N = 206 Heck ya! I loved it! N = 230
10 20 30 40 50
0
Time (s) Time (s) Time (s)
0 0.1 0.2
0.1
0.2
Meh. It was ok. N = 154 Heck ya! I loved it! N = 461
Na... Not my thing. N = 35
600 10 20 30 40 50 600 10 20 30 40 50 60 0 10 20 30 40 50 60 0 0.1 0.2 0.3 0.4 0.5 0.6 Time (s) Me a n Smi le I n te n si ty
Na... Not my thing. N = 35 Meh. It was ok. N = 154 Heck ya! I loved it! N = 461
N o rma lise d n o . o f ma x a n d mi n in te n si ty p e a ks
Na... Not my thing. N = 35 Meh. It was ok. N = 154 Heck ya! I loved it! N = 461
(c) Volkswagen
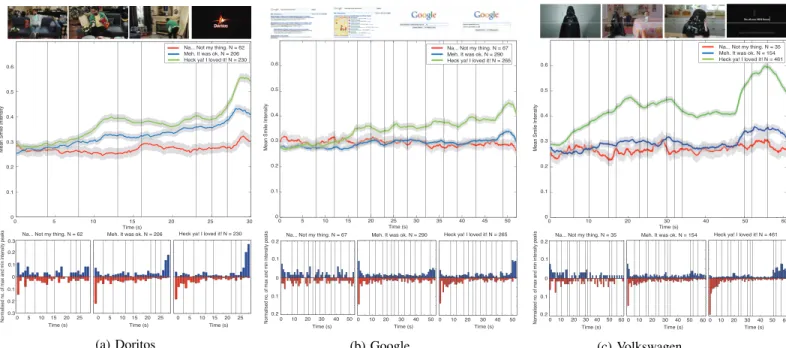
Fig. 4: There are significant differences in the smile responses between people that reported liking the ads more than others. The mean smile intensity and standard error whilst watching the ad for the three self-report classes (top). Histograms of the maximum (blue) and minimum (red) smile intensity peak locations whilst watching the ads for the three self-report classes. there was no control on the quality of the resulting face videos
(these videos were from a similar but different study to the one described here). A set of 247,167 frames were randomly selected for ground truth labeling. Three labelers labeled each video and the majority label was taken. The area under the resulting ROC curve is 0.90. The performance of the smile classifier degrades with the uncontrolled videos compared to the CK+; however it is still very accurate. The data contained examples with a large variation in head position and pose.
Since, this paper was published we have grown the size of our training data set considerably to include over 30,000 video segments manually annotated by FACS-certified experts label-ing videos from webcams deployed in natural settlabel-ings across the world. The diversity and size of the training set have led to considerable improvements in the classifier performance [17], [18]. We found the area under the ROC curve for our smile classifier rose from 0.90 to 0.95 when using 500 and 40,000 positive training examples respectively [18]. In these tests the test data comprised of challenging unconstrained webcam videos. We have also build classifiers for many more AUs. These classifiers work well even on low-resolution and poorly-lit webcam videos.
V. RESULTS ANDDISCUSSION
Following each commercial, viewers could optionally an-swer three multiple choice questions: “Did you like the video?” (liking), “Have you seen it before?” (familiarity) and “Would you watch this video again?” (rewatchability). We examined the relationship between the smile responses and the self-report responses for each question. Since viewers were not obligated to complete the responses and the questions “timed out” once the smile response was computed, we do
not have responses from all viewers to all the questions. On average each question was answered by 45.6% of viewers, which still provides almost 500 examples for each question and commercial combination.
Liking. Figures 4 (a) - (c) show the mean smile intensities, with standard error (SE) bars, for each of the three ads broken down by self-report of liking. SE is calculated as:
SE = √σ
n (1)
Where σ is the standard deviation of the samples and n is the number of samples (viewers). The vertical lines on the plots indicate the timings of the scenes within the commercials. Below each graph are shown histograms of the timings of the maximum and minimum smile peaks for each of the three self-report classes. There is a time period at the start of the clips during which the distributions of smile intensities are very similar for each self-report class. This period lasts for 8 secs (27% of the clip length) for the Doritos commercial, 16 secs (30% of the clip length) for Google and 5 secs (8% of the clip length) for the Volkswagen commercial.
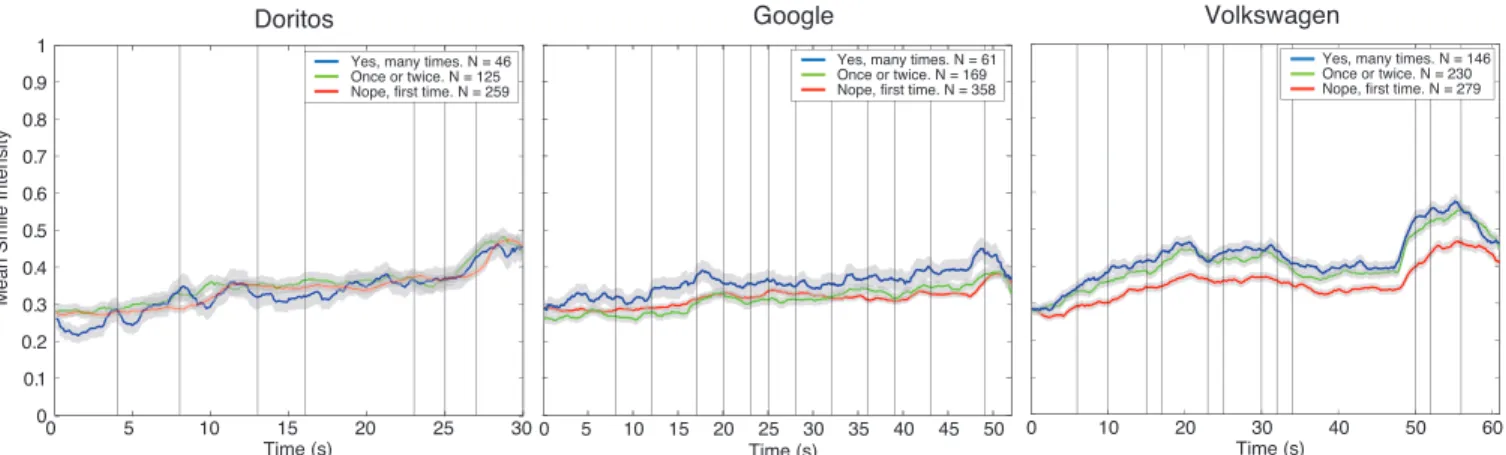
Familiarity. Figures 5 show the mean smile intensities, with standard error bars, for each of the three ads broken down by self-report of familiarity. The only significant difference in response is for the Volkswagen ad, where viewers watching for the first time show lower mean smile intensity compared to those who have watched it before.
Rewatchability. The responses to the question “Did you like the video?” and the question “Would you like to watch this video again?” were related. The smile responses categorized by responses to the question “Would you like to watch this video again?” were similar to the responses categorized by responses to the question “Did you like the video?”.
A. Discussion
There was considerable variability in the responses, due to individual differences in responses. There are consistent trends showing that on aggregate self-reported liking correlates highly with increased smile intensity, particularly in the case of the Doritos and Volkswagen commercials. As expected the largest difference across the three commercials was between the “Na...not my thing” responses and “Heck ya! I loved it!” responses, smile intensity being significantly different in over 88% of the frames across the three commercials. This supports our intuition and suggests that smile responses to this class of commercial, intentionally amusing commercials, can be used as an effective measure of predicting viewers self-reported lik-ing without havlik-ing to actually ask them. The smile tracks also provide a much finer level of resolution and avoid the cognitive load associated with self-report measures [19]. For instance, without a time consuming self-report questionnaire it would have not been possible to identify if the participants liked each part of the commercial equally as much or responded more strongly during certain scenes. However, in the behavioral response we can identify when the peaks occur. This analysis allows us to unveil interesting timing information.
However, it is possible that the distinction viewers made between the labels “Na...not my thing” and “Meh! It was ok” was not strong enough as for two of the three commercials those that report the commercial as “ok” showed statistically similar results to those that report it as “not my thing”. Likert scales could be used to replace these labels in future studies. The difference in smile intensity for the three different classes does not occur immediately but there is a time period at the start of the clips during which the distributions are very similar, up to 16 seconds for the Google ad. Suggesting it takes time for liking or disliking of an ad to become apparent.
Considering the position of the maximum and minimum smile intensity peaks within the responses we can see that there is greater coherence in the responses (more consistently showing greatest smile intensity at the same points) for those that report the commercials were not their thing when com-pared to the groups who reported liking the commercials. Assuming that one of the advertiser’s intentions was to create a commercial that consumers like, these results suggest that the latter group “got” the intended message of the commercial. With regard to familiarity, the only significantly different trend exists between those that were seeing the Volkswagen commercial for the first time and those that were not. The mean smile intensity for those that were watching it for the first time was lower. The results suggest that the affective impact of the advertisement increased upon multiple viewing. Interestingly, the Volkswagen commercial was the only one of the three tested here that went viral on the Internet and
has subsequently received awards6. Inducing positive and
consistently strong responses in viewers is one of the potential reasons for the advertisement going viral: our data support the conclusions of Berger and Milkman [20]. There are a number
6http://www.adweek.com/
of other explanations for this difference, for instance that those that chose to watch the commercial for a second or third time may have chosen it because they liked it. However, since there is not a significant difference in the other two videos it would suggest that there is something unique about the VW ad. The results show that on repeated VW ad viewings a strong response is still obtained; perhaps more importantly, the dynamics of the smiles are still present. Biel [21] identifies that one of the main reasons why “likeability” might be such a key indicator of a commercials success is that if it is well liked people may be willing to watch it again. In our study we asked participants after the clip whether they would like to see the clip again. These reports were highly correlated with the strength of their self-reported liking.
VI. DEVELOPMENTS
Since 2011 we have collected over three million facial video responses from across the world to over fourteen thousand pieces of media content using the approach presented in this paper. This type of data collection would have been infea-sible using traditional research techniques, where manually coding the facial responses would have taken hundreds of thousands of hours. A subset of the data collected in this study is available via the Affectiva-MIT Facial Expression Dataset (AMFED) [22]. The data is FACS-coded and had been made available to help accelerate research on spontaneous facial expressions. To date almost 100 research groups have requested and received access to the data.
The measurement of facial responses to content is now a standard procedure in copy-testing of advertising content; it is used on a daily basis to help evaluate whether an advertisement is achieving its intended goals. Many companies now use this methodology to test their content, including MARS, Kellogg’s, Unilever and CBS. Unilever now tests every ad the company develops with this technology (over 3000 ads annually). Fig-ure 6 shows an example image of an ad “dashboard” used for qualitatively and quantitatively evaluating an ad. The insights that are drawn from these results are regularly used to make business decisions. Furthermore, data collection can now be performed via mobile devices (tablets and cellphone) allowing us to collect further challenging real-world examples of facial expressions - even when people are outside and moving about. Collecting data in this fashion does present challenges. The primary challenge is reduced control over the experimental protocol. It is challenging to ensure that the participants pay attention to the stimuli. There may be other people present and the participants may be eating or talking. However, in a large majority of the cases our data show that distractions are minimal. As the responses are recorded in everyday settings they tend to be highly naturalistic and these data act as a complement to more controlled lab-based studies.
In addition to the commercial deployment, several aca-demic studies have used our Internet-based data collection method [23], [24], [4], [5]. Teixeira et al. [4] tested 82 ads and found that the entertainment an ad causes (quantified as smiling behavior) affects purchases. The main finding was that
0 10 20 30 40 50 60 Time (s) 0 5 10 15 20 25 30 35 40 45 50 Time (s) 0 5 10 15 20 25 30 0 0.1 0.2 0.3 0.4 0.5 0.6 0.7 0.8 0.9 1 Time (s) Me a n Smi le I n te n si ty
Yes, many times. N = 61 Once or twice. N = 169 Nope, first time. N = 358
Yes, many times. N = 146 Once or twice. N = 230 Nope, first time. N = 279
Doritos Google Volkswagen
Yes, many times. N = 46 Once or twice. N = 125 Nope, first time. N = 259
Fig. 5: Graph showing the mean smile intensity and standard error whilst watching the three ads for the three familiarity classes responding to “Have you seen it before?”, Doritos (left), Google (middle), Volkswagen (right).
Fig. 6: An example “dashboard” used for qualitatively and quantitatively evaluating an ad (www.affectiva.com). Internet-based measurement of facial responses to content is now routinely used in advertisement copy-testing.
entertainment has an inverted U-shape relationship to purchase intent (i.e. inducing smiling increases purchase intent but too much smiling has a detrimental impact). McDuff et al. [5] tested 170 ads and found that facial responses were predictors of changes in purchase intent and ad liking. McDuff et al. [24] recorded responses to election debate clips and showed that candidate preferences could be predicted from facial action responses. Our data repository is highly spontaneous and cross-cultural. It presents a unique opportunity to study many aspects of the expression of emotion including gender, cultural, and age differences.
VII. CONCLUSION
We have presented results from the first crowdsourced collection of natural and spontaneous facial responses over the web. The framework allows very efficient collection of examples of natural and spontaneous responses from a large and varied population. In less than two months we collected 5,268 videos from around the world, of which 3,268 were trackable in over 90% of the frames. The responses are aligned with stimuli that were simultaneously presented to the
partic-ipants. The method did not require payment or recruitment of the viewers but rather used popular media to motivate opt-in participation. The method has enabled new research questions to be answered in a scalable and ecologically valid way. The data have further potential to allow exploration of cross-cultural differences and more.
Our system analyzed the responses of people to three inten-tionally amusing commercials. We have shown that automated analysis of facial responses yields results coherent with self-reports while also providing greater time and intensity reso-lution. We have shown significant differences in the intensity and dynamics of smile responses between those that report not liking a particular commercial and those that report liking it. One of the commercials showed significantly increased smile intensity in the responses of those that were viewing it more than once. This was also the only commercial to “go viral”.
Since 2011 we have recorded responses to thousands of videos from over 75 countries, including responses to TV ads from around the world, political debates and speeches, TV pilots, movie trailers and educational content. These have allowed us to collect a vast range of naturalistic of facial responses. Thousands of human-coded naturalistic examples of facial actions have allowed us to significantly improve the accuracy of classifiers that perform well even on low-resolution and poorly-lit videos.
This paper validated the framework for crowd sourcing emotional responses, which beyond this experiment, enables numerous research questions to be tackled around automated facial expression recognition as well as understanding the meaning of facial expressions in different contexts. While in this paper we limited the content to amusing commercials in order to induce a significant number of smile responses, we have since tested content that elicits a wider range of affective responses, including disgust, sadness, confusion, and more. The algorithms trained on the massive data sets have been made available now to run real-time in mobile devices, where new opportunities continue to grow – ranging from helping people with special needs for reading facial expressions, to enabling new kinds of robot, wearable, and interactive applications to become more emotionally intelligent.
REFERENCES
[1] P. Ekman, W. Freisen, and S. Ancoli, “Facial signs of emotional experience.” Journal of Personality and Social Psychology, vol. 39, no. 6, p. 1125, 1980.
[2] R. Hazlett and S. Hazlett, “Emotional response to television commer-cials: Facial emg vs. self-report,” Journal of Advertising Research, vol. 39, pp. 7–24, 1999.
[3] T. Teixeira, M. Wedel, and R. Pieters, “Emotion-induced engagement in internet video ads,” Journal of Marketing Research, vol. 49, no. 2, pp. 144–159, 2010.
[4] T. Teixeira, R. Picard, and R. el Kaliouby, “Why, when, and how much to entertain consumers in advertisements? a web-based facial tracking field study,” Marketing Science, vol. 33, no. 6, pp. 809–827, 2014. [5] D. J. McDuff, R. El Kaliouby, J. F. Cohn, and R. Picard, “Predicting
ad liking and purchase intent: Large-scale analysis of facial responses to ads,” IEEE Transactions on Affective Computing, no. 1, pp. 1–1. [6] R. Batra and M. Ray, “Affective responses mediating acceptance of
advertising,” Journal of consumer research, pp. 234–249, 1986. [7] M. E. Hoque and R. Picard, “Acted vs. natural frustration and delight:
many people smile in natural frustration,” in Automatic Face & Ges-ture Recognition and Workshops (FG 2011), 2011 IEEE International
Conference on. IEEE, 2011.
[8] H. Gunes, M. Piccardi, and M. Pantic, “From the lab to the real world: Affect recognition using multiple cues and modalities,” Affective computing: focus on emotion expression, synthesis, and recognition, pp. 185–218, 2008.
[9] A. Fridlund, “Sociality of solitary smiling: Potentiation by an implicit audience.” Journal of Personality and Social Psychology, vol. 60, no. 2, p. 229, 1991.
[10] T. Teixeira, M. Wedel, and R. Pieters, “Moment-to-moment optimal branding in tv commercials: Preventing avoidance by pulsing,” Mar-keting Science, vol. 29, no. 5, pp. 783–804, 2010.
[11] N. Schwarz and F. Strack, “Reports of subjective well-being: Judgmen-tal processes and their methodological implications,” Well-being: The foundations of hedonic psychology, pp. 61–84, 1999.
[12] M. Lieberman, N. Eisenberger, M. Crockett, S. Tom, J. Pfeifer, and B. Way, “Putting feelings into words,” Psychological Science, vol. 18, no. 5, p. 421, 2007.
[13] Web address of data collection site:. [Online].
Avail-[13] Web address of data collection site:. [Online].
Avail-able: http://www.forbes.com/2011/02/28/detect-smile-webcam-affectiva-mit-media-lab.html
[14] D. Svantesson, “Geo-location technologies and other means of placing borders on the ‘borderless’ internet,” J. Marshall J. Computer & Info. L., vol. 23, pp. 101–845, 2004.
[15] T. Ojala, M. Pietikainen, and T. Maenpaa, “Multiresolution gray-scale and rotation invariant texture classification with local binary patterns,” Pattern Analysis and Machine Intelligence, IEEE Transactions on, vol. 24, no. 7, pp. 971–987, 2002.
[16] J. Whitehill, G. Littlewort, I. Fasel, M. Bartlett, and J. Movellan, “Toward practical smile detection,” Pattern Analysis and Machine In-telligence, IEEE Transactions on, vol. 31, no. 11, pp. 2106–2111, 2009. [17] D. McDuff, R. El Kaliouby, T. Senechal, D. Demirdjian, and R. Picard, “Automatic measurement of ad preferences from facial responses gath-ered over the internet,” Image and Vision Computing, vol. 32, no. 10, pp. 630–640, 2014.
[18] T. Senechal, D. J. McDuff, and R. El Kaliouby, “Facial action unit detection using active learning and an efficient non-linear kernel ap-proximation,” Under Review.
[19] K. Poels and S. Dewitte, “How to capture the heart? reviewing 20 years of emotion measurement in advertising,” Journal of Advertising Research, vol. 46, no. 1, p. 18, 2006.
[20] J. Berger and K. Milkman, “What makes online content viral?” Unpub-lished manuscript, University of Pennsylvania, Philadelphia, 2011. [21] A. Biel, “Love the ad. buy the product?” Admap, September, 1990. [22] D. McDuff, R. El Kaliouby, T. Senechal, M. Amr, J. F. Cohn, and
R. Picard, “Affectiva-mit facial expression dataset (am-fed): Naturalistic and spontaneous facial expressions collected” in-the-wild”,” in Com-puter Vision and Pattern Recognition Workshops (CVPRW), 2013 IEEE
Conference on. IEEE, 2013, pp. 881–888.
[23] C. T. Tan, D. Rosser, and N. Harrold, “Crowdsourcing facial expressions using popular gameplay,” in SIGGRAPH Asia 2013 Technical Briefs. ACM, 2013, p. 26.
[24] D. McDuff, R. El Kaliouby, E. Kodra, and R. Picard, “Measuring voter’s candidate preference based on affective responses to election debates,” in Affective Computing and Intelligent Interaction (ACII), 2013 Humaine
Association Conference on. IEEE, 2013, pp. 369–374