1
On-line Supplementary Appendices
Table S1 Forms of the self-rated health item in large-scale, national and international research survey infrastructures
Table S2 Forms of the self-rated health item in the Swiss Health Survey, with original wordings in German, French and Italian
Table S3 Coding schemes of response options of the self-rated health item
Appendix S4 Participants’ characteristics
Table S5 Distribution of health characteristics across three forms of self-rated health
Table S6 Percentages of explained variance of three forms of self-rated health, overall and with health dimensions, by four coding schemes, among men and women
Table S7 Association of self-rated health form 3, linearised coding scheme, with 30 health status variables
2
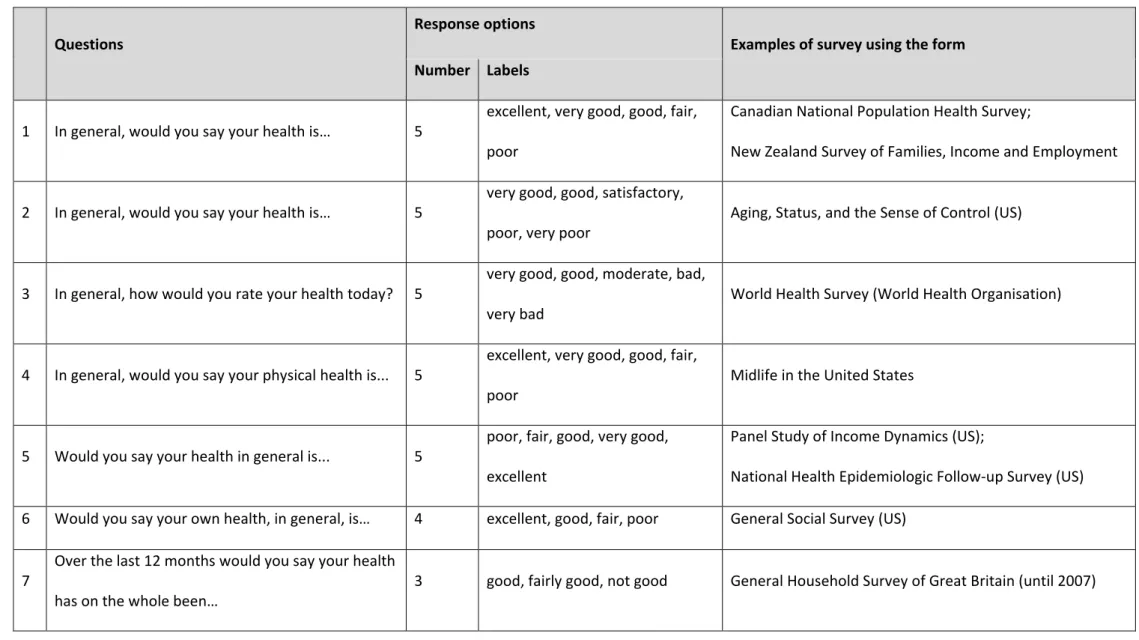
Table S1 Forms of the self-rated health item in large-scale, national and international, survey infrastructures
Questions Response options Examples of survey using the form
Number Labels
1 In general, would you say your health is… 5 excellent, very good, good, fair, poor
Canadian National Population Health Survey;
New Zealand Survey of Families, Income and Employment
2 In general, would you say your health is… 5 very good, good, satisfactory,
poor, very poor Aging, Status, and the Sense of Control (US)
3 In general, how would you rate your health today? 5 very good, good, moderate, bad,
very bad World Health Survey (World Health Organisation)
4 In general, would you say your physical health is... 5 excellent, very good, good, fair,
poor Midlife in the United States
5 Would you say your health in general is... 5 poor, fair, good, very good, excellent
Panel Study of Income Dynamics (US);
National Health Epidemiologic Follow-up Survey (US) 6 Would you say your own health, in general, is… 4 excellent, good, fair, poor General Social Survey (US)
7 Over the last 12 months would you say your health
3 8
Please think back over the last 12 months about how your health has been. Compared to people of your own age, would you say that your health has on the whole been...
5 excellent, good, fair, poor, very
poor British Household Panel Survey
9 How is your health in general? Is it... 5 very good, good, fair, bad, very bad
European Health Interview Survey; Health Survey for England;
General Household Survey of Great Britain (since 2008) Health Interview Survey (Belgium);
European Community Household Panel; European Social Survey
10 How would you describe your current health: 5 very good, good, satisfactory,
poor, bad German Socio-Economic Panel
11 How would you describe your health compared to
that of other people your age? 4 excellent, good, fair, poor China Health and Nutrition Survey 12 How would you rate your health in general? 4 excellent, good, fair, poor Australian longitudinal panel study
4 13 How would you rate your health at the present
time? Would you say it is...? 5
excellent, very good, good, fair,
poor American's Changing Lives
14 How do you assess your general health? 5 very good, good, fair, poor, very
poor Swedish Survey of Living Conditions
15 Compared to other people your age, how would
you describe your health? 5
very poor, poor, fair, good,
excellent National Survey of Families and Households (US)
16 We are now going to talk about various aspects of your health. How do you feel right now? 5
very well, well, so so, not very
5
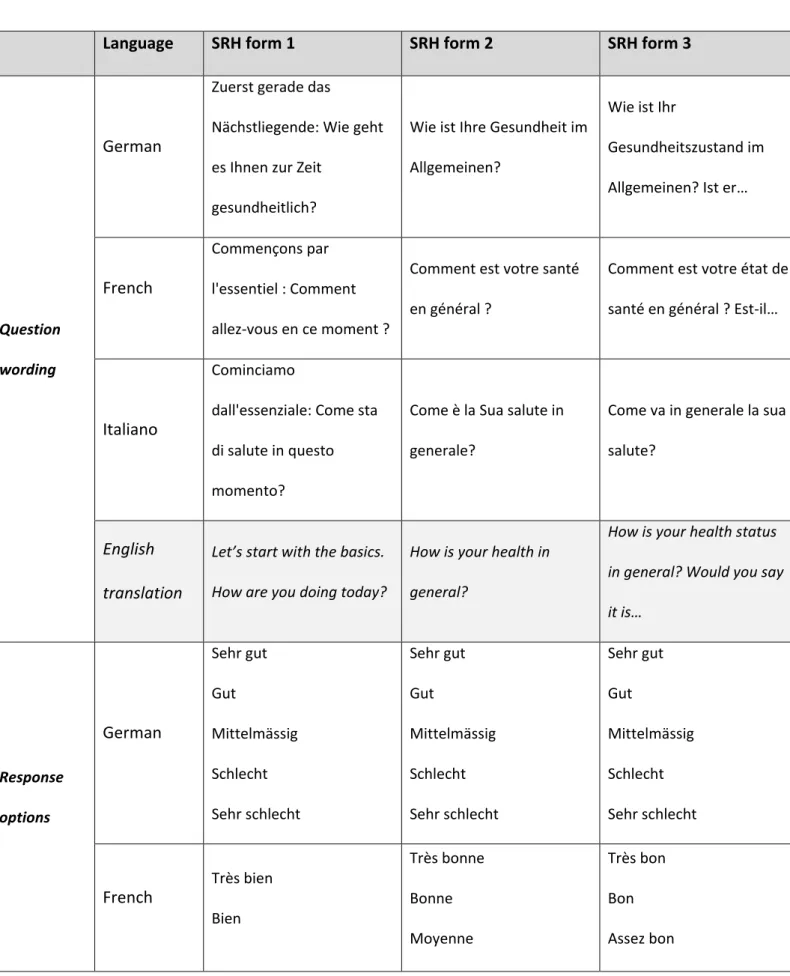
Table S2 Forms of the self-rated health item in the Swiss Health Survey, with original wordings in German, French and Italian
Language
SRH form 1
SRH form 2
SRH form 3
Question wording
German
Zuerst gerade das
Nächstliegende: Wie geht es Ihnen zur Zeit
gesundheitlich?
Wie ist Ihre Gesundheit im Allgemeinen?
Wie ist Ihr
Gesundheitszustand im Allgemeinen? Ist er…
French
Commençons par l'essentiel : Comment allez-vous en ce moment ?
Comment est votre santé en général ?
Comment est votre état de santé en général ? Est-il…
Italiano
Cominciamo
dall'essenziale: Come sta di salute in questo momento?
Come è la Sua salute in generale?
Come va in generale la sua salute?
English
translation
Let’s start with the basics. How are you doing today?
How is your health in general?
How is your health status in general? Would you say it is… Response options
German
Sehr gut Gut Mittelmässig Schlecht Sehr schlecht Sehr gut Gut Mittelmässig Schlecht Sehr schlecht Sehr gut Gut Mittelmässig Schlecht Sehr schlechtFrench
Très bien Bien Très bonne Bonne Moyenne Très bon Bon Assez bon6 Comme ci, comme ça (moyen) Mal Très mal Mauvaise Très mauvaise Mauvais Très mauvais
Italiano
Molto bene Bene Mediamente Non molto bene Male Molto buona Buona Normale Scadente Molto scadente Molto bene Bene Discretamente Male Molto maleEnglish
translation
Very good Good Okay (Moderate) Bad Very bad Very good Good Moderate Bad Very bad Very good Good Relatively good Bad Very badIn form 1, the question was worded “Let’s start with the basics. How are you doing today?” and
response options were very good, good, okay (moderate), bad, very bad. This form was
administered in waves 1992, 1997, and 2002. For the main analyses, we used wave 2002. In
sensitivity analyses, we pooled waves 1992, 1997, and 2002 together to check if results changed.
In form 2, self-rated health was worded “How is your health in general?”, with response options
including “very good, good, moderate, bad, very bad”. This form was administered in 2007. In
form 3, the question was “How is your health status in general? Would you say it is...”, and the
answers were “very good, good, relatively good, bad, very bad”. This form was administered in
2012. The framing of the question was thus different between form 1 versus forms 2 and 3. In
form 1, the question asked respondents to rate how their current state is (“how are you doing
7
today?”). In forms 2 and 3, the question asked respondents to rate their “health in general” (form
2) and their “health status in general” (form 3) (Table S2). Thus, form 1 addressed respondents’
well-being status, while forms 2 and 3 addressed the concept of respondents’ health. Another
important difference is that form 2 mentions “health”, while form 3 mentions “health status”.
Response options were different across forms due to the wording of the question. In form 1,
respondents rated their status with adverbs of manner. In form 2 and 3, respondents rated their
status with adjectives. Also, forms 1 and 2 have two positive and two negative options separated
by a neutral one, when form 3 has three shades of positive against two negative options.
8
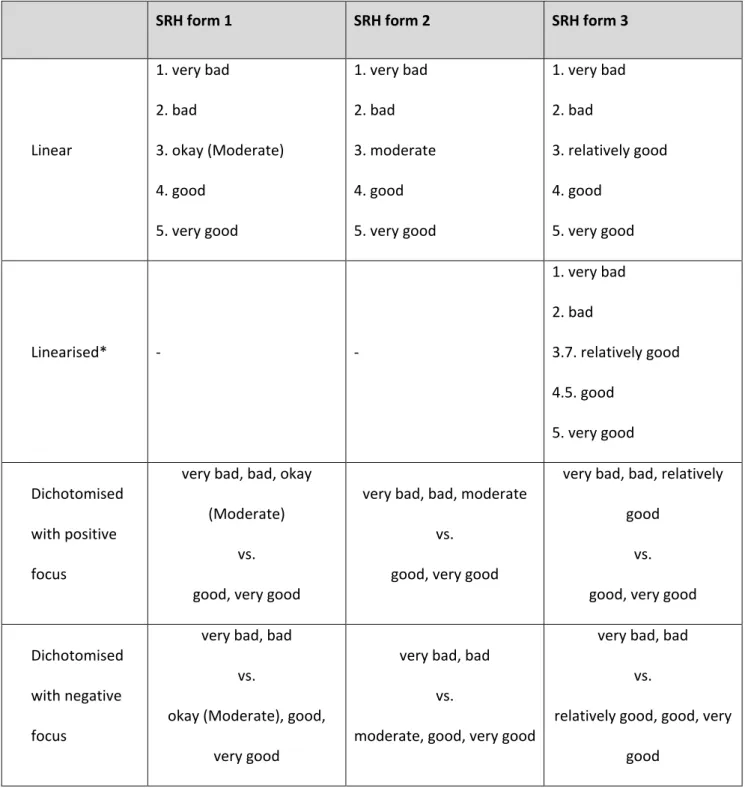
Table S3 Coding schemes of response options of the self-rated health item
SRH form 1 SRH form 2 SRH form 3
Linear 1. very bad 2. bad 3. okay (Moderate) 4. good 5. very good 1. very bad 2. bad 3. moderate 4. good 5. very good 1. very bad 2. bad 3. relatively good 4. good 5. very good Linearised* - - 1. very bad 2. bad 3.7. relatively good 4.5. good 5. very good Dichotomised with positive focus
very bad, bad, okay (Moderate)
vs. good, very good
very bad, bad, moderate vs.
good, very good
very bad, bad, relatively good
vs. good, very good
Dichotomised with negative focus
very bad, bad vs.
okay (Moderate), good, very good
very bad, bad vs.
moderate, good, very good
very bad, bad vs.
relatively good, good, very good
Abbreviation: SRH, self-rated health; Vs., versus
Source: Swiss *
alternative coding scheme recoding response options with evenly spaced
ratings values [18]. This alternative coding is applicable to form 3 only.
9 Appendix S4 Participants’ characteristics
Over the period 2002-2012, societal changes occurred in Switzerland. Among men, we
observed a decline in proportions of men with secondary education, income lower than
3000 Swiss francs, and Swiss citizenship. We also noted an increase in proportions of men
with tertiary education, income above 6000 Swiss francs (6001-9000, >9000), working part
time, living in households without children under 15, and having used medicine over the
past 7 days. Other characteristics were either stable or fluctuant over time. Among women,
we observed a decline in proportions of women with primary and secondary education,
income lower than 3000 Swiss francs, and out of the labour force. We noted an increase in
proportions of women with tertiary education, income above 3000 Swiss francs (3001-6000,
6001-9000, and >9000), working part time, and having friends or relatives to discuss
personal issues. As was the case for men, other characteristics were either stable or
fluctuant.
10
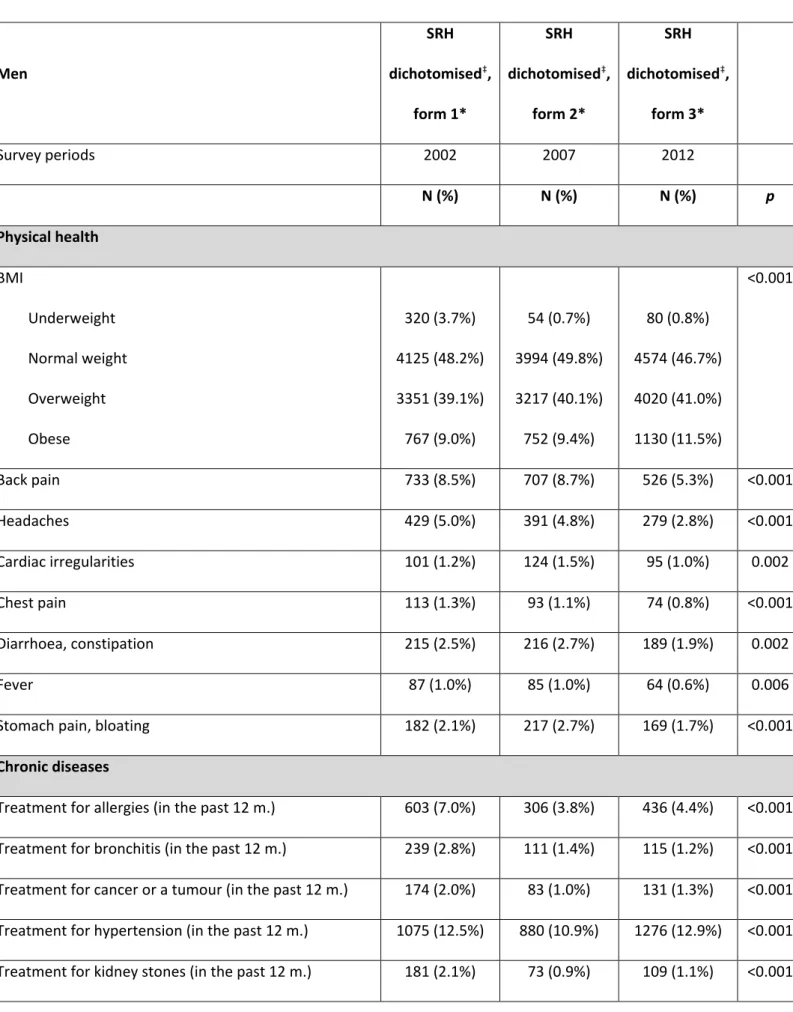
Table S5 Distribution of health characteristics across three forms of self-rated health
Men SRH dichotomised‡, form 1* SRH dichotomised‡, form 2* SRH dichotomised‡, form 3* Survey periods 2002 2007 2012 N (%) N (%) N (%) p Physical health BMI Underweight Normal weight Overweight Obese 320 (3.7%) 4125 (48.2%) 3351 (39.1%) 767 (9.0%) 54 (0.7%) 3994 (49.8%) 3217 (40.1%) 752 (9.4%) 80 (0.8%) 4574 (46.7%) 4020 (41.0%) 1130 (11.5%) <0.001 Back pain 733 (8.5%) 707 (8.7%) 526 (5.3%) <0.001 Headaches 429 (5.0%) 391 (4.8%) 279 (2.8%) <0.001 Cardiac irregularities 101 (1.2%) 124 (1.5%) 95 (1.0%) 0.002 Chest pain 113 (1.3%) 93 (1.1%) 74 (0.8%) <0.001 Diarrhoea, constipation 215 (2.5%) 216 (2.7%) 189 (1.9%) 0.002 Fever 87 (1.0%) 85 (1.0%) 64 (0.6%) 0.006
Stomach pain, bloating 182 (2.1%) 217 (2.7%) 169 (1.7%) <0.001
Chronic diseases
Treatment for allergies (in the past 12 m.) 603 (7.0%) 306 (3.8%) 436 (4.4%) <0.001 Treatment for bronchitis (in the past 12 m.) 239 (2.8%) 111 (1.4%) 115 (1.2%) <0.001 Treatment for cancer or a tumour (in the past 12 m.) 174 (2.0%) 83 (1.0%) 131 (1.3%) <0.001 Treatment for hypertension (in the past 12 m.) 1075 (12.5%) 880 (10.9%) 1276 (12.9%) <0.001 Treatment for kidney stones (in the past 12 m.) 181 (2.1%) 73 (0.9%) 109 (1.1%) <0.001
11
Treatment for mental breakdown (in the past 12 m.) 282 (12.3%) 223 (9.7%) 264 (11.5%) 0.04 Treatment for myocardial infarction (in the past 12 m.) 242 (2.8%) 113 (1.4%) 126 (1.3%) <0.001 Treatment for stroke (in the past 12 m.) 77 (0.9%) 44 (0.5%) 41 (0.4%) <0.001
Diabetes 389 (4.5%) 482 (6.0%) 593 (6.0%) <0.001
Mental health
Feeling unable to overcome barriers 1025 (11.9%) 916 (11.3%) 1195 (12.1%) 0.24
Loss of control 589 (6.8%) 579 (7.2%) 782 (7.9%) 0.01
Feeling overwhelmed with problems 757 (8.8%) 657 (8.1%) 880 (8.9%) 0.13
Feeling tired, exhausted, without energy 457 (5.3%) 456 (5.6%) 407 (4.1%) <0.001
Problems with sleeping 508 (5.9%) 548 (6.8%) 463 (4.7%) <0.001
Functional health Assistance to walk 64 (0.7%) 81 (1.0%) 70 (0.7%) 0.07 Assistance to read 119 (1.4%) 94 (1.2%) 134 (1.4%) 0.38 Assistance to hear 95 (1.1%) 130 (1.6%) 107 (1.1%) 0.002 Health behaviours Smoking 3059 (35.5%) 2588 (32.0%) 3075 (31.2%) <0.001
Alcohol consumption frequency Never
Once a day and less Twice a day
Three times a day
1045 (12.1%) 6972 (80.9%) 514 (6.0%) 89 (1.0%) 781 (9.6%) 6844 (84.5%) 404 (5.0%) 68 (0.8%) 968 (9.8%) 8404 (85.2%) 409 (4.1%) 78 (0.8%) <0.001
Physical activity in free time 5193 (60.2%) 5192 (64.1%) 6497 (65.9%) <0.001
Eating fruits daily 7955 (92.3%) 5896 (72.8%) 9443 (95.8%) <0.001
12 Women SRH dichotomised‡, form 1* SRH dichotomised‡, form 2* SRH dichotomised‡, form 3* Survey periods 2002 2007 2012 N (%) N (%) N (%) p Physical health BMI Underweight Normal weight Overweight Obese 1917 (18.5%) 5204 (50.3%) 2398 (23.2%) 826 (8.0%) 560 (5.7%) 6218 (63.1%) 2248 (22.8%) 836 (8.5%) 631 (5.9%) 6601 (61.5%) 2468 (23.0%) 1033 (9.6%) <0.001 Back pain 1420 (13.5%) 1280 (12.7%) 998 (9.2%) <0.001 Headaches 1039 (9.9%) 905 (9.0%) 792 (7.3%) <0.001 Cardiac irregularities 188 (1.8%) 231 (2.3%) 160 (1.5%) <0.001 Chest pain 144 (1.4%) 174 (1.7%) 130 (1.2%) 0.004 Diarrhoea, constipation 499 (4.7%) 529 (5.3%) 440 (4.0%) <0.001 Fever 110 (1.0%) 123 (1.2%) 77 (0.7%) 0.001
Stomach pain, bloating 450 (4.3%) 473 (4.7%) 404 (3.7%) 0.002
Chronic diseases
Treatment for allergies (in the past 12 m.) 837 (8.0%) 519 (5.2%) 633 (5.8%) <0.001 Treatment for bronchitis (in the past 12 m.) 317 (3.0%) 160 (1.6%) 182 (1.7%) <0.001 Treatment for cancer or a tumour (in the past 12 m.) 269 (2.6%) 161 (1.6%) 227 (2.1%) <0.001 Treatment for hypertension (in the past 12 m.) 1373 (13.1%) 1050 (10.4%) 1193 (11.0%) <0.001 Treatment for kidney stones (in the past 12 m.) 164 (1.6%) 69 (0.7%) 91 (0.8%) <0.001 Treatment for mental breakdown (in the past 12 m.) 586 (25.6%) 441 (19.3%) 492 (21.5%) <0.001
13
Treatment for myocardial infarction (in the past 12 m.) 127 (1.2%) 70 (0.7%) 50 (0.5%) <0.001 Treatment for stroke (in the past 12 m.) 62 (0.6%) 34 (0.3%) 32 (0.3%) 0.001
Diabetes 429 (4.1%) 485 (4.8%) 453 (4.2%) 0.02
Mental health
Feeling unable to overcome barriers 1507 (14.3%) 1286 (12.8%) 1567 (14.4%) <0.001
Loss of control 779 (7.4%) 734 (7.3%) 877 (8.1%) 0.08
Feeling overwhelmed with problems 1187 (11.3%) 1054 (10.5%) 1214 (11.2%) 0.13 Feeling tired, exhausted, without energy 873 (8.3%) 932 (9.3%) 940 (8.6%) 0.048
Problems with sleeping 1049 (10.0%) 1220 (12.1%) 965 (8.9%) <0.001
Functional health Assistance to walk 96 (0.9%) 151 (1.5%) 114 (1.0%) <0.001 Assistance to read 159 (1.5%) 173 (1.7%) 160 (1.5%) 0.30 Assistance to hear 69 (0.7%) 120 (1.2%) 83 (0.8%) <0.001 Health behaviours Smoking 2760 (26.3%) 2374 (23.6%) 2647 (24.3%) <0.001
Alcohol consumption frequency Never
Once a day and less Twice a day
Three times a day
3131 (29.8%) 7181 (68.3%) 167 (1.6%) 31 (0.3%) 2184 (21.7%) 7717 (76.7%) 149 (1.5%) 9 (0.1%) 2268 (20.8%) 8444 (77.6%) 150 (1.4%) 16 (0.1%) <0.001
Physical activity in free time 5698 (54.2%) 5812 (57.8%) 6205 (57.0%) <0.001
Eating fruits daily 10035 (95.5%) 8625 (85.7%) 10568 (97.2%) <0.001
Eating vegetables daily 10452 (99.4%) 8849 (87.8%) 10821 (99.5%) <0.001 Abbreviation: SRH, self-rated health
14 *Note:
Form 1: “Let’s start with the basics. How are you currently?”, response options: very good, good, okay (moderate), bad, very bad;
Form 2: “How is your health in general?”, response options: very good, good, moderate, bad, very bad;
Form 3: “how is your health status in general? Would you say it is…”, response options: very good, good, relatively good, bad, very bad.
15
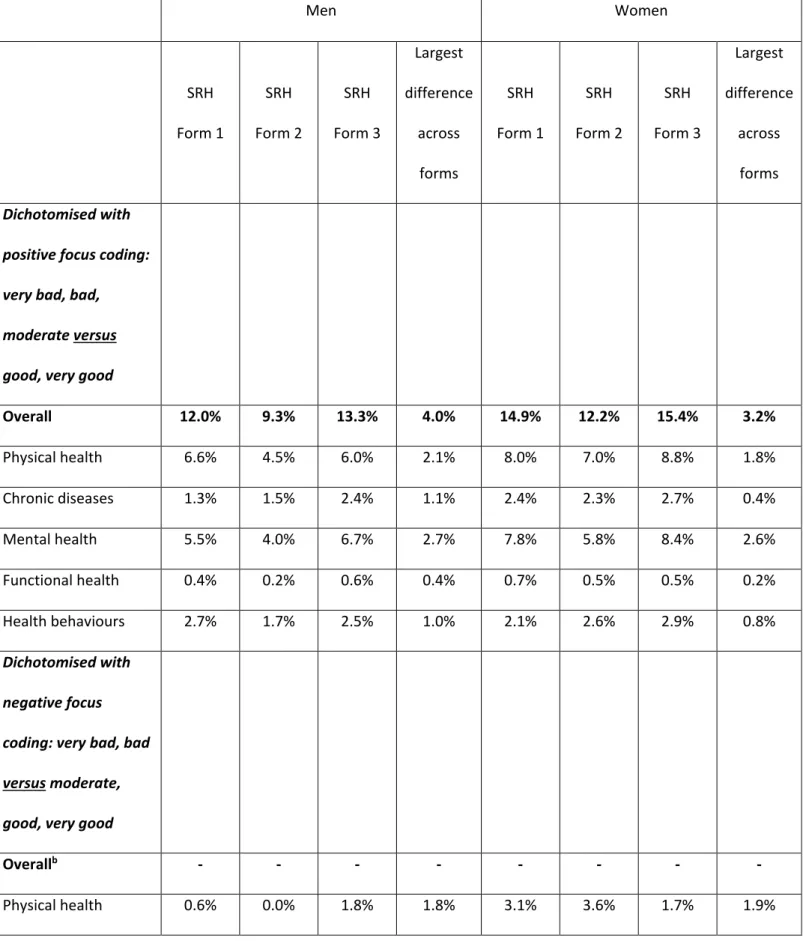
Table S6 Percentages of explained variancea of three forms of self-rated health, overall and with health
dimensions, by four coding schemes, among men and women.
Men Women SRH Form 1 SRH Form 2 SRH Form 3 Largest difference across forms SRH Form 1 SRH Form 2 SRH Form 3 Largest difference across forms Dichotomised with
positive focus coding: very bad, bad, moderate versus good, very good
Overall 12.0% 9.3% 13.3% 4.0% 14.9% 12.2% 15.4% 3.2% Physical health 6.6% 4.5% 6.0% 2.1% 8.0% 7.0% 8.8% 1.8% Chronic diseases 1.3% 1.5% 2.4% 1.1% 2.4% 2.3% 2.7% 0.4% Mental health 5.5% 4.0% 6.7% 2.7% 7.8% 5.8% 8.4% 2.6% Functional health 0.4% 0.2% 0.6% 0.4% 0.7% 0.5% 0.5% 0.2% Health behaviours 2.7% 1.7% 2.5% 1.0% 2.1% 2.6% 2.9% 0.8% Dichotomised with negative focus coding: very bad, bad versus moderate, good, very good
Overallb - - - - - - - -
16 Chronic diseases 0.0% 0.0% 0.1% 0.1% 0.5% 0.6% 0.2% 0.4% Mental health 1.2% 0.1% 1.2% 1.1% 3.4% 1.7% 3.5% 1.8% Functional health 0.0% 0.0% 0.0% 0.0% 0.0% 0.0% 0.0% 0.0% Health behaviours 3.7% 0.5% 3.5% 3.2% 2.6% 3.7% 4.3% 1.7% Linearb coding Overall 12.6% 12.6% 16.0% 3.4% 15.5% 13.5% 17.4% 3.9% Physical health 7.1% 6.3% 8.0% 1.7% 8.9% 8.4% 10.4% 2.0% Chronic diseases 2.5% 3.0% 4.3% 1.8% 3.1% 3.3% 4.0% 0.9% Mental health 6.9% 6.8% 9.1% 2.3% 9.0% 6.7% 10.6% 3.9% Functional health 1.0% 2.1% 1.1% 1.1% 1.5% 1.7% 1.3% 0.4% Health behaviours 1.5% 1.2% 2.8% 1.6% 1.5% 1.7% 2.6% 1.1% Linearisedd coding Overall - - 21.8% - - - 22.1% - Physical health - - 11.5% - - - 13.7% - Chronic diseases - - 5.3% - - - 4.5% - Mental health - - 13.1% - - - 13.5% - Functional health - - 1.8% - - - 2.4% - Health behaviours - - 3.1% - - - 3.1% - Source: Swiss
aadjusted R squared for linear coding scheme, MacKelvey and Zavoina pseudo R squared for dichotomous
coding schemes. Models were adjusted for age, marital status, number of children, nationality, education, income, employment status, urban vs. rural area, linguistic region, use of medicine in the last 7 days, having friends or relatives to discuss personal issues
b Model for “overall” was not estimated because the ratio between the degrees of freedom and the sample
size was lower than 10 – see Statistical Analysis section.
17
d Linearised = Response options coded “evenly” spaced: 1, 2, 3.7, 4.5, 5. The linearised coding scheme can be
18
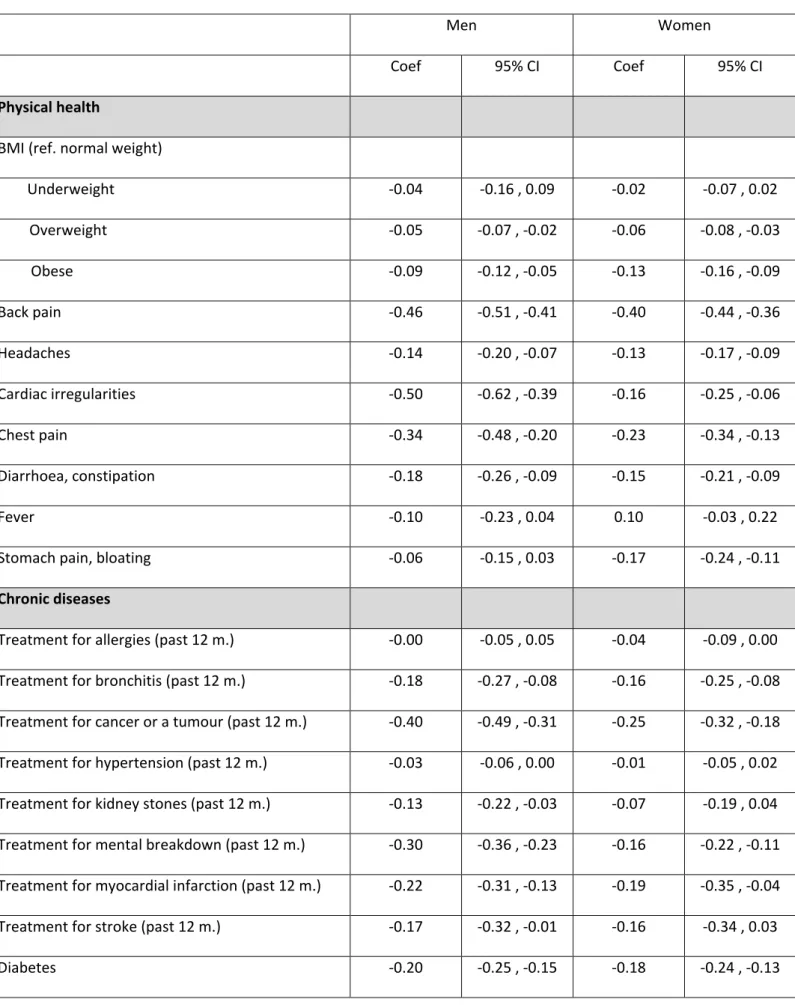
Table S7 Association of self-rated health form 3*, linearised coding scheme, with 30 health status variables.
Men Women
Coef 95% CI Coef 95% CI
Physical health
BMI (ref. normal weight)
Underweight -0.04 -0.16 , 0.09 -0.02 -0.07 , 0.02 Overweight -0.05 -0.07 , -0.02 -0.06 -0.08 , -0.03 Obese -0.09 -0.12 , -0.05 -0.13 -0.16 , -0.09 Back pain -0.46 -0.51 , -0.41 -0.40 -0.44 , -0.36 Headaches -0.14 -0.20 , -0.07 -0.13 -0.17 , -0.09 Cardiac irregularities -0.50 -0.62 , -0.39 -0.16 -0.25 , -0.06 Chest pain -0.34 -0.48 , -0.20 -0.23 -0.34 , -0.13 Diarrhoea, constipation -0.18 -0.26 , -0.09 -0.15 -0.21 , -0.09 Fever -0.10 -0.23 , 0.04 0.10 -0.03 , 0.22
Stomach pain, bloating -0.06 -0.15 , 0.03 -0.17 -0.24 , -0.11
Chronic diseases
Treatment for allergies (past 12 m.) -0.00 -0.05 , 0.05 -0.04 -0.09 , 0.00 Treatment for bronchitis (past 12 m.) -0.18 -0.27 , -0.08 -0.16 -0.25 , -0.08 Treatment for cancer or a tumour (past 12 m.) -0.40 -0.49 , -0.31 -0.25 -0.32 , -0.18 Treatment for hypertension (past 12 m.) -0.03 -0.06 , 0.00 -0.01 -0.05 , 0.02 Treatment for kidney stones (past 12 m.) -0.13 -0.22 , -0.03 -0.07 -0.19 , 0.04 Treatment for mental breakdown (past 12 m.) -0.30 -0.36 , -0.23 -0.16 -0.22 , -0.11 Treatment for myocardial infarction (past 12 m.) -0.22 -0.31 , -0.13 -0.19 -0.35 , -0.04 Treatment for stroke (past 12 m.) -0.17 -0.32 , -0.01 -0.16 -0.34 , 0.03
19 Mental health
Feeling unable to overcome barriers -0.08 -0.12 , -0.04 -0.06 -0.10 , -0.03
Loss of control -0.06 -0.10 , -0.02 -0.04 -0.09 , -0.00
Feeling overwhelmed with problems -0.13 -0.18 , -0.09 -0.09 -0.13 , -0.05 Feeling tired, exhausted, without energy -0.51 -0.57 , -0.45 -0.40 -0.44 , -0.35
Problems with sleeping -0.27 -0.33 , -0.22 -0.22 -0.26 , -0.18
Functional health Assistance to walk -0.71 -0.86 , -0.55 -0.43 -0.55 , -0.30 Assistance to read -0.12 -0.23 , -0.02 -0.24 -0.33 , -0.14 Assistance to hear -0.24 -0.36 , -0.11 -0.18 -0.34 , -0.03 Health behaviours Smoking -0.03 -0.05 , -0.01 -0.03 -0.06 , -0.01
Alcohol consumption frequency (ref. once a day and less)
Never 0.08 0.05 , 0.12 0.12 0.09 , 0.15
Twice a day 0.08 0.02 , 0.14 0.11 0.02 , 0.21
Three times a day 0.01 -0.11 , 0.14 0.19 -0.08 , 0.47
Physical activity in free time 0.13 0.11 , 0.16 0.09 0.07 , 0.12
Eating fruits daily -0.02 -0.07 , 0.03 0.05 -0.02 , 0.12
Eating vegetables daily 0.10 -0.00 , 0.21 0.21 0.05 , 0.38
Abbreviation: SRH, self-rated health
Source: Swiss *Form 3: “how is your health status in general? Would you say it is…”, response options: very good, good, relatively good, bad, very bad