Corporate Portfolio Management within Japanese Diversified Trading & Investment Companies - What Role Does Real Estate Play? -
by Takanori Ono B.A., Economics, 2005
Kyoto University
Submitted to the Program in Real Estate Development in Conjunction with the Center for Real Estate in Partial Fulfillment of the Requirements for the Degree of Master of Science in Real Estate
Development at the
Massachusetts Institute of Technology September, 2012
©2012 Takanori Ono All rights reserved
The author hereby grants to MIT permission to reproduce and to distribute publicly paper and electronic copies of this thesis document in whole or in part in any medium now known or hereafter
created.
Signature of Author
Center for Real Estate July 30, 2012
Certified by
David Geltner
Professor of Real Estate Finance, Department of Urban Studies and Planning
Thesis Supervisor
Accepted by
David Geltner
Chair, MSRED Committee, Interdepartmental Degree Program in
Corporate Portfolio Management within Japanese Diversified Trading & Investment Companies - What Role Does Real Estate Play? -
by Takanori Ono
Submitted to the Program in Real Estate Development in Conjunction with the Center for Real Estate on July 30, 2012 in Partial Fulfillment of the Requirements for the Degree of Master of
Science in Real Estate Development
ABSTRACT
This paper discusses possible optimal corporate portfolio composition for Japanese trading and investment firms from stakeholders’ (specifically shareholders and employees) value maximization perspective. Based on the historical returns of diversified business units of 4 subject companies, performances of individual business units and three portfolios (current, tangency, and “suboptimal”) are analyzed and compared. The study suggests adjusting suboptimal portfolio composition based on each business unit’s systematic risk and excess market return relative to its systematic risk and industry average. A firm also needs consideration on how the composition adjustment would affect diversification benefits the firm now enjoys and also on its overall management strategy.
Key words: corporate portfolio management, diversification, stakeholder theory, portfolio theory, CAPM, Index model, accounting beta, Jensen’s Alpha, Treynor ratio, multi-factor model
Thesis Supervisor: David Geltner Title: Professor of Real Estate Finance
ACKNOWLEDGEMENT
First and foremost, I’d like to thank Professor David Geltner, my advisor. He has always inspired me intellectually, and I’ve learned a lot from him. Without his insights and constructive advice, I couldn’t have completed this research.
I would also like to express my gratitude to faculty and administrative staff of MIT Center for Real Estate for their continuous support and guidance. They have tremendously leveraged my learning experience.
My special thanks are extended to my classmates. They have always inspired me cheered me up. Especially, they have magically turned my potentially painful graduate school life into meaningful and unforgettable one by their wit and personalities.
I also wish to acknowledge the support and assistance offered by Sumitomo Corporation, my sponsor. I am particularly grateful for the assistance given by members of Strategic Real Estate Business Department. I cannot thank them enough for giving me this opportunity.
Last but not least, I’d like to express my sincere appreciation to my parents, family and friends. They have always believed in me and unconditionally supported me. Because I knew they were always at my back, I could challenge myself to step out of my comfort zone.
TABLE OF CONTENTS
1. Introduction 9
1.1. Research Motivation 9
1.2. Approach and Structure 11
1.3. Overview of Diversified Trading & Investment Company 11
Definition of Diversified Trading & Investment Company 11
Overview and History of Subject Companies 12
2. Literature Review 15
Portfolio Theory 15
Capital Asset Pricing Model (CAPM) 16
Index Model 17
Accounting Beta 17
Performance Attribution 18
Multi Factor Model 19
Motives of Being a Multi-business Firm 19
Corporate Portfolio Management (CPM) 20
3. Hypothesis and Methodology 21
3.1. Scope of Research 21
3.2. Hypotheses and Framework 21
Hypothesis 21 Framework 22 3.3. Analysis Methodology 23 Portfolio Optimization 23 Index Model 24 Performance Attribution 27 Multi-Factor Model 27 4. Results 28
4.1. Organization and Historical Returns of Sumitomo Corporation 28
4.2. Optimization Result 35
4.3. Index Model 40
4.4. Performance Attribution 48
4.5. Factor Model 51
5. Interpretation and Discussion 53
5.1. Analytical Approach 53
5.2. Comparison between three Possible Portfolio Compositions 54
6. Comparison between Companies 57
6.1. Organization 57
6.2. History of Diversified Trading and Investment Companies 59
6.3. Analyses of Subject Companies 61
Mitsubishi Corporation 61
Mitsui & Co., Ltd. 65
Itochu Corporation 69
6.4. Interpretation and Discussion 73
Mitsubishi Corporation 73
Mitsui & Co 73
Itochu Corporation 73
Optimal Portfolio Composition and History of the Company 77
6.5. Implication for the role of Real Estate 78
7. Conclusion and Further Discussion 80
Conclusion and Limitations 80
Further Discussions 80
TABLE OF FIGURES
Figure 1: Historical Net Income of Diversified Trading and Investment Companies"..."14" Figure 2: Historical Market Value of Diversified Trading and Investment Companies"..."14" Figure 3: Organization of Sumitomo Corporation as of July 1, 2011"..."29" Figure 4: Historical Quarterly Net Income"..."30" Figure 5: Historical Annual Net Income"..."30" Figure 6: Historical Quarterly ROA"..."31" Figure 7: Historical Annual ROA"..."31" Figure 8: Scatterplots of Quarterly ROAs of each unit"..."33" Figure 9: Efficient Frontier, Portfolios, and Performance of each unit"..."36" Figure 10: Efficient Frontier, Portfolios, and Performance of each unit"..."38" Figure 11: Area Chart of Portfolio Weights on the Efficient Frontier (with 2004)"..."39" Figure 12: Area Chart of Portfolio Weights on the Efficient Frontier (without 2004)"..."39" Figure 13: Historical Portfolio Weights of Sumitomo Corporation"..."40" Figure 14: Historical ROA of Each Segment in the Market"..."41" Figure 15: Historical Market Portfolio Compositions"..."42" Figure 16: Scatterplot of Segment ROA and Market ROA"..."45" Figure 17: Mean Return and Jensen’s Alpha of Each Segment"..."47" Figure 18: Systematic Risk-Return Relationship of Each Portfolio"..."55" Figure 19: Organizations of Subject Companies"..."58" Figure 20: Historical Net Income of Each Segment (Mitsubishi Corporation)"..."62" Figure 21: Historical ROA of Each Segment (Mitsubishi Corporation)"..."62" Figure 22: Efficient Frontier, Portfolios, and Performance of Each Segment (Mitsubishi Corporation)"..."63" Figure 23: Area Chart of Portfolio Weights on the Efficient Frontier (Mitsubishi Corporation)"..."64" Figure 24: Historical Net Income of Each Segment (Mitsui & Co)"..."66" Figure 25: Historical ROA of Each Segment (Mitsui & Co)"..."66" Figure 26: Efficient Frontier, Portfolios, and Performance of Each Segment (Mitsui & Co)"..."67" Figure 27: Area Chart of Portfolio Weights on the Efficient Frontier (Mitsui & Co)"..."68" Figure 28: Historical Net Income of Each Segment (Itochu Corporation)"..."70" Figure 29: Historical ROA of Each Segment (Itochu Corporation)"..."70" Figure 30: Efficient Frontier, Portfolios, and Performance of Each Segment (Itochu Corporation)"..."71" Figure 31: Area Chart of Portfolio Weights on the Efficient Frontier (Itochu Corporation)"..."72" Figure 32: Systematic Risk-Return Relationship of Each Portfolio (Mitsubishi)"..."74" Figure 33: Systematic Risk-Return Relationship of Each Portfolio (Mitsui)"..."75" Figure 34: Systematic Risk-Return Relationship of Each Portfolio (Itochu)"..."76"
-1.
Introduction-1.1. Research Motivation
Investment. What does one think of when it comes to investment? It could be common stock, deposit in a bank account, Treasury bill, pension plan, or whatever makes return on initial invested resources. Everyone has his/her own perception and approach toward investment. However, no one would disagree that investment is no longer a kind of thing only highly trained people on Wall Street can handle. Many books for individual investors have been published, and every kind of information for investment strategy is flooding on the internet. More and more people think seriously about how to increase their wealth by efficient investment. It is even not uncommon nowadays that high schools incorporate an investment simulation game in their curriculum. Investment has already become a part of everyone’s everyday life. Literally, one can find a new investment or manage his/her portfolio anytime, anywhere. Therefore, something about investment should be of interest to everyone.
For corporate entities, investment has a more crucial meaning, or technically speaking, investment is everything. Regardless of its business model, every single corporation needs to invest its resources in some form of investment opportunity to create outputs, which eventually bring value to the corporation. Investment could be manufacturing equipment, financial instruments, developable land, third-party business professional, or again, whatever makes return and economic sense.
Then all the questions regarding investment finally converge into the following two, whether individual or institutional: “which opportunities to invest in?” and “how much to invest in each opportunity?” These foremost questions have been the center of attention for decades, and extensive research has been made on these topics to date.
Based on modern portfolio theory and capital asset pricing model, portfolio compositions of corporations also have been studied by many researchers to date. When it comes to optimal portfolio of a diversified firm, the research convention is to assume a hypothetical conglomerate that invests in various industries in the market, and to use security return indexes of industries as proxies of the returns of business units of the subject conglomerate. A conglomerate is a firm that participates in different markets or businesses and grows mainly from acquisition strategy. Although these studies are full of insights and suggestions, the application is somewhat limited to diversified firms that do not base their growth on M&A strategy because the security return index of an industry does not represent the returns of these firms’ business units.
Speaking of returns of diversified firms, a number of studies have examined the diversification effects by comparison of security or accounting returns of diversified firms to those of undiversified firms. However, these studies are mostly about the total return of a diversified firm, and not much has been written on the return of individual business units within a diversified firm or optimal portfolio composition of the firm. The optimal portfolio of a diversified firm is more about corporate portfolio management, a relatively new realm of study which has been developed since the 1970’s initially based more on a strategic management perspective. More recently, evaluation matrices developed in the corporate portfolio management field have been synthesized with risk-return measures of portfolio theory, and more comprehensive studies have been conducted. (Pidun, et al., 2011)
I, as a real estate professional working in one of Japanese diversified trading and investment companies, have been always curious about how capital should be allocated within the company. Since the strategy of a business unit should align with the overall strategy of a firm, understanding how capital can be efficiently allocated to each unit and what role the unit plays in relationships with other units is of extreme importance.
Being motivated by these backgrounds, this paper explores possible optimal corporate portfolio of diversified firms mainly from financial perspective rather than strategic management perspective. Although the examples of observation are limited to Japanese diversified trading and investment firms, the discussions are applicable to virtually any type of corporation. Also, this paper attempts to examine relationships between the real estate sector and other sectors and to provide some food for thoughts on how to incorporate real estate sector in a corporate portfolio.
1.2. Approach and Structure
The main questions of this study are: what is the optimal corporate portfolio composition for a diversified trading and investment Company?, what factors should the management of such company pay attention to? and which economic or other measures should be used for evaluation of portfolio?
This paper is divided into 7 chapters. Next section of this chapter presents the definition and overview of a Japanese diversified trading and investment company, the subject of this study. Chapter 3 introduces the methodology of the study and Chapter 4 provides the results. Chapter 5 interprets the results, Chapter 6 compares the results of similar companies, and Chapter 7 summarizes the findings.
1.3.
Overview-of-Diversified-Trading-and-Investment-Company-
Definition-of-Diversified-Trading-and-Investment-Company-Japanese diversified trading & investment companies, the subject of this paper, are sometimes as to “general trading companies” or “Sogo-Shosha,” and usually distinguished from “conglomerates.” A common characteristic in both entities is that both participate in multiple diversified markets or industries. Encyclopedia of Finance defines a conglomerate as “one that has engaged in several conglomerate combinations” where “a conglomerate combination is a type of business combination that may involve firms that have little, if any, product market
similarities.” (Lee & Lee, 2006) In addition, conglomerate is often characterized to take an acquisition strategy for its growth.
On the other hand, a distinct characteristic is that the business model of diversified trading and investment companies were originally trading (e.g. importing raw materials and exporting finished goods in different industries) and then they gradually integrated their businesses vertically as well as horizontally. (Lifson, 1981) As its name indicates, they also invest in both private and public equity and engage in M&A activities as conglomerates do. However, M&A is not the only source for their growth.
Another characteristic of a diversified trading and investment company is that it is often a member of a larger conglomerate. In fact, three of the four subject companies are member companies of larger conglomerate.
There are not so many companies that are qualified as diversified trading and investment companies defined in this paper, and this paper studies one trading and investment company (Sumitomo Corporation) in detail and three more companies (Mitsubishi Corporation, Mitsui & Co, and Itochu Corporation) mainly for comparison.
Overview-and-History-of-Subject-Companies-Some diversified trading and investment firms have their origin in former-Zaibatsu group, “any of the large capitalist enterprises of Japan before World War II, similar to cartels or trusts but usually organized around a single family. One zaibatsu might operate companies in nearly all important areas of economic activity. The Mitsui combine, for example, owned or had large investments in companies engaged in banking, foreign trade, mining, insurance, textiles, sugar, food processing, machinery, and many other fields as well. All zaibatsu owned banks, which they used as a means for mobilizing capital.” (Encyclopædia Britannica, 2012)"They started importing and exporting goods, and had gradually evolved to credit enhancement, manufacturing,
investment or any other possible form of business. (Lifson, 1981) As the phrase “from noodle to satellite” represents very well the wideness and the degree of diversification of a diversified trading and investment company, it is not an exaggeration to say that a diversified trading and investment company engages in every single industry one can think of.
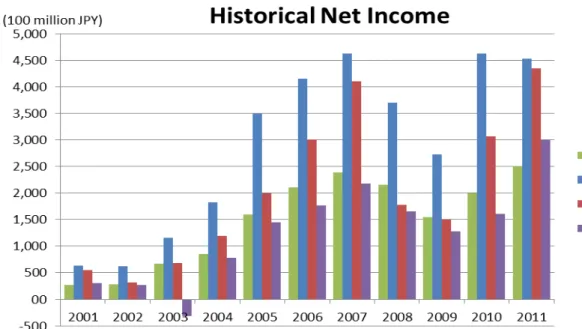
Figure 1 represents net income of subject companies and it shows that they have grown rapidly during the past decade. Even after the financial crisis, they have already recovered to the level before the crisis in terms of net income. In terms of market value, although they have shrunk almost by a half after the crisis, they maintain their market value at a high level relative to the market. Figure 2 illustrates the historical market value of the companies, and Table 1 lists the market value rankings of the subject companies as of July 27, 2012, and it shows that these companies play significant roles in Japanese Economy.12
""""""""""""""""""""""""""""""""""""""""""""""""""""""""""""" 1"Mitsubishi"Corporation’s"market"value"as"of"date"is"about"USD"31.6"billion,"which"is"equivalent"to"that"of"Lowe’s" Corporation,"a"home"improvement"retailer."Sumitomo"Corporation’s"market"value"is"about"USD"17"billion,"which"is" equivalent"to"that"of"Allstate"Corporation,"a"property"and"casualty"insurer."(YCharts,"2012)" 2"Just"for"reference,"Toyota"Motor"has"the"highest"market"value"of"approximately"USD"126.8"billion,"which"is" equivalent"to"that"of"Verizon"Communications."(Nikkei"Inc,"2012)"(YCharts,"2012)"
Figure 1: Historical Net Income of Diversified Trading and Investment Companies
Figure 2: Historical Market Value of Diversified Trading and Investment Companies
Table 1: Market Value Rankings of Subject Companies
Company" Ranking" Mitsubishi"Corporation" 14th" Mitsui"&"Co.,"Ltd." 19th" Sumitomo"Corporation" 30th" Itochu"Company" 36th" "(as"of"July"27,"2012,"source:"Nikkei.com)"
2. Literature Review
Portfolio-Theory-Since portfolio theory is a widely accepted concept in finance world and a number of good textbooks and informative articles have been published on this dupject, this paper does not discuss it in detail. However, it is worthwhile to remember that Markowitz clarified the relationship between total variance of a portfolio, variance of each security, and the co-movement between individual securities. (Markowitz, 1952) (Elton & Gruber, 1997) This relationship can be expressed as: Equation)1 ! !! = !!! !! ! !!! !, !!!= ! !!!!"# !!, !! ! !!! ! !!!
Where E(rp) = expected return of a portfolio, E(ri) = expected return of security i, ri = return of
security i, and wi = weight of security i in a portfolio. Since the more securities are incorporated
in a portfolio, the less volatility of each individual security contributes to the total volatility, a high degree of diversification eliminates variance terms of each security and only covariance terms remain. The part of total volatility which is diversifiable, is called “idiosyncratic risk” or ”security specific risk,” and the remaining part, which is not diversifiable is called “systematic risk” or “market risk.” Since investors can diversify away idiosyncratic risk, only systematic risk should be rewarded. (Bodie, Kane, & Marcus, 2011) (Brealey, Myers, & Allen, 2011)
Markowitz also formulated how to maximize the expected return of a portfolio for any given total volatility. He called such a portfolio an “efficient portfolio” and a series of efficient portfolios as “efficient frontier.” Among efficient portfolios, one that maximizes Sharpe ratio is called “tangency portfolio” or “market portfolio.” (Sharpe, Mutual Fund Performance, 1966) (Brealey, Myers, & Allen, Portfolio Theory and the Capital Asset Pricing Model, 2011) The Sharpe ratio is defined as:
Equation)2 !ℎ!"#$!!"#$% = !"#$!!"#$%&$ !"#$%#&%!!"#$%&$'(= ! − !! !
Capital-Asset-Pricing-Model-(CAPM)-Based on Markowitz’ portfolio theory, the capital asset pricing model was developed by Sharpe, Lintner, and Mossin. (Bodie, Kane, & Marcus, 2011) Their theory is that in a competitive market, the expected risk premium of a security is proportionate to its market beta, or the sensitivity to the market. (Sharpe, 1964) (Lintner, 1965) (Mossin, 1966) Under the capital asset pricing model, the risk-return relationship can be expressed as
Equation)3
! !! − !! = ! ! !! − !! !, ! =!"# !, !! !"# !!
where E(ri)=expected+return+of+a+security+i, rf+=risk4free+rate, and E(rm)=expected+return+of+ market+portfolio. Beta is also referred to as a proxy of systematic risk. (Brealey, Myers, & Allen, 2011) From Equation"3, beta of a portfolio is estimated to be following:
Equation)4
!! = !!!! ! !!!
In the context of CAPM, there are two major criteria for performance evaluation of a portfolio: Jensen’s alpha and Treynor ratio. Jensen’s alpha is expressed as:
Equation)5
!! = !!− ! !! = !!− !!+ !! !!− !!
and, it is considered to indicate an abnormal return or mispricing of a security. (Jensen, 1967) fTreynor ratio is similar to Sharpe ratio, but it measures the return of a security to its beta, or systematic risk instead of its volatility. (Treynor, 1966) (Bodie, Kane, & Marcus, 2011) Treynor ratio is expressed as Equation)6 !"#$%&"!!"#$% =!"#$!!"#$%&$ !"#$%&!!"#$ = ! − !! !
-
Index-Model-The Index model is similar to CAPM, and it is a method to estimate beta of a security. However, the difference of the two is that index model is a statistical model, and it estimates beta using a single-variable linear regression, where the independent variable is a market index. (Bodie, Kane, & Marcus, 2011) The regression equation of index model is:
Equation)7
!! ! − !! = !!+ !! !!− !! + !! ! "
where αi=expected+risk+premium+of+a+security+when+market+risk+premium+is+zero, and εi+is+ residual. (Bodie, Kane, & Marcus, 2011) Since εi has zero-mean, risk-return relationship can be expressed as:
Equation)8)
! !! = !!+ !!+ !! !!− !! "
Accounting-Beta-Accounting beta is the beta estimated with the index model using accounting return instead of security return. Encyclopedia of Finance expresses accounting beta in the following equation: Equation)9) !"#$ !"#$%!!""#$" !"#$%&',!,!= !!+ !!! !"#$ !"#$%!!""#$" !"#$%&,!+ !!,!"
Where Aβi=accounting+ beta. This method is used especially when the security is not publicly traded or when one estimate the sensitivity to the market of a project. (Lee & Lee, 2006) Theoretically speaking, accounting beta should have a strong correlation with market beta since in an efficient market all the reported accounting or financial information of firms is reflected in their stock prices. (Ball & Brown, 1969) Which accounting variable is appropriate for this analysis has always been a question, and historically, various types of accounting measures such as profitability, leverage, and liquidity have been adopted. (Bildersee, 1975) "
Performance-Attribution-Performance attribution is a performance evaluation technique which measures excess return of a portfolio in a comparison with the return of a benchmark portfolio called the “Bogey.” This technique enables investors to identify sources of the excess (or below) market return of their portfolio. The Bogey can be a market index such as S&P 500, Nikkei 225 or any other portfolio to which an investor wants to compare his/her own. (Bodie, Kane, & Marcus, 2011) The Bogey return is calculated as:
Equation)10
!!= !!"!!" !
!!!
,!
where wBi+is+weight+of+Sector+i+in+the+Bogey and rBi+is+the+return+of+Sector+i+in+the+Bogey. The return of the portfolio of an investor is expressed as:
Equation)11)
!!= !!"!!" !
!!!
where wPi+is+weight+of+Sector+i+in+the+Portfolio and rPi+is+the+return+of+Sector+i+in+the+Portfolio. From Equation"10 and Equation"11, the excess return of the portfolio is calculated as:
Equation)12 !!− !!= !!"!!" ! !!! − !!"!!" ! !!! = (!!"!!" ! !!! − !!"!!")
The total excess return can be decomposed into following three components:
Contribution from Sector Allocation !!"− !!" !!" + Contribution from Project/Investment Selection !!" !!"− !!"
+ Contribution from Interaction Effect !!"− !!" !!"− !!" = Total Contribution from Sector i !!"!!"− !!"!!"
They are the potential sources of the excess market return of a portfolio. (Geltner, Miller, Clayton, & Eichholtz, 2007)
MultiOFactor-Model-Multi-Factor model is an analytical method to identify potential risk factors for a security. In this model, a factor is a surprise, or deviation from its expected value, and macroeconomic indicator which seems to have an impact on a specific security is often used as a factor. Since each factor is a surprise, if there is no surprise in any factor, the realized return of a security should be equal to its expected return. Although there is a debate how to forecast the expected return, the CAPM expected return is often used as an input. (Bodie, Kane, & Marcus, 2011) (Chan, Karceski, & Lodonishok, 1998) The Multi-Factor model can be summarized as:
Equation)13)
!! = ! !! + !!!!!+ !!!!!+ ⋯ + !!"!!+ !!"
Motives-of-Being-a-MultiObusiness-Firm-Numerous researches have been conducted on conglomerate activity and diversification effects to date. In the first place, motives of engaging in conglomerate activity can be categorized into three main realms: profitability, synergism, and diversification. (Smith & Schreiner, 1969)
The profitability motive suggests that a conglomerate firm should enter into a new industry if the expected return of any investment opportunity in that industry exceeds the cost of capital of the firm. (Smith & Schreiner, 1969)
The synergism motive explains higher expected return due to economies of scale realized either from cost reduction by efficient management and operation or demand increase by combining businesses. The average return of conglomerate firms operating in related businesses tends to outperform the average return of firms operating in unrelated businesses. (Bettis & Hall, 1982)
The diversification motive emphasizes the reduction in total volatility of corporate portfolio realized by operating businesses in different industry categories. (Smith & Schreiner,
1969) On the contrary, Conglomerate firms have higher market risk than comparable non-conglomerate firms. (Melicher & Rush, 1973) However, related diversification tends to lead to lower systematic risk than unrelated diversification. (Lubatkin & Rogers, 1989)
Corporate-Portfolio-Management-(CPM)-Since its invention in the late 1960s, corporate portfolio management has been discussed and developed by a number of scholars and practitioners. In the early years, strategic consulting firms led to invent several risk matrices represented by Boston Consulting Group’s growth-share matrix and GE/Mckinsey nine-block matrix, and CPM was aimed at evaluating a specific market for a firm by analyzing market attractiveness and relative positioning of the firm in the industry. These matrices helped firms make decisions regarding scope of business, capital allocation within portfolio, and overall firm strategy. (Henderson, 1973) (Pidun, et al., 2011) (Untiedt & Pidun, 2011)
In more recent years, CPM has been enhanced to incorporate risk-return measures, and the focus of CPM shifted from evaluation of performance and strategy of each business unit to risk-return management of overall portfolio, which eventually affects the strategy of a firm. (Pidun, et al., 2011) (Untiedt & Pidun, 2011) A synthesis of strategic management theories and financial portfolio theories is the key to further develop CPM.
3. Hypothesis and Methodology
3.1. Scope of Research
From data availability and economic impact perspectives, the subject of this research is limited to public diversified trading and investment companies in Japan. Specifically, this paper studies following four companies:
• Sumitomo Corporation • Mitsubishi Corporation • Mitsui & Co, and • Itochu Corporation
Sumitomo Corporation is the main subject. Of the subject companies, Sumitomo, Mitsubishi and Mitsui are member companies of Japanese conglomerates, and Itochu is independent of any. In addition, these companies have all distinct histories and origins, and this combination enables a well-balanced comparison.
3.2. Hypotheses and Framework
Hypothesis-In management and finance fields, it is well established that the primary goal of a corporation is to maximize shareholders’ wealth, or in other words, the equity value of the firm. Stakeholder theory suggests expanding the scope of this goal to the stakeholders, which include shareholders, employees, government, customers, suppliers, and more. While there is a debate which shareholders or stakeholders a firm should be managed for, different countries have different attitudes toward this question. (Brealey, Myers, & Allen, 2011) Taking into account the Japanese social and business norms, this paper consider a firm should maximize stakeholders’ wealth. Above all stakeholders, the shareholders and employees are the most important for a firm.
In terms of shareholders’ wealth maximization, a firm tries to maximize its equity value. Since equity value is a function of market value, in order to maximize its market value, a firm
tries to lower its discount rate or cost of capital. Because individual stock investors can diversify their portfolio and eliminate idiosyncratic risk of each security, idiosyncratic risk is not rewarded and the discount rate of a firm is determined based on its systematic risk. Holding a firm’s return or income constant, lower systematic risk leads to lower discount rate and hence higher market value. (Bodie, Kane, & Marcus, 2011) (Brealey, Myers, & Allen, 2011) Also, excess market return generates positive NPV and increases the firm’s value. Therefore a firm is motivated to keep its systematic risk low relative to its return and to invest more capital in business units with positive excess market return.
As to employees’ value maximization, a firm aims fundamentally to stabilize its management and operations to maintain its employment level stable and to protect its employees from the risk of layoffs. In order to stabilize its management and operations, a firm tries to maintain not only its systematic risk but also its total risk, which is measured by volatility of return. From stability perspective, a firm wants to avoid having its return very sensitive to specific risk factor. In addition, since higher compensation increases employees’ wealth, a firm seeks excess market return in order to produce additional compensation for its employees.34
Framework-Based on the hypotheses discussed in the previous section, this paper evaluates performances of corporate portfolios by using following measures and further discusses possible approaches to compose the optimal portfolio.
Measures: Sharpe ratio, Accounting Beta, Jensen’s Alpha, Treynor Ratio, Excess Market Return, and Macroeconomic Factor Beta
"""""""""""""""""""""""""""""""""""""""""""""""""""""""""""""
3"A"firm"can"pay"higher"compensation"for"its"employees"if"it"earns"the"same"return"with"fewer"employees,"or"in"
other"words"if"it"raises"the"labor"efficiency."However,"this"approach"is"more"of"an"organizational"matter,"and"this" paper"does"not"focus"on"the"matter."
4"Other" than" these" aspects," social" recognition" and" reputation" of" a" firm" can" possibly" affects" its" firm" value" for"
3.3. Analysis Methodology
Portfolio Optimization
Since this paper deals with corporate portfolio and business units within a company which does not issue any security, accounting return is used as a proxy of each unit return. All subject companies publish their earnings (net income) and total assets by business unit in their quarterly earnings announcement. This paper defines the accounting return used for analysis to be net income over total assets, which is referred to as ROA hereafter. The analysis period will be 11 years from fiscal year 2001 to fiscal year 2011 due to the data availability of Sumitomo Corporation, the main subject of this paper.
Based on the mean, standard deviation, and correlations of historical ROAs of each business unit, Markowitz’s portfolio optimization is conducted for each company with a “no short-sell constraint” since it is unrealistic to assume that a corporation can short-sell one or more of its business units. In portfolio optimization process, efficient frontier, tangency portfolio, and “Suboptimal Portfolio,” a possible portfolio which this paper defines as a portfolio with the same volatility as the current portfolio and on the efficient frontier, are identified.5 Also, portfolio compositions on the efficient frontier are shown in an area chart to visualize relationship between portfolio composition and target return of overall portfolio.
Because of organizational restructuring, subject companies do not maintain exactly the same business units all through the analysis period. Historical organizational charts of subject companies illustrates that these companies tend to merge smaller business units into a larger one. Therefore, both net income and total assets of smaller units before restructuring are summed up into one based on the current organization for analysis purpose.
"""""""""""""""""""""""""""""""""""""""""""""""""""""""""""""
5"Because"investors"accept"current"level"of"return"and"volatility"and"investors"can"diversify"the"idiosyncratic"risk"of"a"
security"away,"it"makes"more"sense"to"have"higher"return"with"the"same"volatility"than"to"have"lower"return"with" lower"volatility.""
Since two of the subject companies have a few business units based on geographical region not on product or industry, net income and total assets of such units are allocated to the other units proportionate to their net income and total assets under the assumption that these geographical units also have the same types of business and structure.67
For optimization, both quarterly and annual data are collected. Quarterly data provides more data points and is better for analysis purpose. In spite of its higher frequency, accounting return of some businesses tends to have some seasonality and can overestimate the volatility of the business. Therefore, this paper adopts either quarterly or annual data with the higher average correlation (covariance) for optimization because more highly correlated data gives a more conservative and risk averse result, which is better especially under uncertain circumstances.
Index Model
The systematic risk of each business unit is estimated by index model using ROA. Accounting beta of each segment is obtained by linear regression where the dependent variable is ROA of each segment and the independent variable is ROA of the market index which will be defined later.
Equation 14
!! ! − !!(!) = !!+ !! !! ! − !!(!) + !!(!)
The market index is replicated by synthesizing the historical ROAs of constituent companies of Nikkei 225, a Japanese market representing stock index. First, historical constituent companies are identified by the data from Compustat, and each company is classified into categories which Nikkei defines by the nature of its businesses. Each category is classified into industries, and each industry to segments that correspond to the organization of Sumitomo
"""""""""""""""""""""""""""""""""""""""""""""""""""""""""""""
6"Sumitomo"Corporation"has"“Domestic"Regional"Business"Units"and"Offices”"and"“Overseas"Subsidiaries"and"
Branches.”"Mitsui"&"Co"has"“Americas,”"“Europe,"the"Middle"East"and"Africa,”"and"“Asia"Pacific.”"
Corporation, as listed in Table 2. Net income and total assets of each constituent company are collected via Datastream, and ROAs of each category are defined as follows:
Equation)15
!"#!!"!!"#ℎ!!"#$%& = !"#!!"#$%&! !"#$%!!""#$"!!!
where Net+Incomei=Net+Income+of+Company+i+in+the+Sector, and Total+Assetsi=Total+Assets+ of+Company+i+in+the+Sector.
Next, the ROA of each industry is calculated based upon the market value weighted average of each category as shown below;
Equation)16
!"#!!"!!"#$%&'( = !"#!× !"!
!"! ,
where ROAi=ROA+of+Sector+i+in+the+industry, and MVi=Aggregate+Market+Value+of+Sectori+in+ the+industry. ROA of segment and the market respectively is calculated likewise.8
As to the frequency of market index return, since only annual data is available on Datastream, annual ROA is used as inputs for this analysis.
After estimating accounting beta of each business unit, Jensen’s Alpha, and Treynor Ratio are also estimated to evaluate the performance of the unit.
Although this is not the main focus of this paper, a comparison between betas of subject companies and the market averages is made in order to examine the diversification effect that is expected to decrease the systematic risk of a diversified company.
"""""""""""""""""""""""""""""""""""""""""""""""""""""""""""""
Table 2: Index Model Segments, Industries, and Categories
Corresponding+Segments Industries Nikkei+225+Categories
Nonferrous+Metals Steel+Products Automotive Automotive Ship+Building Ship+Building Media Communications Retail Textile+&+Apparel Chemicals Chemicals Electric+Machinery Precision+Instruments Electric+Power Gas Mining Oil&Coal+Products Life+Science Pharmaceuticals Construction Real+Estate Fishery Foods Glass&Ceramics Pulp+&+Paper Rubber+Products Air+Transport Marine+Transport Other+Land+Transport Warehousing Banking Insurance Other+Financial+Services Securities Services Services Other+Mnufacturing Other+Mnufacturing Railway/Bus Railway/Bus Trading Trading+Companies Logistics Financial+Services Machinery Machinery Others Infrastructure+&+Machinerty Metal Lifestyle+&+Retail Electronics Energy Mineral+Resources Construction+&+Real+Estate Foods Metal+Products Transportation Media+&+Lifestyle+Retail Mineral+Resources,+Energy, Chemicals+&+Electronics Foods,+Materials+&+Real+Estate Logistics+&+Financial+Services Materials
Performance Attribution
Based on the historical mean return of each business unit and the Bogey portfolio, excess market return of each unit is calculated by Equation 12 in page 18. The Bogey is constructed based on the corresponding segments listed in Table 2.
Since this paper aims to consider optimal corporate portfolios looking forward, the analysis uses the current portfolio composition of subject companies and the market rather than the historical average.
Multi-Factor Model
In addition to the Single Index Model, Multi-Factor Model analysis is conducted in order to identify possible risk factors to each segment. Considering the diversified and global nature of subject companies’ businesses, the broad-brush macroeconomic factors and foreign currency exchange rates are adopted as potential risk factors: Inflation rate, GDP Growth rate, USD/JPY exchange rate, EUR/JPY exchange rate, CNY/JPY exchange rate, 1-year Japanese Government bond yield, and 10-year Japanese Government bond yield.
Factor betas of each segment are obtained from multivariate regression as shown below: Equation)17
!!− ! !! = !!+ !!"#$!!"#+ !!"#$!!"#+ !!"#$!!"#+ !!"#$!!"#+ !!"#$!!"#+ !!!!!!!+ !!!"!!!"!
where αi=intercept+coefficient, βi+n=factor+beta+of+Segment+i+to+Factor+n, FINF=%+change+in+inflation+rate, FGDP=%+change+in+GDP+growth+rate, FUSD/JPY=%+change+in+USD/JPY+exchange+rate,++ FEUR/JPY=%+change+in+EUR/JPY+exchange+rate,++ FCNY/JPY=%+change+in+CNY/JPY+exchange+rate,++ F1Y=%+change+in+14year+Japanese+Government+bond+yield, and++ F10Y=%+change+in+104year+Japanese+Government+bond+yield.
4. Results
4.1. Organization and Historical Returns of Sumitomo Corporation
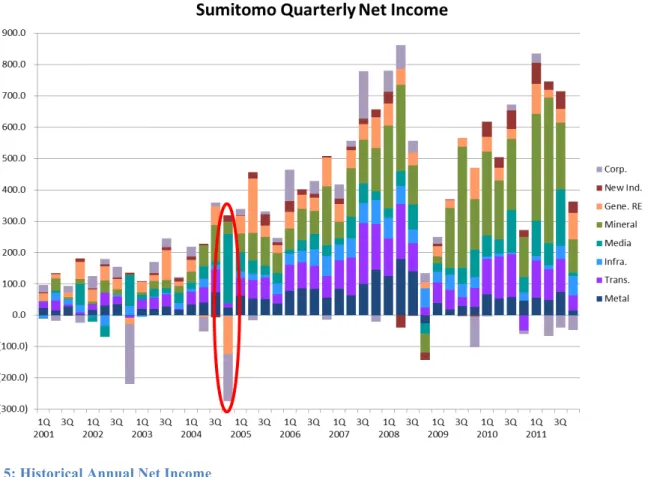
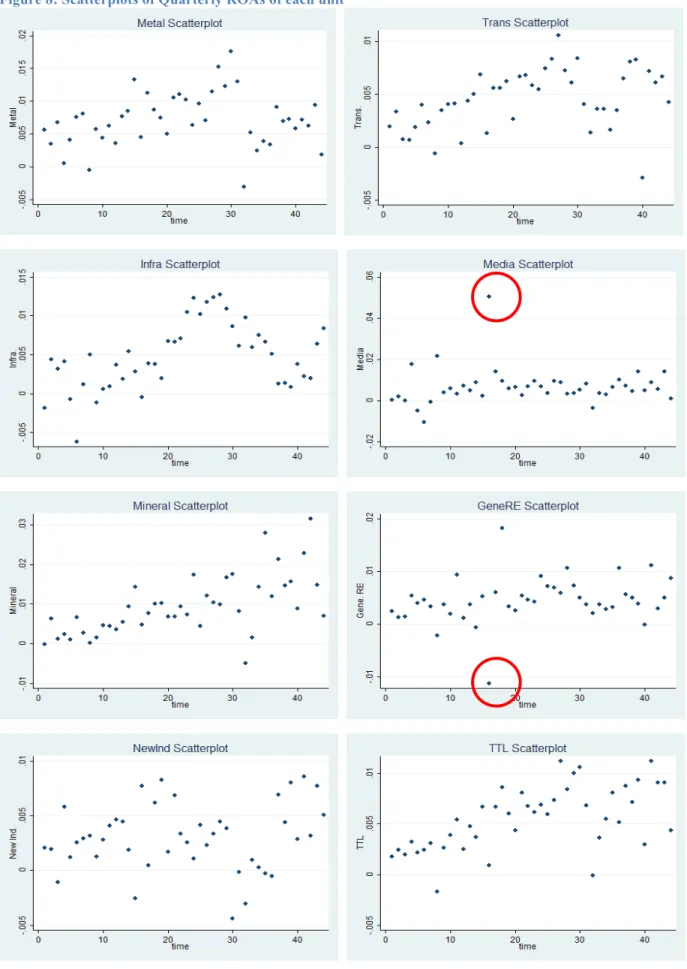
The organizational chart of Sumitomo Corporation is presented in Figure 3, and the optimal portfolio weights composition between these seven business units is the main focus of this paper. Figure 4 and Figure 5 respectively illustrates quarterly and annual historical net income of each unit. A large part of total net income comes from the Mineral unit, followed by Transportation and Media. Figure 6 and Figure 7 shows quarterly ROA and annual ROA, and they are also summarized in Table 3 and Table 4. Figure 8 demonstrates scatterplots of quarterly ROA.
As Figure 6, Figure 7 and Figure 8 indicate, the Media unit and General Products and Real Estate unit both seem to have outlying performance in 2004, especially in 4th quarter. This is because they “recognized gain on issuance of stock by Jupiter Telecommunications, (their) associated companies listed on the Jasdaq securities exchange, and impairment loss on real estate for rent in Yokohama area. In addition, equity in earnings of associated companies increased by 16.7 billion yen to 37.4 billion yen mainly contributed by the strong performances of Batu hijau copper and gold mine project and Jupiter Telecommunications.” (Sumitomo Corporation, 2005)
The company may have restated the real estate asset because it had enough surplus from stock issuance to offset the loss incurred by the restatement. However, it is difficult to judge whether this outlying data is the result of arbitrary managerial decision or if it represents a true characteristic of the business. Such kind of managerial decision could possibly affect the mean return and volatility of a business unit and also correlations between units, and could lead to misinterpretation of true nature of a business. This eventually could alter the optimal portfolio composition. However, it should be noted that this kind of characteristics of accounting return may be considered as a part of the risk of a company. If so, then taking out such outliers means underestimating the true volatility of the company or its businesses.
Figure 3: Organization of Sumitomo Corporation as of July 1, 2011
Figure 4: Historical Quarterly Net Income
Figure 6: Historical Quarterly ROA
Table 3: Summary Statistics of Quarterly ROA
mean sd Min max
Metal .0070973 .0040751 -.00303 .0175585 Trans .0045326 .0028067 -.002923 .0106102 Infra .0047543 .0042932 -.0061831 .0127461 Media .0066787 .0087831 -.0104779 .0503589 Mineral .0093464 .0074938 -.0049444 .0315792 GeneRE .0045025 .0043083 -.0112138 .0181431 NewInd .0029657 .0030442 -.0044215 .0085462 TTL .0055443 .003117 -.0017141 .0112228 N 44
Table 4: Summary Statistics of Annual ROA
mean sd Min max
Metal .0276523 .0112792 .0145139 .0503874 Trans .0182309 .008194 .0065421 .0323112 Infra .0183938 .0143765 -.0002045 .042044 Media .0262284 .0149811 .0095755 .0662528 Mineral .0368327 .0210021 .0096235 .0750872 GeneRE .0172586 .0092617 -.0029414 .0282191 NewInd .0113841 .0082457 -.0034395 .0261417 TTL .0217296 .0095585 .0058145 .0346855 N 11
This matter should be carefully treated because the decision to include this kind of outlying data gives different results especially in terms of portfolio optimization.
From volatility perspective, such outliers should be included if they represent the true characteristics of the businesses since higher volatility gives more conservative decisions which are good in terms of risk management. However, especially when the number of data points is limited, those outliers affect the result to a great degree, so this kind of question should be carefully handled. This paper solves for Markowitz portfolio optimization both with and without 4Q2004 data, and compares the results.
As the data inputs for portfolio optimization, this study uses annual data because of its higher average correlation than quarterly data as seen in Table 5 and Table 6. Annual data also has the higher average volatility relative to its time horizon, and this seems adequate from risk aversion perspective.
Figure 8: Scatterplots of Quarterly ROAs of each unit
Table 5: Correlation Matrix of Quarterly ROA
Table 6: Correlation Matrix of Annual ROA
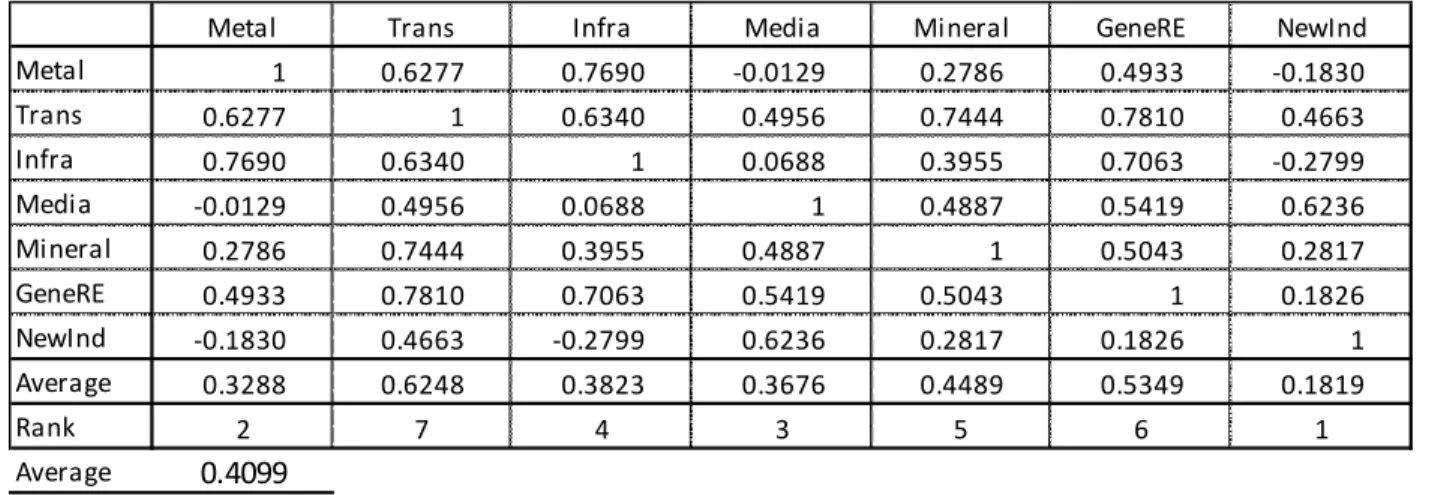
The summary statistics and the average correlation of Annual ROA excluding 2004 data are listed respectively in Table 7 and Table 8. The average correlation becomes approximately 13 points higher as expected due to the elimination of outlying performance of Media unit and General Products & Real Estate unit. On the contrary, in spite of the elimination, total volatility is higher without 2004 data. In terms of corporate risk management, data without 2004 seems better since it has both higher volatility and higher average correlation. However, this paper analyzes both data as stated earlier because of the sensitivity of whether or not to identify 2004 data as an outlier.
Metal Trans Infra Media Mineral GeneRE NewInd
Metal 1 0.6566 0.2210 90.0778 0.3338 0.3031 90.0180 Trans 0.6566 1 0.3236 90.0684 0.4756 0.4795 0.1979 Infra 0.2210 0.3236 1 0.0110 0.1438 0.2725 90.2000 Media 90.0778 90.0684 0.0110 1 0.0584 90.4147 0.3701 Mineral 0.3338 0.4756 0.1438 0.0584 1 0.2673 0.1262 GeneRE 0.3031 0.4795 0.2725 90.4147 0.2673 1 0.0783 NewInd 90.0180 0.1979 90.2000 0.3701 0.1262 0.0783 1 Average 0.2364 0.3441 0.1286 90.0202 0.2342 0.1643 0.0924 Rank 6 7 3 1 5 4 2 Average 0.1686
Metal Trans Infra Media Mineral GeneRE NewInd
Metal 1 0.6193 0.7258 0.0869 0.2661 0.2629 =0.1835 Trans 0.6193 1 0.6282 0.1923 0.7444 0.5692 0.4665 Infra 0.7258 0.6282 1 =0.1545 0.4045 0.6284 =0.2708 Media 0.0869 0.1923 =0.1545 1 0.1431 =0.4675 0.2766 Mineral 0.2661 0.7444 0.4045 0.1431 1 0.4140 0.2818 GeneRE 0.2629 0.5692 0.6284 =0.4675 0.4140 1 0.1362 NewInd =0.1835 0.4665 =0.2708 0.2766 0.2818 0.1362 1 Average 0.2963 0.5366 0.3269 0.0128 0.3757 0.2572 0.1178 Rank 4 7 5 1 6 3 2 Average 0.2748
Table 7: Summary Statistics of Annual ROA without 2004
mean sd min max
Metal .0272959 .0118239 .0145139 .0503874 Trans .0183348 .0086296 .0065421 .0323112 Infra .0193021 .0148177 -.0002045 .042044 Media .022226 .0073196 .0095755 .0331932 Mineral .0374221 .022042 .0096235 .0750872 GeneRE .0192786 .0067408 .0101948 .0282191 NewInd .0114189 .0086909 -.0034395 .0261417 TTL .0223651 .0098275 .0058145 .0346855 N 10
Table 8: Correlation Matrix of Annual ROA without 2004 data
4.2. Optimization Result
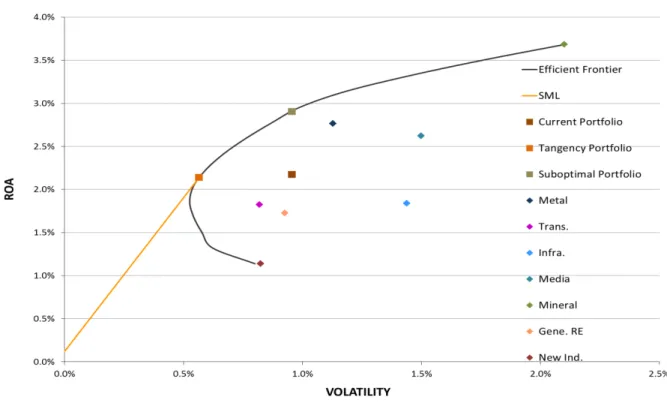
Figure 9 depicts the efficient frontier, current portfolio, tangency portfolio, suboptimal portfolio, and risk-return relationships of business units as a result of portfolio optimization with 2004. These three portfolios are compared in Table 9.
Tangency Portfolio consists mainly of Metal (22.04%), Media (26.82%) and General Products & Real Estate (41.72%). In addition to high returns of Metal (2.76%) and Media (2.62%), these three have very low correlations to one another and hence very low covariance. suboptimal portfolio consists mainly of Metal (50.62%), Media (21.62%) and Mineral (21.62%).
Metal Trans Infra Media Mineral GeneRE NewInd
Metal 1 0.6277 0.7690 :0.0129 0.2786 0.4933 :0.1830 Trans 0.6277 1 0.6340 0.4956 0.7444 0.7810 0.4663 Infra 0.7690 0.6340 1 0.0688 0.3955 0.7063 :0.2799 Media :0.0129 0.4956 0.0688 1 0.4887 0.5419 0.6236 Mineral 0.2786 0.7444 0.3955 0.4887 1 0.5043 0.2817 GeneRE 0.4933 0.7810 0.7063 0.5419 0.5043 1 0.1826 NewInd :0.1830 0.4663 :0.2799 0.6236 0.2817 0.1826 1 Average 0.3288 0.6248 0.3823 0.3676 0.4489 0.5349 0.1819 Rank 2 7 4 3 5 6 1 Average 0.4099
Figure 9: Efficient Frontier, Portfolios, and Performance of each unit
Table 9: Comparison between three portfolios (with 2004 data)
Suboptimal Portfolio has higher weight in Mineral instead of General Products & Real Estate in order to increase the portfolio return. However, regardless of its highest volatility of all, correlations between Mineral and the other two are very low (Metal: 0.27, Media: 0.14), and that works to maintain the volatility still at a level as low as the current portfolio (0.96%). As to General Products & Real Estate, it works very well mainly to diversify the total volatility away with low correlations with the other high-performing units.
Expected Standard Return Deviation (%) (%) Current 11.35 16.01 10.01 18.33 20.82 13.71 9.77 2.173 0.956 2.273 Tangency 22.04 0.00 0.00 26.82 0.00 41.72 9.42 2.140 0.565 3.785 Suboptimal 50.62 0.00 0.00 25.63 21.62 2.13 0.00 2.905 0.955 3.042 Sharpe Ratio WeightsJ(%)
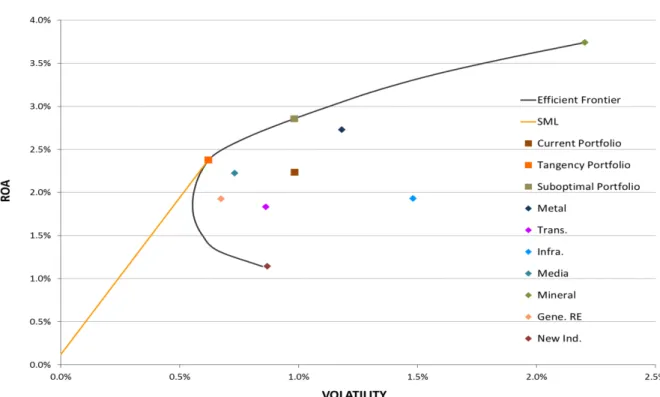
Figure 10 depicts the efficient frontier, current portfolio, tangency portfolio, Suboptimal Portfolio, and risk-return relationship of each business unit as a result of portfolio optimization without 2004. Table 10 compares current, tangency, and suboptimal portfolios.
Taking out the 2004 data gives different results especially for Media and General Products & Real Estate since it changes the risk profile of the two and correlations with the other units as well. Although General Products & Real Estate has higher ROA than with 2004, it now has high correlations with high-performing units such as Mineral (0.50), Metal (0.49), and Media (0.54), so there is no room for the unit to play the diversifier role any longer. This is reflected in its 0% weight both in tangency and suboptimal portfolios.
On the other hand, Media still has low average correlation (0.37) and high mean return (2.22%) at the same time, and it plays a significant role especially for tangency Portfolio as a diversifier. Without 2004, it seems that Media completely replaces General Products & Real Estate’s position with 2004. However, Media now has high correlation with Mineral (0.49), and this is the main reason why it has lower weight especially when the target portfolio return reaches the upper range as its weight in suboptimal portfolio illustrates.
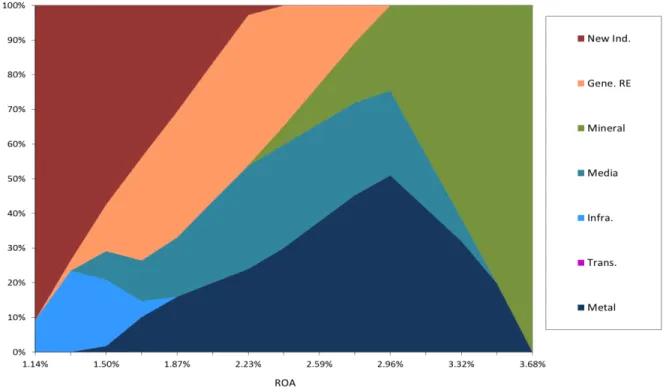
It is worthwhile to mention that there is no notable difference between the suboptimal portfolios of both cases. Both portfolios consist mainly of Metal (with 2004: 50.62%, without 2004: 46.55%), Media (25.63%, 27.23%), and Mineral (21.62%, 26.22%). Figure 11 and Figure 12 represents the portfolio compositions on the efficient frontier for any given target ROA for analyses both with and without 2004, and they illustrate how handling data 2004 alters portfolio compositions. Historical portfolio composition is also presented in Figure 13 for comparison purpose.
Figure 10: Efficient Frontier, Portfolios, and Performance of each unit
Table 10: Comparison between three portfolios (without 2004)
Since this paper bases Suboptimal Portfolio and discuss how one can improve it, whether data with or without 2004 makes only a slight difference, so further analysis is conducted based only on the data without 2004, which provides more conservative and risk averse insight because of its higher average correlation.
Expected Standard Return Deviation (%) (%) Current 11.35 16.01 10.01 18.33 20.82 13.71 9.77 2.237 0.983 2.276 Tangency 30.53 0.00 0.00 69.47 0.00 0.00 0.00 2.377 0.620 3.836 Suboptimal 46.55 0.00 0.00 27.23 26.22 0.00 0.00 2.857 0.982 2.910 WeightsJ(%) Sharpe Ratio Metal Trans. Infra. Media Mineral Gene.JRE NewJInd.
Figure 11: Area Chart of Portfolio Weights on the Efficient Frontier (with 2004)
Figure 13: Historical Portfolio Weights of Sumitomo Corporation
4.3. Index Model
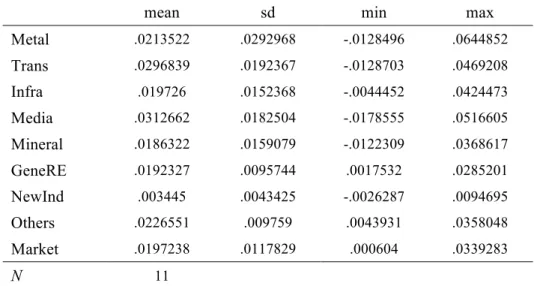
Summary statistics of ROA of each market segment and the entire market sorted according to Table 2 is presented in Table 11. Lines in Figure 14 represent historical ROA of market segments. The Sharpe ratio of each segment is also calculated in Table 12. As the tables and the figure indicate, Media segment has the highest mean return (3.13%), and New Industry Development segment has the lowest (0.34%) mainly because of the low return of Banking category. As to Sharpe ratio, Others is the highest (2.32), and Metal Products is the lowest (0.73).
Figure 15 shows historical market portfolio compositions calculated based on market value by segment are shown as an area chart. As seen from the figure, Mineral segment has by far the largest share in the market.
Table 11: Summary Statistics of Historical ROA of Each Segment in the Market
mean sd min max
Metal .0213522 .0292968 -.0128496 .0644852 Trans .0296839 .0192367 -.0128703 .0469208 Infra .019726 .0152368 -.0044452 .0424473 Media .0312662 .0182504 -.0178555 .0516605 Mineral .0186322 .0159079 -.0122309 .0368617 GeneRE .0192327 .0095744 .0017532 .0285201 NewInd .003445 .0043425 -.0026287 .0094695 Others .0226551 .009759 .0043931 .0358048 Market .0197238 .0117829 .000604 .0339283 N 11
Table 12: Sharpe Ratio of Each Segment in the Market
Figure 15: Historical Market Portfolio Compositions
(1) (2) (3)=(1)/(2)
Historical Standard Sharpe Historical Sharpe
Mean Deviation Ratio Mean Ratio
Metal;Products 0.02135 0.02930 0.72882 4 8 Transportation;&;Construction; Systems 0.02968 0.01924 1.54309 2 4 Infrastructure 0.01973 0.01524 1.29463 5 5 Media,;Network;&;Lifestyle;Retail 0.03127 0.01825 1.71318 1 3 Mineral;Resources,;Energy,;Chemical; &;Electronics 0.01863 0.01591 1.17126 7 6 General;Products;&;Real;Estate 0.01923 0.00957 2.00876 6 2 New;Industry;Development;&;CrossU function 0.00344 0.00434 0.79331 8 7 Others 0.02266 0.00976 2.32145 3 1 Ranking
Risk premiums of segments without 2004 data are summarized in Table 13. Table 14 lists Ordinary Least-square Regression (OLS) results. With constant, none of the beta coefficients are statistically significant, and two of the constant terms are not statistically significant either. Another alternative is Regression Through the Origin (RTO), the regression analysis which suppresses constant term. On one hand, Index Model has a constant term by definition as shown in Equation 14. On the other hand, RTO seems more appropriate approach if it gives less standard error and better fit to the model than OLS does. (Hahn, 1977) (Eisenhauer, 2003)
Then RTO is also conducted and Table 15 shows the results. Figure 16 illustrates the relationships between ROA of each segment and the market ROA as a scatterplot, and the slope of each fitted line represents the accounting beta of each segment, which measures the systematic risk of each. As seen in Table 15, all the segments have statistically significant beta coefficients, and they all have less standard error and much higher R-square than OLS results. Therefore, this paper concludes RTO is appropriate, and further analyzes the data based on the RTO results. Nevertheless, this matter should be carefully handled and may require further discussion since whether OLS or RTO is used for analysis could alter the conclusion of this paper. However, because of the availability of historical returns of the subject and the market, the number of sample data is very limited, and no more precision can be expected.
Table 16 presents accounting beta of each market segment to the market, and the comparison to Table 15 indicates that Sumitomo Corporation has lower accounting beta than industry average in five segments (Metal, Transportation, Infrastructure, Media, and General Products & Real Estate), and higher accounting betas in the other two segments (Mineral and New Industry Development).9
"""""""""""""""""""""""""""""""""""""""""""""""""""""""""""""
9"This" is" not" the" main" topic" of" this" paper," but" the" results" seems" to" be" inconsistent" with" the" theory" that"
Table 13: Summary Statistics of Historical Risk Premium of Each Segment of Sumitomo Corporation
mean sd min max
Metal .0249703 .0097972 .0127534 .0449919 Trans .0160091 .0074139 .0061638 .031058 Infra .0169765 .0125265 -.0003997 .0353845 Media .0199004 .0079124 .0082402 .0325116 Mineral .0350965 .0215015 .0092451 .073834 GeneRE .016953 .0057964 .0099995 .0270123 NewInd .0090933 .0095754 -.008835 .0248886 TTL .0200395 .0085575 .0056193 .0334324 N 10
Table 14: Accounting Betas with Constant
(1) (2) (3) (4) (5) (6) (7) (8)
Metal Trans Infra Media Mineral GeneRE NewInd TTL
Market -0.03121 0.2112 0.02403 0.3473 -0.05130 0.2672 0.3912 0.1246 (0.9189) (0.3486) (0.9511) (0.1308) (0.9392) (0.1093) (0.1642) (0.6394) _cons 0.02549** 0.01251* 0.01658 0.01416** 0.03595* 0.01253** 0.002622 0.01798** (0.0026) (0.0180) (0.0596) (0.0087) (0.0243) (0.0028) (0.6199) (0.0077) N 10 10 10 10 10 10 10 10 R2 0.0014 0.1102 0.0005 0.2616 0.0008 0.2886 0.2267 0.0288 p-values in parentheses * p < 0.05, ** p < 0.01, *** p < 0.001
Table 15: Accounting Betas without Constant
(1) (2) (3) (4) (5) (6) (7) (8)
Metal Trans Infra Media Mineral GeneRE NewInd TTL
Market 1.0338** 0.7342** 0.7168* 0.9388*** 1.4508* 0.7910*** 0.5008** 0.8759** (0.0054) (0.0014) (0.0192) (0.0004) (0.0142) (0.0003) (0.0051) (0.0027) N 10 10 10 10 10 10 10 10 R2 0.5959 0.6979 0.4737 0.7712 0.5056 0.7796 0.6009 0.6496 p-values in parentheses * p < 0.05, ** p < 0.01, *** p < 0.001
Table 16: Accounting Betas of Market Segments
(1) (2) (3) (4) (5) (6) (7) (8)
Metal Trans Infra Media Mineral GeneRE NewInd Others Market 1.3165*** 1.4109*** 1.0059*** 1.4691*** 1.0317*** 0.9091*** 0.2193*** 1.0249*** (0.0005) (0.0000) (0.0000) (0.0000) (0.0000) (0.0000) (0.0000) (0.0000) N 11 11 11 11 11 11 11 11 R2 0.7224 0.8424 0.8687 0.8685 0.9501 0.9395 0.8544 0.9023 p-values in parentheses * p < 0.05, ** p < 0.01, *** p < 0.001
The Accounting beta, Jensen’s Alpha, and the Treynor ratio of each segment are summarized in Table 17 and Table 18. Figure 17 depicts those measures graphically. 10 As to rankings, smaller number indicates higher mean return, Sharpe ratio, Jensen’s Alpha, and Treynor ratio, and lower beta. Mineral has the highest accounting beta (1.45), and New Industry Development has the lowest (0.50). Top three high accounting beta segments (Mineral, Metal, and Media) are also the top three high mean return segments, and there seems to be a strong correlation between mean return and accounting beta, which means higher returns are due to higher systematic risk.This can be examined by following Jensen’s Alpha and Treynor ratio analysis.
As to Jensen’s Alpha, it is noteworthy that all segments have positive alphas. Above all, Mineral is the highest (0.93%) followed by Metal (0.76%) and Infrastructure (0.48%), and it indicates these segments outperform the market the most in absolute term. As to Treynor ratio, Metal is the highest (0.027) followed by Infrastructure and Mineral, and it indicates these segments outperform the market the most relative to their systematic risks.
Large alphas and high Treynor ratios in Metal, Media, and Mineral unit indicate that high performing units have high systematic risk but also high alpha both in relative and absolute terms.
"""""""""""""""""""""""""""""""""""""""""""""""""""""""""""""
10"Index" model" analysis" was" also" made" based" on" estimated" EBIT" of" each" segment" and" Market" EBIT" to" exclude"
financial"leverage"and"income"tax"effect."While"all"segments"got"lower"betas"with"EBIT"than"with"net"income,"which" is" consistent" with" the" theory," relative" rankings" were" unchanged." While" net" income" of" each" segment" is" officially" announced" by" the" company," EBIT" is" estimated" based" on" net" income" and" total" assets" of" each" segment" and" net" interest" expenses" and" income" taxes" of" the" entire" company," this" paper" focuses" on" net" income" approach" for" precision."
Table 17: Accounting Beta of Each Segment
Table 18: Jensen’s Alpha and Treynor Ratio of Each Segment
Figure 17: Mean Return and Jensen’s Alpha of Each Segment
(1) (2) (3)=(1)/(2) (4)
Historical Standard Sharpe Accounting (1) (3) (4)
Mean Deviation Ratio Beta Mean Sh. Beta
MetalAProducts 0.02730 0.01182 2.30854 1.03384 2 3 6 TransportationA&AConstructionA Systems 0.01833 0.00863 2.12464 0.73423 6 4 3 Infrastructure 0.01930 0.01482 1.30264 0.71685 4 7 2 Media,ANetworkA&ALifestyleARetail 0.02223 0.00732 3.03650 0.93885 3 1 5 MineralAResources,AEnergy,A ChemicalA&AElectronics 0.03742 0.02204 1.69776 1.45080 1 5 7 GeneralAProductsA&ARealAEstate 0.01928 0.00674 2.85999 0.79095 5 2 4 NewAIndustryADevelopmentA&A CrossWfunction 0.01142 0.00869 1.31389 0.50080 7 6 1 Ranking (1) (5) (6)=(1)'(5) (7)=(1)/(4)
Historical CAPM Jensen's Treynor Jensen's Treynor
Mean Forecast Alpha Ratio Alpha Ratio
MetalBProducts 0.02730 0.02035 0.00694 0.02640 2 2 TransportationB&BConstructionB Systems 0.01833 0.01479 0.00354 0.02497 5 4 Infrastructure 0.01930 0.01447 0.00483 0.02693 3 1 Media,BNetworkB&BLifestyleBRetail 0.02223 0.01859 0.00364 0.02367 4 6 MineralBResources,BEnergy,B ChemicalB&BElectronics 0.03742 0.02809 0.00933 0.02579 1 3 GeneralBProductsB&BRealBEstate 0.01928 0.01584 0.00344 0.02437 6 5 NewBIndustryBDevelopmentB&B Cross'function 0.01142 0.01046 0.00096 0.02280 7 7 Ranking
4.4. Performance Attribution
The results of performance attribution are presented in Table 19, Table 20, Table 21, and Table 22. As seen in Table 19, a large part of the contribution of segment allocation comes from Metal and Media. As a whole, it seems that the company has negative active weight in poorly performing segment such as New Industry, and allocates more capital to high-performing segment such as Media, which leads to the overall positive contribution of segment allocation.
As seen in Table 20, Mineral has by far the highest excess market return (1.73%). Mineral also has the highest market weight, and this is why it contributes a great deal to the overall excess market return which comes from project/investment selection. New Industry and Metal have the next highest excess market return, but because of its low market weight, the contribution of Metal is limited. On the other hand, Transportation and Media have negative excess market return, and they are the least contributing segments.
As to interaction effect, Mineral makes huge and negative contribution (-0.13%) because it has lower weight than market regardless of its large excess market return. So does New Industry (-0.04%). On the contrary, Media contributes negatively (-0.05%) because it has higher weight than market although it has negative excess market return as well as Transportation (-0.03%).
As seen in Table 22, in aggregate, Metal and Mineral lead the total excess market return respectively by 0.24% and 0.21%, followed by Infrastructure (0.11%), and Transportation and Media have negative contributions of -0.10% and -0.01%. General Products & Real Estate has a slightly positive contribution of 0.05%.