Curvature Driven Phase Separation in Mixed Ligand Coated Gold Nanoparticles
By
Paulo H. Jacob Silva
Submitted to the Department of Materials Science and Engineering in Partial Fulfillment of the Requirements for the
Degree of Bachelor of Science
at the
Massachusetts Institute of Technology June 2006'
©2006 Paulo Jacob Silva. All rights reserved
The Author hereby grants to MIT permission to reproduce and to
distribute publicly paper and electronic copies of this thesis document in whole or in part.
Signature
of Author ...
..--...-.
i.
....
..
Department of Materials Science and Engineering.I_ / / May 24, 2006
Certified by
Accepted By
... ; Y. YL....~ ... W ...
Francesco Stellacci Finmeccanica Assistant Professor of Materials Science and Engineering Thesis Supervisor
...
Caroline Ross Professor of Materials Science and Engineering Chairwoman, Undergraduate Thesis Committee
Curvature Driven Phase Separation
in Mixed Ligand Coated Gold Nanoparticles
By
Paulo H. Jacob Silva
Submitted to the Department of Materials Science and Engineering in Partial Fulfillment of the Requirements for the
Degree of Bachelor of Science at the Massachusetts Institute of Technology
May 26, June 2006
ABSTRACT
Monolayer-coated gold nanoparticles have been the subject of extensive studies in fields ranging from physics to medicine. The properties of these nanomaterials such as
solubility and surface energy are often attributed solely to the chemical functionalities of the ligand head-groups. However, the morphology of these monomolecular layers on gold nanoparticles plays as important of a role as the surface chemistry. Intriguing
phase-separation phenomena have been observed for mixed self-assembled monolayers (SAM) of octanethiol (OT) and mercaptopropionic acid (MPA) on the surface of gold
nanoparticles. These ordered structures are studied here through scanning tunneling microscope (STM) images, as a function of the gold core diameter, which is a measure of the particle's curvature. The packing of OT homoligand nanoparticles is found to have a head-group spacing of 0.54 nm, which differs from that on flat gold (111) surfaces, 0.5 nm. The OT:MPA heteroligand nanoparticles are observed to phase-separate into ordered ribbon-like domains, with spacings that depend on the nanoparticle diameter. A
geometric framework that includes a continuous and crystallographic description is established to best describe the observed behaviors.
ACKNOWLEDGEMENTS
I would like to acknowledge and thank Prof. Francesco Stellacci and Alicia Jackson for their support and guidance in this research. They've shown me how to cope with a difficult concept and clarify it under the light of rationality. I'd like to mention that Prof. Stellacci, more than an academic advisor, served as personal inspiration and source of wisdom for me. Alicia has been an unparalleled source of encouragement throughout my last year at MIT, and will always remain in my kindest memories.
Table of Contents
Abstract 2
Acknowledgements 3
1. Introduction and Background 5
1.1 Initial Remarks and Outline 5
1.2 Gold Nanoparticle Background 6
1.3 Self-Assembled Monolayers (SAM) and phase separation 11
2. Experimental Procedures
2.1 Nanoparticle Synthesis 14
2.2 STM Imaging 15
2.3 Noise Analysis 17
3. Results and analysis
3.1 Continuous and crystallographic models 18
3.2 Homoligand nanoparticles 19 3.3 Heteroligand nanoparticles 22 4. Discussion 24 4.1 Homoligand-Coated Nanoparticles 24 4.2 Heteroligand-coated nanoparticles 26 5- Conclusions 29 References 31 List of Figures
Figure 1: Ligand-Coated Nanoparticle Synthesis ... 9
Figure 2: Mixed Ligand SAM formation ... 12
Figure 3: OT:MPA Monolayer ... .. ... ... ... 12
Figure 4: Noise Analysis ... 17
Figure 5: Continuous/Crystallographic Models ... ...19
Figure 6: OT Nanoparticles ... ... 20
Figure 7: DI Image-OT Nanoparticle ... 21
Figure 8: OT Final Data ... 22
Figure 9: DI OT:MPA 2:1 Image ... 23
Figure 10: Rippled Nanoparticle Data ... .. ... ... 24
Figure 11: Summary Picture ... 30
1- Introduction and Background
1. 1- Initial Remarks and Outline
Alkanethiolated gold nanoparticles have been subject of extensive studies due to their unusual properties, ease of synthesis and stability [1, 2]. The synthesis of gold nanoparticles in the presence of alkanethiols, guides their size distribution, imparts stability and creates a three dimensional self-assembled monolayer (SAM) that wraps around the crystalline gold core [1, 2, 3]. Extensive efforts have been dedicated to study how the chemical functionality of the organic ligand shell alters the properties of the nanoparticles, such as solubility [4, 5] and biological interactions [4, 6]. It has been recently recognized that the mechanisms behind many of the ligand shell properties go beyond the head-group functionality, and are also dictated by the morphology of the three dimensional SAM [3, 4, 7]. The ligand shell is the connection between the nanoparticle core and the outside molecular environment; therefore, it is essential to understand its
morphology and how it influences the properties of the nanoparticles.
The alkanethiols that comprise the ligand shell in gold nanoparticles assume different configurations depending on the size of the nanoparticles and the composition of the organic phase [3, 4]. It has been observed that for mixtures of ligands, i.e. the use of different alkanethiols to coat the nanoparticles, phase separated ribbon-like domains, exclusively comprised of each type of molecule, form on the surface of the nanoparticle [3, 4]. FTIR, NRM and neutron scattering studies were performed in these types of nanoparticles in order to understand their ligand shell morphology, however, scanning probe microscopy is best suited to directly observe and characterize the structure of these monolayers, as well as their dependence on particle diameter [2, 3 4].
This study was conducted in order to characterize the structure of these three-dimensional monolayers on gold nanoparticles as a function of the particle diameter. Different sizes of nanoparticles yield different surface curvatures, which is potentially the driving force behind this unusual phase separation process. The head-group spacings of the ligand shell for both homo and heteroligand coated nanoparticles were measured through Scanning Tunneling Microscopy (STM) imaging. The head-group distances were recorded for different diameters and compositions: Octanethiol (OT) homoligand
nanoparticles and OT:MPA (Mercapto Propionic Acid) 1:1 and 2:1 heteroligand particles were studied. Simple geometric considerations provided an estimation of the sulfur-sulfur distances on the surface of the gold nanoparticles, and both the head-group and sulfur-sulfur spacings displayed different regimens across different regions of nanoparticle diameter. These findings were related to both the curvature of the nanoparticles and the different preferential crystallographic geometries adopted by gold clusters in diameters ranging roughly from 1 to 10nm.
Part 1.2 of this paper briefly describes the background behind gold nanoparticles, followed by a summary of the important characteristics of self-assembled monolayers (SAMs) and phase separation in part 1.3. Section 2 describes the experimental
procedures, with brief mention to STM noise analysis. Results and discussion follow in part 3, which presents the geometric framework and results. Part 4 of this paper discusses and analyzes the data, offering a possible interpretation to this intriguing phenomenon.
1. 2 - Gold Nanoparticle Background
In the dawn of nanoscience, gold nanoparticles, which have been used since ancient times [1], are the most investigated nanostructures due to their useful applications. These include their catalytic properties in synthesizing nanotubes and nanowires [1,8], their biological interactions [6], medical applications (MRI contrast agent) [9] and their useful electronic properties [10]. Gold nanoparticles range anywhere from 2 to 30 nm (definitions may vary), lying therefore in a size scale that is intermediate between molecular level and bulk materials [1], which gives rise to unique properties at the intersection of quantum mechanical and macroscopic behaviors. Furthermore, together with silver, gold nanoparticles are stable and easy to synthesize [1]. Due to all these features and others beyond the scope of this introduction, it is essential to better understand the properties behind these nanostructures, which will become important materials building blocks in the future [ 1,11].
Most properties of nanoparticles arise from size constraints. For example, nanoparticles display a band-gap between valence and conduction bands that does not occur in the bulk phase [1 1, 12]. At these size scales, the de Broglie wavelength of valence electrons is comparable to the dimensions of the nanoparticles itself, which makes them behave as electronic boxes [1]. The collective oscillation of the electronic waves gives rise to the plasmon resonance, which provides these particles their
characteristic red-purple color in solution [1]. Size and shape dictate most of the electronic properties of nanoparticles, [11 ], but one of the most important features of nanoparticles is the high ratio of surface to "bulk" atoms. This characteristic can be said to be the distinguishing factor between a nanoparticle and a bulk material [18].
and 100 nm ranges from 88% to 1.2% [18]. Surface atoms are more reactive than bulk ones, due to unsatisfied bonding capabilities, which renders interfaces highly energetic and reactive.
It is not far-fetched to say that nanoparticles behave essentially as "surface
materials". This allows for strong interaction between the particles and organic molecules (thiols) that can attach to the interfacial atoms, which lowers the energy of the surface. This gives rise to the formation of the organic ligand shell that imparts many intriguing properties to the nanoparticles, such as resistance against coalescence [13], solubility in different organic solvents [5], bio-molecule sensing [6], electron transfer [18], among other features.
The ligand shell is easily assembled on the gold nanoparticle surface during synthesis. Overall, gold nanoparticles are synthesized via the reduction of a gold salt (gold III) in the presence of alkanethiols that stabilizes the final product [ 1, 2]. This procedure is known as the Brust-Schriffin method, and is schematically summarized in Figure 1. Tetrachloroaurate (HAuCl4*3H20) is the most commonly employed gold salt,
which is dissolved in ethanol or de-ionized water for the 1 or 2-phase syntheses respectively. The alkanethiols are added to the gold salt solution, and the molar ratio between gold III and thiol molecules can be altered to tune the final size ranges of the nanoparticles (the more thiols, the smaller the nanoparticles) [2, 18]. The interaction between gold III and thiol surfactants form gold-thiol complexes that reduce to gold 0 -thiol clusters upon addition of a reducing agent, usually sodium borohydride (NaBH4)
thus forming the alkanethiolated nanoparticles [1, 2, 18]. Several variables can be
modified in this procedure, such as the rate of reducing agent addition or the temperature
of the reaction, in order to control the size dispersity of the nanoparticles [1, 2, 15]. A recent modification of the synthesis procedure makes use of amine-borane complexes, which are weaker reducing agents, yielding extremely monodisperse nanoparticles [16]. A procedural description of nanoparticles synthesis is provided in the experimental section a.
NaBH,4
HAuC
4AS H
Figure 1: Schematic of thiolated gold nanoparticle synthesis [1]
As gold nanoparticles form, they display preferential geometric arrangements depending on their diameter, which is of extreme importance to this work [ 1, 3, 4, 18, 19, 20]. Gold nanoparticles are commonly depicted as spherical clusters, which is a
reasonable representation, but due to a non-trivial representation. For different ranges of diameters, the gold crystal tends to adopt different crystallographic conformations. For example, above 0.8 nm, the truncated icosahedral or cubooctahedral shape is preferred, with eight main { 111) faces truncated by six (100} facets [18]. A transition occurs around 2 to 3 nm, where the preferred morphology becomes the truncated dodecahedron, and above 4 to 5 nm, the preferred orientation becomes octahedral [4, 18, 21]. When a crystalline material, such as gold, forms a particle in the presence of a surfactant, the
a Other methods to attach alkanethiols on a nanoparticle surface include place-exchange
crystallographic orientations to which the surfactants preferably adsorb are the observed facets [18, 19]. In the case of gold-thiol clusters, the alkanethiols undergo chemisorption with similar affinity on surfaces of different crystallographic orientation [18, 20]. This induces isotropic growth of the nanoparticle facets, which causes it to be, overall,
spherical. Furthermore, facetted crystalline cores are topologically equivalent to spheres, which is equivalent to saying that the gold nanoparticle core is a sphere homeomorph. This is due to the fact that the polyhedral core can be deformed through bicontinuous transformations, which basically means no tearing and gluing, into a sphere [28]. In other words, the nanoparticle will behave topologically as a sphere, with a radius of curvature in the same magnitude as the alkanethiols ligands, which renders curvature as a potential driving force for ordering the ligand shell. In this study, both the different
crystallographic regimens and the spherical treatment are taken into account in interpreting the data.
Therefore, gold nanoparticles, similarly to other types of nanomaterials, exhibit a myriad of intriguing behaviors [1, 3]. As already mentioned, these nanostructures exhibit plasmon resonance, which imparts their unique optical properties. Gold nanoparticles can be incorporated into block copolymers to tailor the dielectric and optical properties of the material [17]. Gold nanoparticles assemble into ordered arrays of nanoparticle "atoms", termed superlattices, which evidence their potential as materials building blocks [1]. Essentially, these apparently simple nano-scale gold clusters are subject of intensive efforts in understanding and applying some of the most intriguing properties of current science.
1. 3 - Self-Assembled Monolayers (SAM) and phase separation
Self-assembled monolayers are monomolecular layers that form on surfaces due to free energy minimization [18]. When an SAM forms on a surface, several surface properties are altered, for example, the surface energy and opto-electronic behavior [3]. The chemistry of a surface can be easily modified through SAMs with the desired chemical functionality on the head-groups. There are several schemes for monolayer
formation, such as direct chemisorption of species from liquid or gaseous solution, physical vapor deposition processes, among others [18]. This study concerns the
formation of alkanethiol monolayers on gold substrates (nanoparticles), which is one of the most stable types of monolayers due to the strong sulfur-gold covalent bond and inertness of gold [18]. Inherently ordered, SAMs display a wealth of defects, similar to other crystalline materials. The characterization of these structures on flat surfaces was for long performed through spectrographic tools such as XPS, ellipsometry, etc.,
however, scanning probe microscopy techniques (AFM, STM) enabled direct observation of the SAM morphology. Although widely studied, the structure of SAMs and even the intricacies of the gold-sulphur bond remain unclear [ 18]. The current study offers a better understanding of the most challenging SAMs: the ones formed on curved surfaces.
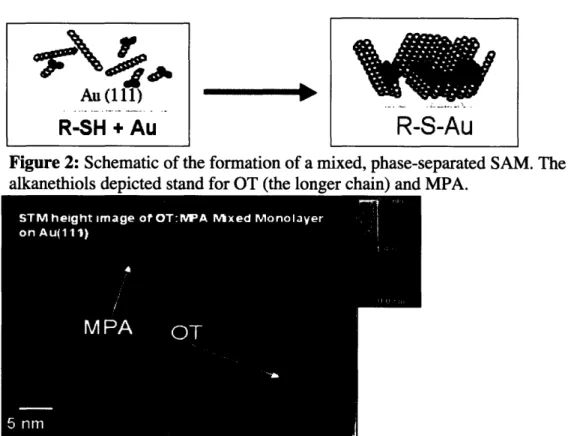
When alkanethiols become in contact with a gold surface, chemisorption takes place, which forms commensurate lattices of alkanethiols on top of the gold surface. Figure 2 illustrates this process on a flat gold (111) surface. An alkanethiol molecule reacts with a gold atom on the surface, forming a strong covalent gold-sulphur bond that minimizes the surface free energy. In addition, for certain combinations of different alkanethiols, phase separation occurs [3, 18]. This is a thermodynamically driven process,
which occurs due to free energy minimization. Qualitatively, entropy maximization drives mixing of the different alkanethiols while enthalpy minimization induces aggregation of similar molecules (maximize Van der Waals interactions). Size
mismatches and other strong differences between the alkanethiols tend to cause phase separation (stronger enthalpic component), while very similar molecules would not phase separate [ 18]. The result of this process is the formation of randomly distributed ordered domains of each molecule. Figure 3 depicts this phenomenon occurring with an
octanethiol (OT) and mercaptopropionic acid (MPA) mixed ligand SAM. The dark lower areas are MPA phases and the bright mounts correspond to OT [3]. This could be
unambiguously verified because the ratio of OT:MPA used in the synthesis of this SAM was considerably low, meaning that the predominant phase corresponds to MPA.
Figure 2: Schematic of the formation of a mixed, phase-separated SAM. The
alkanethiols depicted stand for OT (the longer chain) and MPA.
Figure 3: OT:MPA (with excess MPA) SAM on a flat gold surface. Phase separation
is evident in this figure.
12
Au (11)
R-SH + Au
R-S-Au
b., P_
The structure of the SAMs on flat gold (11 1) surfaces has been widely
documented, with the formation of a (/3 x1/3)R30° commensurate lattice overlay [18]. However, on curved surfaces the structure of SAMs is more difficult to determine due to the inherent difficulties in imaging curved surfaces with scanning probe microscopy and the unclear nature of the curved substrate [3, 4]. As outlined in the previous section, gold nanoparticles can be treated as topological spheres, however, the innate crystallographic structure still undergo different regimens depending on the size of the particles. The packing density of alkanethiols on the surface of gold nanoparticles is generally higher than on flat surfaces [18]. This can be attributed to the edges between different
crystallographic orientations on the surface of the nanoparticle. These boundaries are more frequent in a nanoparticle than on a flat surface, due to the faceted nature of the gold core. In fact, Thermal gravimetric analysis showed that on flat (111) gold surfaces, the packing density is about 33%, while in gold nanoparticles below 4.4 nm, this value was about 60% [2, 18]. Gold nanoparticles about 2 nm in diameter have 45% of its atoms placed on edges between facets [23]. The extra packing that can take place on these edges account for the higher packing density of SAMs on gold nanoparticles.
Besides analyzing the packing density of SAMs on gold nanoparticles, there is little reported on the actual morphology of these structures. Furthermore, little is known about the phase separation process on surfaces with the constraints of a nanoparticle. There are strong evidences to loose packing of the alkanethiols around the gold core from hydrodynamic radii measurements [ 18, 24]. If the alkanethiols were tightly packed, the expected hydrodynamic radius would be the gold core radius plus the length of the thiol. However, the measured radius has been consistently measured below the expected value,
which indicates loosely packed alkanethiols on the surface of nanoparticles. This study offers not only a description of phase-separation process on gold nanoparticles, but also new data that might clarify the structural organization of SAMs on nanoparticles.
2- Experimental Proceduresb
2.1- Nanoparticle Synthesis
Monolayer coated gold nanoparticles were synthesized following the Brust-Schriffin method. Two variations were used: the 1-phase [25] and the 2-phase [26] methods. On the 1-phase scheme, 0.9 mmol of tetracholoaureate (HAuCl4*3H20) were
dissolved in 200 mL of ethanol in a 0 °C ice bath. Vigorous stirring was employed from the beginning of the procedure to ensure homogeneity of the reaction. The thiols were
added to the solution in an equimolar ratio, being the total amount of thiols the same 0.9 mmol as the amount of gold salt. After letting the gold-thiol solution stir for about 10 min, 200 mL of a supersaturated solution of the reducing agent sodium borohydride (NaBH4) in ethanol was added drop-wise to the gold-thiol solution. Upon completion of
NaBH4addition, the product was stirred for two hours to ensure completion of the
reaction. The solution was then transferred to a refrigerator to precipitate. The supernatant solution was carefully removed and the precipitated nanoparticles were filtered and thoroughly washed with water, ethanol, acetone and acetonitrile. The washing step is fundamental in order to obtain molecular resolution from the STM imaging. Impurities such as remaining NaBH4might perturb the images and make any
surface features difficult to visualize. Following this procedure, nanoparticles coated with
b Alicia Jackson performed the synthesis, STM sample preparation and imaging. The
procedures provided here follow her description given in ref. 4
OT:MPA 1:0, 1:1 and 2:1 were synthesized. The total amounts of OT and MPA for each type were 0.9 mmol of OT; 0.45 mmol of OT and MPA; 0.6 mmol of OT and 0.3 mmol of MPA.
The 2-phase method follows a similar scheme, but involves a reaction on the interface between an organic and inorganic substance. 0.9 mmol of HAuCl4*3H20 were
added to 50 mL of de-ionized water. 80mL of toluene with a 4-fold excess of transfer agent TOABr (tetra-octylammonium bromide ) were added to the solution, followed by the addition of the thiols. A solution of 10 mmol of NaBH4in 30 mL of de-ionized water
was added to the gold-thiol solution, under vigorous stirring. Upon completion off the reducing agent addition, the mixture was stirred for 2 hours and then placed in a
refrigerator to precipitate. The filtration and washing steps follow those described in the 1-phase synthesis.
The composition of the ligand shell was assumed to be the same as their relative amounts in the solution. FTIR studies have recently confirmed these assumptions, therefore the composition of the nanoparticles SAMs can be safely approximated to the initial OT:MPA ratio during synthesis [4]. The nanoparticles from both 1 and 2-phase syntheses were polydisperse, with an average diameter of 4 nm. All these nanoparticles were imaged under the STM, which did not reveal strong differences between the differently synthesized nanoparticles.
2. 2- STM imaging
Samples for STM image were prepared by immobilizing them to gold substrates with dithiols. This reduced the nanoparticle mobility during imaging due to binding
between nanoparticles and substrate and sometimes between nanoparticles, which created a dense network of nanoparticles. The first method used was the formation of a 1,8 octanedithiol (ODiT) SAM on a gold surface, by immersion of the substrate in a 200 [tM ethanolic solution. After thorough rinsing, 2 mg of nanoparticles were dissolved in 10 ml of the adequate solvent (toluene or ethanol), which gave rise to a dense layer of
nanoparticles. For OT homoligand and OT:MPA 2:1 nanoparticles, a variation of this procedure was employed. Immersing the substrate in a butanethiol100.tM ethanol solution formed an SAM on the gold substrate. 3mg of nanoparticles were dissolved in
lmL of toluene, to which a 40 M (0.5 mL of toluene) excess solution of 1,10 Decanethiol was added. Upon incubation for 30 min, place exchange reactions occur, forming di-thiolated nanoparticles that arrange into densely packed nanoparticle networks. OT homoligand nanoparticles followed essentially the same procedure, however a higher
incubation time (40 min) and a higher nanoparticle concentration (5 mg in 1 mL) were used.
The images were taken using a Digital Instruments Multimode Nanoscope IIIa -E scanner, and the tips were mechanically cut platinum-iridium. Tip bias typically ranged between 900 to 1300 mV with set currents of 600 to 800 pA. Tip speeds between 0.4 and
1 [tm/s yielded clearer images. The images were then analyzed using the DI Software, from which the headgroup spacings were measured, and recorded in a spreadsheet
software, which allowed subsequent plotting of the spacings as a function of nanoparticle diameter.
2. 3 -Noise Analysisc
Brief mention must be made to the work performed by Ying Hu and Alicia Jackson in ruling out the possibility of tip speed related artifact in the STM images. This was done to ensure that the observed STM profiles reflected the true molecular
configuration of the SAMs on the nanoparticle surface. By varying the tip speed, regions that were both variable and invariable with this parameter were found. The tip speed dependent features were typically found on the gold substrate, while the features
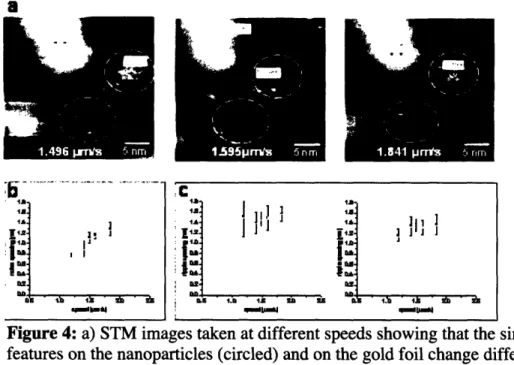
observed on the nanoparticles were independent of tip speeds. This control analysis was performed for all nanoparticles employed in this study. Figure 4 illustrates how these experiments were conducted.
a
I 1. Ii, I . a I J . Mi. i OA I ad - -- M-l~~~~~~~~~~~~~~~~~~~~~~~~~~~~~~~~~~~~~~s a _ I& *I ; .Do li - M j 111
1Ii 1 Ii
D .~ ~ . ~_ ~ _ . Lh l 1. 1 D D S 1.g 1S AM =Figure 4: a) STM images taken at different speeds showing that the similarly looking
features on the nanoparticles (circled) and on the gold foil change differently with tip speed. The features on the nanoparticle surface remain essentially constant with different tip speeds, while the gold foil features scale with tip speed. b) The
dependence of gold substrate features with tip speed, configuring noise. c) the constant spacings on the nanoparticles, which evidences the structural nature of the observed morphology
c Careful noise analysis was performed by Ying Hu and Alicia Jackson in order to rule
out tip speed related artifacts on the STM images. le
3- Results and Analysis
3. 1- Continuous and crystallographic models
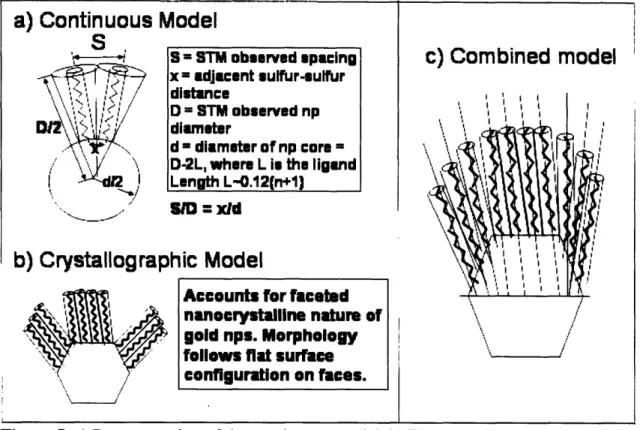
Before exposing the data collected in this study and its interpretation, it is important to describe the framework used to analyze the geometry of the nanoparticles and the distribution of ligands on their surfaces. As described in section 1.2 the facetted crystalline gold core can be treated as a sphere. There are two competing models that try to describe nanoparticles and the arrangement of ligands on the core: the continuous and crystallographic models. The continuous model treats the gold core as a sphere, which induces splaying of the alkanethiols on the surface of the nanoparticle. The
crystallographic model accounts for the facetted nature of the gold nanocrystal, and predicts that the alkanethiols adhere to the flat facets on the nanoparticle. A more complex consideration proposes a combined model in which both effects would be present on the nanoparticles, being the crystallographic component responsible for morphological changes in different crystallographic regimens of the gold nanocrystal. These models are thoroughly depicted in Figures 5a, b and c respectively.
It must be noted that the continuous model helps estimate the sulfur-sulfur spacings on the nanoparticle surface through relatively simple geometric considerations. The core diameter d was calculated by subtracting twice the ligand length L from the observed diameter D (d = D - 2L). The ligand length L was assumed to be L = 0.12(n+1) [nm], which is the length of a fully extended chain in a trans configuration [27]. This assumption is supported by FTIR data [2]. Therefore, the sulfur-sulfur distances x could be obtained by inspection of the triangle similarities, which yielded x= Sd/D, where S stands for the head-group spacing. Figure 5 describes this procedure accurately. More
details relating this model to the data obtained in this study will be considered in section 4.
a) Continuous Model
KM. = Yid
c) Combined model
Figure 5: a) Representation of the continuous model. b) The crystallographic model
c) A combination of the two frameworks, which holds great potential at accurately describing the nanoparticle geometry.
3. 2 - Homoligand Nanoparticles
In order to determine the role curvature plays in the packing of molecules on a nanoparticle, octanethiol (OT) homoligand coated nanoparticles were thoroughly analyzed. For evident reasons, phase-separation does not occur on homoligand-coated nanoparticles, which makes the surface considerably smooth and difficult to image with molecular resolution (due to lack of contrast). The nanoparticle size distribution ranged predominantly from 2 to 7 nm in diameter for both 1 and 2 phase synthesized particles. The ligand shell morphology of homoligand nanoparticles and heteroligand ones is strikingly different, which further indicates that the images are depicting the true
S = STM obeerved spacing x = adjacent ulfur-eulfur m ;____ D = STM observed np diameter d - diameter of np core -D-2L, where L i the ligand
Length L-.12(n+l
Accounts for faceted nanocrystalline nature of gold nps. Morphology
fllnwe flat iarllFma
configuration on faces.
h) rrvQ~t211nr
I1
/ -
I lrl11I1
111
rnhir_
-I
nrip-1
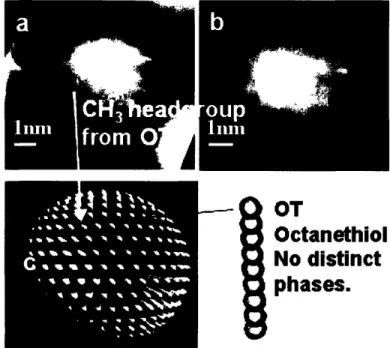
molecular features and not imaging related artifacts. The packing of the methyl head-groups was observed to occur tightly, on a hexagonal fashion, with an average spacing of 0.5 nm. Figure 6 illustrates the observed morphology of these nanoparticles and a
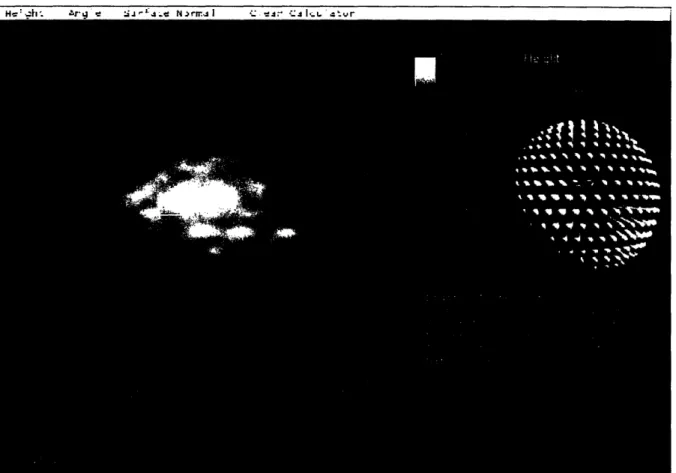
graphical rendition of their morphology. The head-groups are clearly visible in these images, and display a somewhat hexagonal packing scheme. Figure 6b shows a white horizontal stripe depicting a typical head-group spacing recorded for data analysis. Furthermore, Figure 7 depicts how OT homoligand nanoparticle head-group spacing data points were obtained from the DI software. Several measurements were made, with special attention paid to keep the measurements aligned with the fast scan lines (horizontal direction) and close to the center. This was done in order to rule out the vertical drift from the data-points and avoid the tilt angle from the edges that could alter the head-group spacing measurement. Typically 3 to 6 spacings were gathered from each nanoparticle, with a standard deviation ranging from 0.03 to 0.1 nm.
-
OT
Octanethiol
No distinct
phases.Figure 6: a) 3D profile of an STM image of an OT homoligand-coated gold
nanoparticle. b) 2D image of the same particle showing a typical head-group spacing. c) Graphical rendition of an OT homoligand nanoparticle.
H-,,l A -" 'ir J - N. trn:,.JI
Figure 7: Typical DI software screen depicting collection of a head-group spacing
data point. Inset provides graphical rendition of measurement procedure.
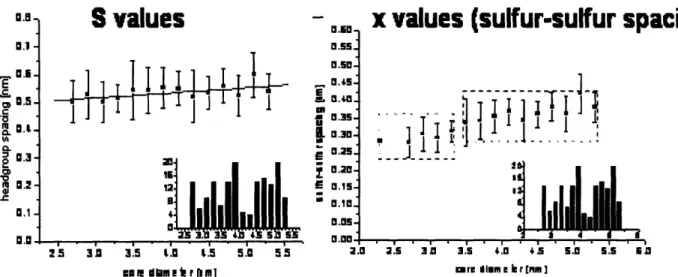
The measured head-group spacings and calculated sulfur-sulfur distances are shown in Figure 8. Measuring head-group spacings on homoligand nanoparticles is inherently more difficult than in heteroligand ones due to the lack of distinct features. Crisp images are necessary in order to visualize the head-groups and collect meaningful data. Several data points were gathered, and Figure 8 depicts the average value for each diameter and with the vertical bars showing the standard deviations. In the case of head-group spacing, no obvious trend with diameter is observed. However, upon application of the continuous model to obtain the sulfur-sulfur spacings, two distinct regions with dissimilar sulfur-sulfur distances are observed. By correlating this observation to the histogram insets in Figure 8 that show the amount of nanoparticles measured for each
diameter d, a transition region where few nanoparticles were observed corresponds to the step in sulfur-sulfur spacing behavior. This occurs approximately in diameters of 4 nm.
.. O
E- __.
....
I
. ....
h
#.
...
.
..-
.
....-'
n
U.0 -0.1 -T C. 0.5-C ,M S 0.F .. r-0 0.2-0.1 -O.0value
-., x
value
UII ul-UII ur- saparing
ass'
0.s0. 0.4 .-EG I T I_ i -M. 0.30..i 1 r J Ti; 7 , I [ [ I 0.150.]Ii'
~~0.01 P.~~~~q 12 2 5 3 3.5 t.0 1.5 5.0 55 2.0 2.s 3 3.5 4.0 4+5 s.0 s5. n*ln
Mam eie
rl
]rn Mr me ler I[ ]Figure 8: Headgroup spacing values and sulfur-sulfur distances obtained from
assuming the continuous model.
3. 3 - Heteroligand Nanoparticles
The same procedure was employed for heteroligand nanoparticles, which
displayed the phase-separated domains. In this case, the measurements were also made between two neighboring OT domains. By inspecting Figure 3 and considering that OT is a much longer molecule than MPA, it is evident that the bright higher domains correspond to OT. The measured spacings in this case represent the distances between each OT ribbon-like domain. Due to their appearance, these nanoparticles have been denominated "rippled nanoparticles" [3]. Therefore, the data for heteroligand-coated nanoparticles describe how the phase-separated domains are arranged around the nanoparticle core, depending on the diameter d.
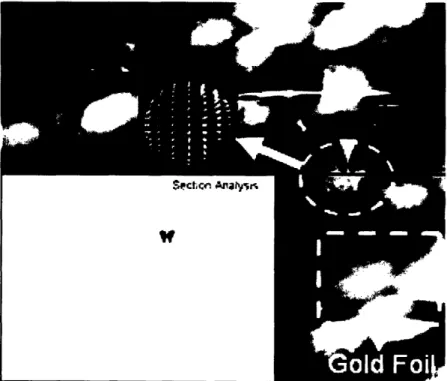
Figure 9 shows how the OT:MPA 2:1 heteroligand phase-separated domain spacings were measured, with the inset representing the topological profile across the
22 ,. j 0 1 1~~~~0 1 I . I I
dW
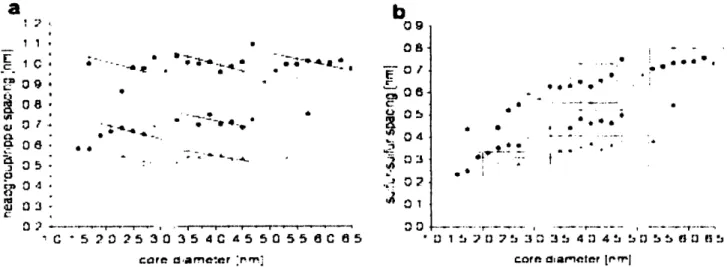
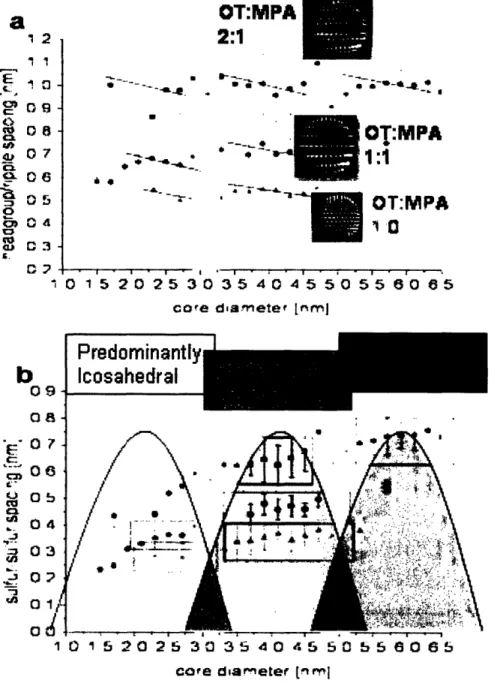
- i w .i~-- -2 S.l .. .. qk u .~ ... I . . . . I - I . . . ... r-7-- I -r--. ' -r- -r --' -r-r' I ·r-' 7-encircled nanoparticle. The difference between the featureless gold foil substrate and rippled nanoparticles is evident in this figure. Figure 10 shows the ripple spacing measured across different diameters for both OT:MPA 2:1 and 1:1 nanoparticles. The vertical bars show the regions where there are abrupt changes of ripple spacing behavior with diameter. These "jumps" occur in the same ranges for all nanoparticles analyzed, which gives strong indication that they correspond to crystallographic
changes of the gold core. In addition, the jumps occur in ranges of diameters where few nanoparticles were observed, which correspond to an unfavorable transitional
morphology of the gold core. Figure 10 shows the S values which follow a serrated saw-tooth behavior, which will be further discussed in section 4. The sulfur-sulfur spacings follow a stepwise behavior with diameter, which indicates the existence of regimens for monolayer conformation on the nanoparticle surface. The data for OT homoligand nanoparticle is included to better visualize the entire process.
Figure 9: Depiction of rippled gold nanoparticles, and how the
a
b
;> ... T 11 · OB A, - # -i , Af L, E3 ' o- o d04 .' 0 P i~04 6~~~ .6r a -- *---*---*- a a 6*.. * *6 -"C - 5 2 2 5 3 3 5 4C 5 50 5(5 dC 5 * 1 5 7 5 3 : 3 4 4 5 5j 61
care c arnmeer :r.]' corn aar'eter trrlj
Figure 10: a) S OT head-group spacing for OT:MPA 2:1 (in black), 1:1 (in red) and
OT homoligand (in green). b) The sulfur-sulfur spacings plotted against diameter for the same nanoparticles.
4- Discussion
The observation of variation in head-group spacing with core diameter indicates that the arrangement of alkanethiols on gold nanoparticles differs from that on flat surfaces. On Au (111), the thiols pack hexagonally with inter-chain spacing of 0.5 nm [29]. Here we observe differences in head-group spacings for different diameters, which indicates a more complex packing scheme of SAMs on highly curved surfaces. Homo and heteroligand coated nanoparticles will be discussed in separate section due to the specificity of the phase-separation phenomena that occurs on the heteroligand particles.
4. 1 Homoligand-Coated Nanoparticles
In the light of the continuous model, the head-group distances should decrease with diameter, eventually reaching the same value as the sulfur-sulfur spacing, as in a flat surface. This assumes that the sulfur-sulfur spacing does not depend on diameter.
When considering the crystallographic model, the edge occupancy would yield
different average head-group spacing when compared to a flat surface. In this case, the head-group spacing would be a weighted average of the spacings on the ordered facets
and crowded boundaries. Therefore, the observed spacing would be expected to increase in diameter towards the flat surface value.
However, this study showed that the head-group distances increase with diameter, but always being about 10% larger than the corresponding value on flat surfaces, which disagrees with the crystallographic model. Furthermore, the sulfur-sulfur spacing varies strongly with diameter, which is expected from the continuous model, however, there are two regions where this spacing is relatively constant. This can be seen in Figure 8, where for diameters between 2.3 to 3.3 nm and 3.5 to 5.5 nm, the sulfur-sulfur spacing versus core diameter displays a flat slope. Therefore, neither model can alone describe the observed behavior from this study. Other considerations must be made, in order to account for these inconsistencies. For example, the tilt angle assumed by molecules comprising SAMs must be accounted for when analyzing this data [18]. Molecules on SAMs tend to orient themselves with a tilt angle relative to the normal to the surface in order to maximize Van der Waals interactions (which minimizes enthalpy). If the packing on flat surfaces is the same as on the on facets of the nanoparticles, high energy defects would arise at the boundary between each facet due to abrupt changes on molecular orientation. This would be thermodynamically unfavorable, and a different packing scheme would be necessary in order to minimize free energy.
Molecular dynamics simulations performed by Landman and co-workers [30] indicate that below the molecules' melting point, the ligands would assume an overall uniform
tild angle relative to one diametric direction of the gold core (topological sphere). This agrees with the framework established in section 1.2 where the isotropic evolution of the gold nanoparticle in the presence of alkanethiols was described [18]. Furthermore, in observing STM or TEM (Transmission Electron Microscopy) images of
alkanethiolated gold nanoparticles, there's little indication of faceting, i.e. the observed structures are essentially spherical.
Therefore, a more accurate description of the geometry of these structures would lie on a possible interplay between the continuous and crystallographic models. The splaying of the alkanethiols on a spherical surface would account for larger head-group spacing, because the thiols essentially "sense" a spherical object when in contact with the nanoparticle core. Also, there would be a crystallographic component to this
interpretation, which would account for the increase in head-group spacing with diameter due to higher proportion of facets rather than edges on the gold core. These changes however would be observed as discontinuous jumps, when the crystallographic orientation of the gold core tends to change from one conformation to another, resulting in strong changes in the facet to edge ratio. This intermediate model is illustrated in Figure 5c, where both the tilt angle due to the crystallographic model and the splay due to the spherical shape of the nanoparticle are accounted.
4. 2 - Heteroligand-coated nanoparticles
On flat surfaces, as described in section 1.3, certain mixtures of molecules phase separate in order to minimize the free energy of the system [18]. As observed in Figure 3, OT and MPA undergo this process on flat surfaces, however, it is not clear what would
happen on a highly curved surface such as a gold nanoparticle. It has been observed that on gold nanoparticles, these ligands form distinct ribbon-like domains, on a molecular scale [3]. The main difference between the domains formed on gold nanoparticles and on flat surfaces is the degree of ordering. The domains of phase-separated SAMs on flat surfaces do not show any organization except within each phase. On the gold
nanoparticles however, the ripples alternate on a regular fashion, which is an
unprecedented phenomenon on SAMs [3]. It must be mentioned that on this length scale, the thermodynamic definition of phase is not an accurate description for the ripples [4]. Instead, these structures could be more accurately denominated "heterogeneous ordered mixture", however, in order to relate to the SAM literature, the term phase separation is preferred [4].
The majority of the ripples analyzed in this studied were perpendicular to the fast scan STM tip direction in order to obtain better data. As a first analysis, comparing the overall ripple spacing between OT:MPA 2:1 and 1:1 show that these distances are greater for the former particles. This can be attributed to the fact the OT domains formed on the 2:1 case are wider than in the 1:1 particles. Also, the wider the domains, the more
contrast it provides for STM imaging, which makes the 2:1 ripples more clear, as well as the saw-tooth behavior of the ripple-spacing versus diameter plots more evident.
Following the discussion on OT homoligand nanoparticles, the discontinuities on ripple spacing versus diameter plots for the heteroligand nanoparticle are observed in a more pronounced manner. A serrated saw-tooth behavior is visible, with alternated regions of decreasing ripple spacing with diameter, as depicted in Figure 10a. When the sulfur-sulfur spacings are plotted against diameter (Figure 10b), a stepwise behavior
becomes apparent, which indicates different packing arrangements depending on the crystallographic nature of the nanoparticle. The abrupt changes that occur between the different regimens agree with the morphological nanocrystal description given in section 1.2. For small diameters (below 2 to 3 nm) the icosahedral shape is predominant,
followed by truncated dodecahedron morphology up to about 5.5 nm, after which an octahedral geometry is more frequent [18].
The same overall reasoning used for homoligand nanoparticles apply in the case of heteroligand. Splay due to the topological spherical behavior of the nanoparticle causes the observed head-group spacing to decrease with diameter. This is interrupted by changes on the crystallographic nature of the nanoparticle, due to a reduction of the edge to facet ratio, which causes the head-group spacing to increase (jump). However this is only observed as a transitional behavior, when the ratio of edge to facet undergoes significant changes due to the preferential crystallographic orientations depending on the size of the nanoparticles. The sulfur-sulfur spacing follows a stepwise behavior with regions of constant distances. This occurs due to the curvature driven splay of the ligands, because the actual orientation on the surface (sulfur-sulfur spacings) remains the same for a given nanocrystal morphology. Therefore, the mixed continuous and crystallographic models provide an accurate description of the dependence of head-group
The driving forces behind the ordered phase separation still need more
investigation. Molecular dynamics simulations can shed additional light on this process. However, it is not far-fetched to observe that the process is driven by energy
minimization, and that the curvature of the topological sphere that the nanoparticle represents influences this process, possibly driving the formation of ordered domains.
This is a size-related phenomenon, within the heart of nanoscience, because it is a size related constraint (molecular level curvature) that drives the ordered phase separation. It
is possible, for example, that the head-group entropy is maximized through the formation of these domains, because smaller MPA molecules would surround the taller OT,
yielding it more motile freedom. Interestingly, this observation accounts head-group entropy as the order driving force, which is not an intuitive consequence of an entropic process. More work is needed on this model, to better understand how molecules pack on nanoparticles.
5- Conclusions
STM images were used to analyze the morphology of alkanethioled gold
nanoparticles with molecular resolution. The differences between homo and heteroligand nanoparticles were evident from the images and data presented in this study. The main difference between these two classes of nanoparticles is attributed to unprescedented molecular level ordered phase separation in the case of heteroligand nanoparticles. This does not mean that all mixtures of ligand on gold nanoparticles would yield this type of phase separation, however, there is strong evidence that phase separating combinations will form ordered domains on nanoparticles.
The measured head-group spacings and calculated sulfur-sulfur distances follow a serrated saw-tooth and stepwise behavior when plotted against particle diameter. This unique behavior was attributed to a non-trivial interplay between the continuous and crystallographic models. Due to the topological spherical behavior of the nanoparticle
increased diameter, which is attributed to the crystallographic model. A depction of these findings is given in Figure 11, which summarizes the described behavior.
a
12
11 S 0s C,07
04a03
i. C, OT:MPA 2:1 * . U -* -- * I ' , ! · . I ., I i I r -OT:MPA 1:1 OT:MPA 'a·0 1
5
20 25 30
35
40 45 50 55 60 5
core dla eter I[nm
b
0 F 0 c-0 b.o o 1 o 01 0 1 5 20 25 3 35 40 45 50 55 60 65
core diarnetef [fmtljFigure 11: a) head-group spacing for each nanoparticle analyzed, as a function of
diameter. b) Sulfur-Sulfur spacing as a function of diameter, showing the preferential crystallographic morphologies given a diameter range. The transitions are clearly consistent between nanoparticles.
30 .-. .-. -I ar a I,_ 0 _e .;-% a, - -0-
A thorough understanding of the morphology of SAMs on gold nanoparticles is important in order to better understand the mechanisms behind self-assembly as well as the properties of nanoparticles. These mixed monolayer-coated nanoparticles offer great potential, due to their unusual solubility and resistance to non-specific adsorption of proteins [3]. The phase separation morphology might hold the key to explaining these properties, rather than simply analyzing the head-groups' chemical functionality. For example, the reason behind non-specific protein adsorption resistance lies in the fact that the chemically different molecular domains are too small for the protein to conform to, making adsorption energetically unfavorable [3].
References
1. Daniel, M. C.; Astruc, D. Chem Rev 2004, 104, 293-346.
2. Hostetler, M. J.; Wingate, J. E.; Zhong, C. J.; Harris, J. E.; Vachet, R. W.; Clark, M. R.; Londono, J. D.; Green, S. J.; Stokes, J. J.; Wignall, G. D.; Glish, G. L.; Porter, M. D.; Evans, N. D.; Murray, R. W. Langmuir 1998, 14, 17-30. 3. Jackson, A. M.; Myerson, J. W.; Stellacci, F. Nat Mater 2004, 3, 330-336. 4. Jackson, A. M.; Hu, Y.; Jacob Silva, P.; Stellacci, F. submitted to J Am Chem Soc
2006
5. Lucarini, M.; Franchi, P.; Pedulli, G. F.; Gentilini, C.; Polizzi, S.; Pengo, P.;
Scrimin, P.; Pasquato, L. J Am Chem Soc 2005, 127, 16384-16385
6. You, C. C.; De, M.; Han, G.; Rotello, V. M. J Am Chem Soc 2005, 127, 12873-12881.
7. Glotzer, S. C. Science 2004, 306, 419-420.
8. Gudiksen, M. S.; Lieber, C. M. J. Am. Chem. Soc. 2000, 122, 8801.
10. Andres, R. P.; Bein, T.; Dorogi, M.; Feng, S.; Henderson, J. I.; Kubiak, C. P.; Mahoney, W.; Osifchin, R. G.; Reifenberger, R. Science 1996, 272, 1323-1325 11. Paulini, R.; Frankamp, B. L.; Rotello, V. M. Langmuir 2002, 18, 2368-2373. 12. McConnell, W. P.; Novak, J. P.; Brousseau, L. C.; Fuierer, R. R.; Tenent, R. C.;
Feldheim, D. L. Journal of Physical Chemistry B 2000, 104, 8925-8930 13. Alivisatos, A. P. Semiconductor Clusters, Nanocrystals, and
Quantum Dots. Science 1996, 271, 933-937.
14. Terrill, R. H.; Postlethwaite, T. A.; Chen, C. H.; Poon, C. D.; Terzis, A.; Chen, A. D.; Hutchison, J. E.; Clark, M. R.; Wignall, G.; Londono, J. D.; Superfine, R.; Falvo, M.; Johnson, C. S.; Samulski, E. T.; Murray, R. W. JAm Chem Soc 1995,
117, 12537-12548.
15. Jorgensen, J. M.; Erlacher, K.; Pedersen, J. S.; Gothelf, K. V.; Langmuir 2005, 21, 10320-10323
16. Zheng, N; Fan, J.; Stucky, G. D; JAm Chem Soc 2006, 128, 6550-6551 17. Park, C.; Yoon, J.; Thomas, E. L; Polymer 44 2003, 6725-6760
18. Love, C. J.; Estroff, L. A.; Kriebel, J. K; Nuzzo, R. G.; Whitesides, G. M; Chem Rev 2005, 105, 1103-1169
19. Weissbuch, I.; Addadi, L.; Lahav, M.; Leiserowitz, L. Science 1991, 253, 637 20. Using surfactants other than alkanethiols, such as cetyltrimethylammonium bromide (CTAB), it is possible to synthesize gold and silver rods: Murphy, C. J.; Jana, N. R. Adv. Mater. 2002, 14, 80.
21. Zanchet, D.; Hall, B. D.; Ugarte, D. J Phys Chem B 2000, 104, 11013-11018. 22. Bain, C. D. & Whitesides, G. M.Modeling organic-surfaces with self-assembled
monolayers. Angew. Chem. Intl Edn 28, 506-512 (1989). 23. Hostetler, M. J.; Stokes, J. J.; Murray, R. W. Langmuir 1996, 12, 3604.
24. Wuelfing, W. P.; Templeton, A. C.; Hicks, J. F.; Murray, R. W.
Anal. Chem. 1999, 71, 4069.
25. Kang, S. Y.; Kim, K. Langmuir 1998, 14, 226-230
26. Brust, M.; Walker, M.; Bethell, D.; Schiffrin, D. J.; Whyman, R. J Chem Soc
Chem Comm 1994, 801-802
27. Whetten, R. L.; Shafigullin, M. N.; Khoury, J. T.; Schaaff, T. G.; Vezmar, I.; Alvarez, M. M.; Wilkinson, A. Accounts Chem Res 1999, 32, 397-406. 28. Hocking, J. G.; Young, G. S.; Topology; Dover, New York 1988
29. Poirier, G. E.; Tarlov, M. J.; Rushmeier, H. E. Langmuir 1994, 10, 3383-3386. 30. Luedtke, W. D.; Landman, U. J Phys Chem B 1998, 102, 6566-6572
![Figure 1: Schematic of thiolated gold nanoparticle synthesis [1]](https://thumb-eu.123doks.com/thumbv2/123doknet/14531337.533676/9.924.268.642.347.507/figure-schematic-thiolated-gold-nanoparticle-synthesis.webp)