HAL Id: inserm-00339565
https://www.hal.inserm.fr/inserm-00339565
Submitted on 22 Jan 2009HAL is a multi-disciplinary open access archive for the deposit and dissemination of sci-entific research documents, whether they are pub-lished or not. The documents may come from teaching and research institutions in France or abroad, or from public or private research centers.
L’archive ouverte pluridisciplinaire HAL, est destinée au dépôt et à la diffusion de documents scientifiques de niveau recherche, publiés ou non, émanant des établissements d’enseignement et de recherche français ou étrangers, des laboratoires publics ou privés.
and immune response predicts survival in elderly
patients with diffuse large B-cell lymphoma treated with
CHOP and rituximab.
Jean-Philippe Jais, Corine Haioun, Thierry Molina, David Rickman, Aurélien
de Reynies, Françoise Berger, Christian Gisselbrecht, Josette Brière, Félix
Reyes, Philippe Gaulard, et al.
To cite this version:
Jean-Philippe Jais, Corine Haioun, Thierry Molina, David Rickman, Aurélien de Reynies, et al.. The expression of 16 genes related to the cell of origin and immune response predicts survival in el-derly patients with diffuse large B-cell lymphoma treated with CHOP and rituximab.. Leukemia, Nature Publishing Group: Open Access Hybrid Model Option B, 2008, 22 (10), pp.1917-24. �10.1038/leu.2008.188�. �inserm-00339565�
The expression of 16 genes related to the cell of origin and immune response predicts survival in elderly patients with Diffuse large B-cell lymphoma treated with CHOP and Rituximab.
Jean-Philippe Jais1,2, Corinne Haioun3, Thierry J Molina2,4, David S Rickman5, Aurélien de
Reynies5, Françoise Berger6, Christian Gisselbrecht7, Josette Brière7, Felix Reyes† 3, Philippe
Gaulard3,8, Pierre Feugier9, Eric Labouyrie9, Hervé Tilly10, Christian Bastard10, Bertrand
Coiffier6, Gilles Salles6, and Karen Leroy3,8 for the Groupe d’Etude des Lymphomes de
l’Adulte.
1 Service de Biostatistiques, AP-HP, hôpital Necker, Paris, France; 2 Faculté de Médecine,
Université Paris Descartes, Paris, France; 3 Service d’Hématologie Clinique and Département
de Pathologie, AP-HP, hôpital Henri Mondor; Université Paris 12, Créteil, France ; 4
Département de Pathologie, AP-HP, hôpital Hôtel-Dieu, Paris, France ; 5 Programme CIT, Ligue Nationale Contre le Cancer, Paris, France ; 6 Service d’Hématologie and Service
d’Anatomo-Pathologie, Hospices Civils de Lyon ; Université Lyon 1 ; UMR CNRS 5239, Pierre-Bénite, France; 7 Service d’Hématologie and Département de Pathologie, AP-HP,
hôpital Saint-Louis; Université Paris 7, Paris, France; 8 INSERM, Unité 841, IMRB, équipe
n°9, Créteil, France; 9 Service d’Hématologie and Département de Pathologie, hôpitaux de
Brabois, Vandoeuvre les Nancy, France; 10 Service d’Hématologie and d’Oncologie
Moléculaire, Centre Henri Becquerel, Rouen, France;
This study was supported by grants of the Ligue Nationale Contre le Cancer (programme Carte d’Identité des Tumeurs), the Programme Hospitalier de Recherche Clinique (AOM 03060) and an unrestricted grant from Roche.
Running title: DLBCL mRNA signature and survival after R-CHOP
Keywords: Diffuse B-cell Lymphoma; Rituximab; Gene expression; Prognosis
Corresponding author :
Professor Karen Leroy, MD, PhD, INSERM, Unité 841, équipe N°9
Département de Pathologie, Hôpital Henri Mondor, 51 avenue du maréchal de Lattre de Tassigny. Créteil, F-94000, France
ABSTRACT
Gene expression profiles have been associated with clinical outcome in patients with Diffuse Large B-Cell Lymphoma (DLBCL) treated with anthracycline containing chemotherapy. Using Affymetrix HU133A microarrays, we analyzed the lymphoma transcriptional profile of 30 patients treated with CHOP (cyclophosphamide, doxorubicin, vincristine, prednisone) and 23 patients treated with Ritxumab (R)-CHOP in the Groupe d’Etude des Lymphomes de l’Adulte clinical centers. We used this data set to select transcripts showing an association with progression free survival in all patients or showing a differential effect in the two treatment groups. We performed real-time quantitative RT-PCR in the 23 R-CHOP samples of the screening set and 44 R-CHOP additional samples to evaluate the prognostic significance of these transcripts. In these 67 patients, the level of expression of 16 genes and the cell of origin classification were significantly associated with overall survival, independently of the International Prognostic Index. A multivariate model comprising 4 genes of the cell of origin signature (LMO2, MME, LPP and FOXP1) and 2 genes related to immune response, identified for their differential effects in R-CHOP patients (APOBEC3G and RAB33A), demonstrated a high predictive efficiency in this set of patients, suggesting that both features affect outcome in DLBCL patients receiving immunochemotherapy.
INTRODUCTION
Diffuse Large B-Cell Lymphoma (DLBCL) represents roughly 30% of non-Hodgkin Lymphoma in adult patients (1). Half of the patients can be cured with anthracycline-based chemotherapy. Although the highly variable outcome reflects underlying molecular heterogeneity, the therapeutic stratification of patients currently relies on the use of the International Prognostic Index (IPI) based on clinical prognostic factors (2). During the last years, the availability of DNA microarray technology made it possible to get important insights into the molecular heterogeneity of this disease and demonstrated the existence of distinct sub-groups harboring specific gene expression signatures (3). The Lymphoma/Leukemia Molecular Profiling Project showed that these lymphomas could be separated in 3 groups: those with a Germinal Center (GC) profile, those with an Activated B-Cell (ABC) profile, and a third group, called type III (4, 5). Later on, using a consensus clustering approach, Monti et al showed that DLBCL comprised 3 discrete subsets: “Oxidative Phosphorylation” (OxPhos), “B-cell receptor/Proliferation” (BCR/Prolif) and “Host Response” (HR), that did not overlap with the Cell of Origin (COO) classification (6). DLBCL with a GC profile were shown to be associated with a better overall survival (OS) than DLBCL with an ABC profile in two independent large series (5, 6), whereas OxPhos, BCR/Prolif and HR DLBCL subsets did not show prognosis significance. Several groups attempted to identify gene signatures that would specifically be helpful to predict outcome, and proposed predictors based on the expression of 6 to 17 genes, established in patients who had received conventional chemotherapy (5, 7, 8).
The GELA LNH98.5 clinical trial demonstrated the benefit of rituximab association with CHOP chemotherapy in elderly patients with DLBCL (9, 10). The addition of an anti-CD20 monoclonal antibody to chemotherapy has now become a standard in this disease (11). The mechanism of action of this drug was shown to depend on antibody dependant cell cytotoxicity, complement dependant cytotoxicity and direct induction of cell death in in vitro experiments, animal models and clinical studies (12). However, the mechanism prevailing in
It is noteworthy that several individual prognostic markers established in patients treated by chemotherapy, such as BCL2 (15) or BCL6 (16) protein expression, were shown to lose their significance in patients receiving R-chemotherapy.
This prompted us to investigate the lymphoma transcriptional profile of patients included in the LNH98.5 trial, in order to determine which individual genes retain or gain prognostic significance and whether the Cell of Origin molecular signature remains a valid prognostic marker, in the context of rituximab association with chemotherapy.
MATERIAL AND METHODS
Patients’ characteristics and lymphoma samples
Frozen lymphoma samples were obtained retrospectively from 97 newly diagnosed, previously untreated patients with DLBCL. 52 patients had been enrolled in the LNH98.5 clinical trial of the GELA between August 1998 and March 2000 and had signed an informed consent. Twenty eight of these patients had received R-CHOP and 24 had received CHOP treatment. Details regarding the design, data management and clinical results of this trial have been already published (9, 10). Samples from 45 additional patients who presented the same criteria than those required to enter the LNH98.5 trial (ie, previously untreated DLBCL, 60 to 80 years of age, no previous history of indolent lymphoma) and who had received either CHOP (n= 6) or R-CHOP (n=39) treatment in GELA Centers (Saint-Louis/Paris, Créteil, Lyon, Nancy or Rouen) between March 1998 and July 2004 were added to this study. The institutional review board “Comité de Protection de Personnes – Ile de France IX” authorized the use of these samples and associated clinical data and approved this study. The study comprised a screening set, based mostly on the LNH98.5 trial, and a complementary set, corresponding mostly to additional patients (supplementary Table 1).
All cases were reviewed by 3 hematopathologists (TM, JB and PG) and diagnosed as DLBCL according to the criteria of the WHO classification. Tumor infiltration of the frozen samples was checked on Hemalun Eosin Safran staining of tissue sections. Total RNA were extracted from frozen tissue samples with TRIZOL reagent (Invitrogen), according to the
manufacturer’s instructions and RNA integrity was analyzed by electrophoresis on a 2100 Agilent Bioanalyzer (Agilent, Massy, France) to select samples that could be used in Affymetrix experiments.
Microarray procedures
Microarray analyses were performed using 5 µg of total RNA of each sample as starting material and 10 µg cRNA per hybridization (GeneChip Fluidics Station 400). The total RNAs were amplified and labeled following the manufacturer’s one-cycle target labeling protocol (http://www.affymetrix.com). The labeled cRNAs were then hybridized to HU133A Affymetrix GeneChipTM arrays (Affymetrix, Santa Clara, CA, USA). The chips were scanned with an
Affymetrix GeneChip Scanner 3000 and subsequent images analyzed using GCOS 1.4. Raw feature data were normalized and log2 intensity expression summary values for each probe
set were calculated using robust multi-array average (RMA package affy V1.4.32) (17). Probe sets corresponding to control genes or having a “_x_” annotation were masked yielding a total of 19787 probe sets for further analyses. The microarray and associated clinical data used in this study have been deposited in Array Express public database (accession number: E-TABM-346).
Taqman Low density arrays experiments
cDNAs were reverse-transcribed from 4 µg total RNAs in a volume of 100 µl, with the High capacity Archive Kit (Applied Biosystems, Courtaboeuf, France), according to the manufacturer’s instructions. Ten µl cDNA were diluted in 90 µl water and 100 µl 2X Universal Taqman Master Mix (Applied Biosystems) to load the custom microfluidic card (96 assays*4 per card). Thermocycling was performed with a 7900HT Fast real-time PCR system (Applied Biosystems). Analysis was done with the SDS 2.2.1 software (Applied Biosystems), using a manual adjustment for base line and threshold level to insure identical settings for the 20 cards used. 1 assay (IGHM-Hs00385741_m1) proved defective and was therefore removed of the final analysis. 1 assay (CCND2-Hs00153380_m1) displayed poor quality amplification in 11 of the 67 samples analyzed and these data were discarded for the final analysis. 10 wells that showed abnormal amplification curves were also discarded. Cycle thresholds (Ct)
superior or equal to 40 were set to 40. Eleven samples run in two separate experiments showed a high reproducibility of the raw Ct values and were used to optimize normalization to the 6 housekeeping genes (see supplementary information). The remaining 56 samples were run in one experiment. For each cDNA, the level of expression of each gene (g) was calculated as Delta Ct = – [Ctg – (Ct18S + CtBRF2 + CtFBXO7 + CtMGC15396 + CtPGK1+ CtTBP) / 6],
and Delta Ct values were averaged for duplicates. Biostatistical analysis
All Analyses were performed with the R system software (v2.5) and Bioconductor(V2.0) (18, 19). Comparisons of groups for quantitative data were done by Student t-tests. Qualitative data were compared using the Chi-square test or the Fisher exact test when appropriate. We defined the distance by the correlation coefficient to perform hierarchical clustering with the Ward agglomeration algorithm.
Progression-Free Survival (PFS) was defined as the time interval between the first chemotherapy cycle and death during induction treatment, disease progression or relapse and excluded late deaths unrelated to lymphoma. Overall survival (OS) was calculated from the first chemotherapy cycle until death from any cause. Censored data were analysed by Cox regression to evaluate the prognostic significance of gene expression levels (20). In the screening set, Cox analyses on individual probesets adjusted on IPI score and treatment arm were performed to evaluate their prognostic value independently of these two factors. Interaction between gene expression levels and treatment arm were also tested to detect a differential effect between CHOP and R-CHOP patients. In the TLDA experiments, Cox analyses on Delta Ct Values adjusted on IPI score and stratified by the analysis set (screening and complementary) were also computed. Interaction between Delta Ct values and analysis set were also tested to detect a differential effect between the two sets. The hazard ratios (HR) were expressed with a 95% confidence interval and estimated the ratio of risk associated with a two fold increase in gene expression level (ie a differential expression of one unit in log2 or in delta Ct). A Cox model with L1 penalty function (lasso) and a path following algorithm was used to select the best gene combination among candidate genes
(21, 22). C index scores were computed to quantify the predictive ability of adjusted models to discriminate between subjects who failed and those who did not (23).
RESULTS
Search for transcripts associated with progression free survival in patients treated with R-CHOP
In order to search for correlations between the tumor transcriptional profile and clinical outcome in patients receiving chemotherapy associated with rituximab, we collected available frozen lymphoma samples from patients included in the GELA LNH98.5 study and from patients treated with the same regimen in GELA centers. RNA from 53 lymphomas were analyzed with Affymetrix HU133A microarrays and constituted a screening set of 30 CHOP and 23 R-CHOP samples. The median age (69 years), sex ratio (27M/26F) of this subset of patients were similar to those of the 399 ones included in the LNH98.5 trial (supplementary Table 1) (10). As reported for this trial, two parameters were strongly correlated with progression free survival (PFS) in these patients: a high International Prognostic Index (each +1 IPI increment, hazard ratio: 1.63 [1.14-1.24], p<0.01) and treatment regimen (CHOP versus R-CHOP, hazard ratio: 2.25 [1.07-4.78], p<0.05). We therefore used Cox models adjusted for IPI and treatment effects to screen this Affymetrix dataset in two different ways. First, we selected probesets that showed an association with PFS in all patients, with a low stringency p value ≤ 0.1, assuming that some genes might be of importance for patient’s outcome whether the patient receives or not rituximab. Secondly, we looked for probesets that showed an association with PFS that was significantly different (p<0.05) in CHOP and R-CHOP patients, assuming that some genes might gain or lose effects when patients receive rituximab (see supplementary information for the complete selection strategy). To evaluate the prognostic significance of the candidate genes, we designed a real-time PCR Taqman Low Density Array (TLDA) that comprised Taqman inventoried assays for the 30 genes which were associated with outcome in all patients, 31 genes which showed a differential effect according to treatment arm, 2 genes which showed
both effects, 26 additional genes discriminating GC and ABC signature or previously reported to be associated with outcome, and 6 housekeeping genes (supplementary Table 2). These arrays were used to analyse the transcriptional profile of the 23 R-CHOP samples of the screening set and of 44 complementary R-CHOP samples (supplementary Table 1).
Genes of which expression is associated with outcome in R-CHOP patients
Cox models were used to analyze the correlation between TLDA gene expression levels and progression free survival or overall survival. A large fraction of the 63 candidate genes showed a significant association with PFS (29 genes) and/or OS (25 genes) in the screening group (n=23), as expected from the selection procedure and the high correlation of Affymetrix microarray and TLDA data. Few genes showed a significant association with PFS (2 genes, VNN2 and APOBEC3G) and/or OS (3 genes, VNN2, LPP and LMO2) in the complementary set (n=44). Since some genes showed similar trends in both sets without reaching statistical significance, we analyzed the correlations in the whole R-CHOP group and used interaction tests to exclude the genes showing significantly different effects in the screening and complementary sets (see supplementary Table 3 for detailed results).
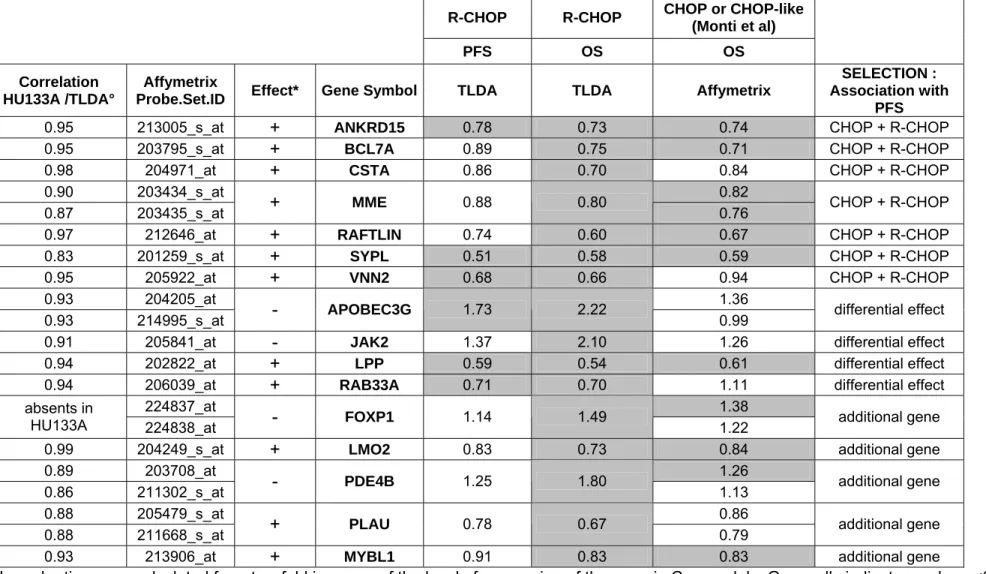
In these 67 patients, 16 transcripts showed a significant association with OS and 6 of these were also significantly associated with PFS (Table 1 and Figure 1). These associations were independent of the International Prognostic Index (data not shown). To further analyze the potential prognostic significance of these genes, we analyzed a completely independent set of data published by Monti et al (6), concerning a series of 129 patients treated by CHOP or CHOP-like regimen and observed a significant correlation with OS, with similar hazard ratios, for 9 of these 16 genes (Table 1). Quite interestingly, 5 out of the 7 genes selected because of their effect in all patients (ANKRD15, BCL7A, MME, RAFTLIN, SYPL), but only 1 of the 4 genes selected because of a differential effect in CHOP and R-CHOP treated patients (LPP), and 3 additional genes (LMO2, MYBL, FOXP1), showed a significant correlation with OS in this independent set. Altogether, these data suggest that some genes (ANKRD15, BCL7A, MME, RAFTLIN, SYPL, LMO2, MYBL, LPP, FOXP1) do have prognostic significance both in CHOP and R-CHOP treated patients whereas some genes
(APOBEC3G, JAK2, RAB33) may have prognostic significance only in patients receiving chemotherapy associated with rituximab.
Prognostic significance of cell of origin signature in R-CHOP patients
Wright et al established a predictor for Germinal Center (GC) and Activated B-Cell (ABC) classification of DLBCL lymphomas, based on the expression of 27 genes (24). Affymetrix HU133A probe sets matched unambiguously to 19 of these genes and were used to classify the samples of the screening set (data not shown). Nineteen assays corresponding to these genes were included in the TLDA. The IgHM Taqman assay proved defective and the expression of one gene (DDB1) showed little variation and did not affect the classification of the samples based on hierarchical clustering (data not shown). The expression of the remaining 17 genes divided the 67 R-CHOP DLBCL samples in 2 clusters: 25 with a GC transcriptional profile, and 42 with an ABC profile (Figure 2A). The GC group showed a significantly higher OS than the ABC group (Hazard ratio =0.18 [0.04-0.76], p=0.02) (Figure 2B), and a non significant trend for higher PFS (p=0.15) (Figure 2C). The COO distinction remained statistically significant in a multivariate Cox Model for overall survival that incorporated the international prognostic index (GC versus ABC profile, hazard ratio = 0.19 [0.04-0.83], p=0.03). Comparison of the OS and PFS curves suggested that after relapse or progression, patients with an ABC type DLBCL had a high probability to die (14 deaths out of 17 cases) whereas patients with a GC type DLBCL could respond to salvage therapy (2 deaths out of 5 cases). Indeed, the COO classification and relapse or progression proved to be a significant and independent risk factor for death in a time dependent Cox model (GC
versus ABC profile, hazard ratio = 0.24 [0.05-1], p= 0.05; relapse or progression, hazard ratio
=29 [9.2-91.7], p=10-8).
Selection of a multivariate model with high predictive efficiency
It was quite striking that 5 genes (LMO2, MME, MYBL1, BCL7A and FOXP1) showing significant association with outcome in the 67 R-CHOP patients, were known to belong to the set of genes discriminating GC and ABC DLBCL (4, 24, 25). Among the 11 other genes, 6 were significantly higher in GC-type DLBCL subgroup, and 3 were significantly higher in
ABC-type DLBCL subgroup (Table 2). In a multivariate Cox model adjusted for the COO effect, 2 of the 16 candidate genes (APOBEC3G and RAB33A) remained significantly associated with OS. We used a Cox with L1 penalty (lasso) model adjusted for the International Prognostic Index effect, to test the prognostic significance of the 16 candidate genes and selected a 7 variables model with the path algorithm (IPI + APOBEC3G, LMO2, MME, LPP, FOXP1 and RAB33A) (supplementary information). We computed C index values to evaluate the efficiency of these variables, as well as the COO classification and the International Prognostic Index, to differentiate fatal versus non-fatal disease (Table 3 and supplementary Figure). The results showed that 4 genes of the COO signature had a strong prognostic impact (LMO2, MME, LPP and FOXP1), recapitulating the prognostic significance associated with the COO classification, and that the expression of 2 other genes (APOBEC3G and RAB33A), selected because of their differential effect in R-CHOP, further influenced the outcome in this series of patients.
DISCUSSION
We analyzed the lymphoma transcriptional profile of patients with DLBCL treated with CHOP or R-CHOP in GELA clinical centers, in order to determine whether rituximab combined with chemotherapy affects prognostic biomarkers. We used a two-stage screening procedure, which identified 16 genes showing a significant association with OS in 67 R-CHOP treated patients. The results revealed that the COO classification remained a strong prognostic biomarker in this therapeutic setting. Moreover, we showed that a few genes of the COO (LMO2, LPP, MME and FOXP1) bear most of the prognostic significance of this classification and that 2 independent genes (APOBEC3G and RAB33A) could add significant prognostic information in these patients.
Overall, our data are in agreement with previous gene expression profiling studies. In a study that used RT-PCR to evaluate the expression levels of 36 genes in 66 patients, the only gene that showed a significant correlation with survival in univariate analysis was LMO2 (8), indicating that few genes can reach the level of statistical significance in limited series of
patients. Indeed, using different statistical approaches, Segal showed that gene expression data only delivers limited predictions of post-therapy DLBCL survival (26). In this context, the use of corrections for tests multiplicity would exclude all candidate genes, even those already known to bear prognostic value. Therefore, we chose to analyse jointly all the R-CHOP samples (27, 28) and checked the results consistency by testing interaction terms between the two subsets. Finally, a Cox model with L1 penalty was used to build the predictive IPI plus 6 genes model assessed in R-CHOP samples, and to control for the overfitting bias (supplementary information).
Our results show that the GC transcriptional signature retains prognostic significance in patients who received rituximab in addition to chemotherapy, whereas studies based on immunohistochemistry reported that BCL6 protein expression (16) or that the COO classification based on BCL6, CD10 and IRF4 protein expression (29), did not remain significant prognostic indicators in patients treated with immuno-chemotherapy (30). This discrepancy may be due to technical pitfalls associated with this technique (effect of fixative, optimal cut-off set up, low amount of tumor cells analyzed in tissue microarrays) (31) or to the fact that the immuno-histochemical markers used in these studies do not efficiently represent the transcriptional COO classification. In this regard, it is quite interesting to note that LMO2 protein expression, which is a marker of GC origin, was very recently shown to correlate with outcome both in CHOP and R-CHOP treated patients (32). On the other hand, it is clear that some but not all genes of the COO classification have a strong prognostic significance. In our study, the optimal prognostic model comprised 4 genes linked to the COO. Three of these genes (LMO2, MME, FOXP1) were previously reported to be prognostic biomarkers in DLBCL patients treated with chemotherapy, although with inconstant results for MME (8, 25, 32-36). The fourth gene (LPP) was not previously known to be associated with prognosis and its expression and function during B-cell differentiation are unknown. The LPP gene has been discovered as a fusion partner of the HMGA2 gene in lipomas (37). This gene was also involved in a t(3;11) translocation, fused to MLL gene, in a secondary myeloid acute leukaemia (38), and in an interstitial deletion of chromosome 3q,
fused to BCL6 gene, in a primary central nervous system lymphoma (39). It encodes a LIM-domain containing protein of the zyxin family, recently shown to be a co-activator for PEA3 Ets transcription factor in breast cancer cells (40). Although these single genes represent markers of a more global transcriptional signature, it is also possible that they recapitulate essential features of GC B-cell differentiation stage, or that their expression makes the cells highly responsive to therapy.
Two other genes (APOBEC3G, RAB33A) showed differential effects in CHOP and R-CHOP patients and demonstrated a significant correlation with OS in R-R-CHOP patients independently of the COO classification. APOBEC3G encodes a cytoplasmic cytidine deaminase (41) that exists in two forms: a low molecular mass, enzymaticaly active protein, which inhibits HIV infection, and a high molecular complex, devoid of enzymatic activity, that localizes to ribonucleoprotein complexes (42). APOBEC3G expression was shown to be regulated by mitogenic and cytokine activation and to depend on MAP kinases as well as JAK/STAT signalling, in lymphocytes, monocytes, macrophages and dendritic cells, with cell-type specific regulation patterns (43). The RAB33A gene is expressed in brain, lymphocytes and normal melanocytes and encodes a protein belonging to the small GTPase superfamily, which may be involved in vesicle transport (44). It is interesting to note that RAB33A was reported to be predominantly expressed in the CD8+ T-cells and downregulated in the peripheral blood lymphocytes of patients with tuberculosis (45), suggesting a possible link between a low RAB33A expression and a poor host immune response.
In this study, we identified a list of candidate genes which could be useful to predict outcome in patients with DLBCL treated with R-CHOP and showed that GC-type DLBCL have indeed a longer survival than ABC-type DLBCL in the context of immuno-chemotherapy. The validation of the prognostic significance of these candidate genes and the elucidation of their mechanism of action will require further studies.
Acknowledgments.
We are grateful to Fabien Petel (Ligue Nationale Contre le Cancer) for the management of the Affymetrix and annotation databases and their submission to Array Express. We thank E Jacquet, H Lévaique, E. Garrido (CNRS, Gif sur Yvette, France) and E Côme for the realisation of the TLDA experiments; A Allain and N Nio for their help in clinical data management. We are indebted to the pathologists and clinicians of the GELA who contributed pathological specimen and clinical data.
REFERENCES
1.
Harris NL, Jaffe ES, Diebold J, Flandrin G, Muller-Hermelink HK, Vardiman J, et al.
World Health Organization classification of neoplastic diseases of the hematopoietic
and lymphoid tissues: report of the Clinical Advisory Committee meeting-Airlie
House, Virginia, November 1997. J Clin Oncol 1999 Dec; 17(12): 3835-3849.
2.
A predictive model for aggressive non-Hodgkin's lymphoma. The International
Non-Hodgkin's Lymphoma Prognostic Factors Project. The New England journal of
medicine 1993 Sep 30; 329(14): 987-994.
3.
Lossos IS. Molecular pathogenesis of diffuse large B-cell lymphoma. J Clin Oncol
2005 Sep 10; 23(26): 6351-6357.
4.
Alizadeh AA, Eisen MB, Davis RE, Ma C, Lossos IS, Rosenwald A, et al. Distinct
types of diffuse large B-cell lymphoma identified by gene expression profiling. Nature
2000 Feb 3; 403(6769): 503-511.
5.
Rosenwald A, Wright G, Chan WC, Connors JM, Campo E, Fisher RI, et al. The use
of molecular profiling to predict survival after chemotherapy for diffuse large-B-cell
lymphoma. The New England journal of medicine 2002 Jun 20; 346(25): 1937-1947.
6.
Monti S, Savage KJ, Kutok JL, Feuerhake F, Kurtin P, Mihm M, et al. Molecular
profiling of diffuse large B-cell lymphoma identifies robust subtypes including one
characterized by host inflammatory response. Blood 2005 Mar 1; 105(5): 1851-1861.
7.
Shipp MA, Ross KN, Tamayo P, Weng AP, Kutok JL, Aguiar RC, et al. Diffuse large
B-cell lymphoma outcome prediction by gene-expression profiling and supervised
machine learning. Nature medicine 2002 Jan; 8(1): 68-74.
8.
Lossos IS, Czerwinski DK, Alizadeh AA, Wechser MA, Tibshirani R, Botstein D, et
al. Prediction of survival in diffuse large-B-cell lymphoma based on the expression of
six genes. The New England journal of medicine 2004 Apr 29; 350(18): 1828-1837.
9.
Coiffier B, Lepage E, Briere J, Herbrecht R, Tilly H, Bouabdallah R, et al. CHOP
chemotherapy plus rituximab compared with CHOP alone in elderly patients with
diffuse large-B-cell lymphoma. The New England journal of medicine 2002 Jan 24;
346(4): 235-242.
10.
Feugier P, Van Hoof A, Sebban C, Solal-Celigny P, Bouabdallah R, Ferme C, et al.
Long-term results of the R-CHOP study in the treatment of elderly patients with
diffuse large B-cell lymphoma: a study by the Groupe d'Etude des Lymphomes de
l'Adulte. J Clin Oncol 2005 Jun 20; 23(18): 4117-4126.
11.
Coiffier B. State-of-the-art therapeutics: diffuse large B-cell lymphoma. J Clin Oncol
2005 Sep 10; 23(26): 6387-6393.
12.
Smith MR. Rituximab (monoclonal anti-CD20 antibody): mechanisms of action and
resistance. Oncogene 2003 Oct 20; 22(47): 7359-7368.
13.
Cartron G, Watier H, Golay J, Solal-Celigny P. From the bench to the bedside: ways
to improve rituximab efficacy. Blood 2004 Nov 1; 104(9): 2635-2642.
14.
Friedberg JW. Unique toxicities and resistance mechanisms associated with
monoclonal antibody therapy. Hematology / the Education Program of the American
Society of Hematology American Society of Hematology 2005: 329-334.
15.
Mounier N, Briere J, Gisselbrecht C, Emile JF, Lederlin P, Sebban C, et al. Rituximab
plus CHOP (R-CHOP) overcomes bcl-2--associated resistance to chemotherapy in
elderly patients with diffuse large B-cell lymphoma (DLBCL). Blood 2003 Jun 1;
101(11): 4279-4284.
16.
Winter JN, Weller EA, Horning SJ, Krajewska M, Variakojis D, Habermann TM, et
al. Prognostic significance of Bcl-6 protein expression in DLBCL treated with CHOP
or R-CHOP: a prospective correlative study. Blood 2006 Jun 1; 107(11): 4207-4213.
17.
Irizarry RA, Hobbs B, Collin F, Beazer-Barclay YD, Antonellis KJ, Scherf U, et al.
Exploration, normalization, and summaries of high density oligonucleotide array
probe level data. Biostatistics (Oxford, England) 2003 Apr; 4(2): 249-264.
18.
Gentleman RC, Carey VJ, Bates DM, Bolstad B, Dettling M, Dudoit S, et al.
Bioconductor: open software development for computational biology and
bioinformatics. Genome Biol 2004; 5(10): R80.
19.
R Development Core Team. R: A Language and Environment for Statistical
Computing. Vienna, Austria: R Foundation for Statistical Computing; 2007.
20.
Kalbfleisch JD, Prentice RL. The statistical analysis of failure time data, second edn.
Jonn Wiley & Sons, Inc: Hoboken, New Jersey, 2002.
21.
Tibshirani R. Regression Shrinkage and Selection via the Lasso. J R Statist Soc B
1996; 58(1): 267-288.
22.
Park MY, Hastie T. L1-regularization path algorithm for generalized linear models. J
R Statist Soc B 2007; 69(4): 659-677.
23.
Harrell FE, Jr., Lee KL, Mark DB. Multivariable prognostic models: issues in
developing models, evaluating assumptions and adequacy, and measuring and
reducing errors. Stat Med 1996 Feb 28; 15(4): 361-387.
24.
Wright G, Tan B, Rosenwald A, Hurt EH, Wiestner A, Staudt LM. A gene
expression-based method to diagnose clinically distinct subgroups of diffuse large B cell
lymphoma. Proceedings of the National Academy of Sciences of the United States of
America 2003 Aug 19; 100(17): 9991-9996.
25.
Barrans SL, Fenton JA, Banham A, Owen RG, Jack AS. Strong expression of FOXP1
identifies a distinct subset of diffuse large B-cell lymphoma (DLBCL) patients with
poor outcome. Blood 2004 Nov 1; 104(9): 2933-2935.
26.
Segal MR. Microarray gene expression data with linked survival phenotypes: diffuse
large-B-cell lymphoma revisited. Biostatistics (Oxford, England) 2006 Apr; 7(2):
268-285.
27.
Skol AD, Scott LJ, Abecasis GR, Boehnke M. Joint analysis is more efficient than
replication-based analysis for two-stage genome-wide association studies. Nature
genetics 2006 Feb; 38(2): 209-213.
28.
Zehetmayer S, Bauer P, Posch M. Two-stage designs for experiments with a large
number of hypotheses. Bioinformatics 2005 Oct 1; 21(19): 3771-3777.
29.
Hans CP, Weisenburger DD, Greiner TC, Gascoyne RD, Delabie J, Ott G, et al.
Confirmation of the molecular classification of diffuse large B-cell lymphoma by
immunohistochemistry using a tissue microarray. Blood 2004 Jan 1; 103(1): 275-282.
30.
Nyman H, Adde M, Karjalainen-Lindsberg ML, Taskinen M, Berglund M, Amini
RM, et al. Prognostic impact of immunohistochemically defined germinal center
phenotype in diffuse large B-cell lymphoma patients treated with
immunochemotherapy. Blood 2007 Jun 1; 109(11): 4930-4935.
31.
de Jong D, Rosenwald A, Chhanabhai M, Gaulard P, Klapper W, Lee A, et al.
Immunohistochemical prognostic markers in diffuse large B-cell lymphoma:
validation of tissue microarray as a prerequisite for broad clinical applications--a study
from the Lunenburg Lymphoma Biomarker Consortium. J Clin Oncol 2007 Mar 1;
25(7): 805-812.
32.
Natkunam Y, Farinha P, Hsi ED, Hans CP, Tibshirani R, Sehn LH, et al. LMO2
protein expression predicts survival in patients with diffuse large B-cell lymphoma
treated with anthracycline-based chemotherapy with and without rituximab. J Clin
Oncol 2008 Jan 20; 26(3): 447-454.
33.
Banham AH, Connors JM, Brown PJ, Cordell JL, Ott G, Sreenivasan G, et al.
Expression of the FOXP1 transcription factor is strongly associated with inferior
survival in patients with diffuse large B-cell lymphoma. Clin Cancer Res 2005 Feb 1;
11(3): 1065-1072.
34.
Chang CC, McClintock S, Cleveland RP, Trzpuc T, Vesole DH, Logan B, et al.
Immunohistochemical expression patterns of germinal center and activation B-cell
markers correlate with prognosis in diffuse large B-cell lymphoma. The American
35.
Fabiani B, Delmer A, Lepage E, Guettier C, Petrella T, Briere J, et al. CD10
expression in diffuse large B-cell lymphomas does not influence survival. Virchows
Arch 2004 Dec; 445(6): 545-551.
36.
van Imhoff GW, Boerma EJ, van der Holt B, Schuuring E, Verdonck LF,
Kluin-Nelemans HC, et al. Prognostic impact of germinal center-associated proteins and
chromosomal breakpoints in poor-risk diffuse large B-cell lymphoma. J Clin Oncol
2006 Sep 1; 24(25): 4135-4142.
37.
Petit MM, Mols R, Schoenmakers EF, Mandahl N, Van de Ven WJ. LPP, the
preferred fusion partner gene of HMGIC in lipomas, is a novel member of the LIM
protein gene family. Genomics 1996 Aug 15; 36(1): 118-129.
38.
Daheron L, Veinstein A, Brizard F, Drabkin H, Lacotte L, Guilhot F, et al. Human
LPP gene is fused to MLL in a secondary acute leukemia with a t(3;11) (q28;q23).
Genes, chromosomes & cancer 2001 Aug; 31(4): 382-389.
39.
Schwindt H, Akasaka T, Zuhlke-Jenisch R, Hans V, Schaller C, Klapper W, et al.
Chromosomal translocations fusing the BCL6 gene to different partner loci are
recurrent in primary central nervous system lymphoma and may be associated with
aberrant somatic hypermutation or defective class switch recombination. Journal of
neuropathology and experimental neurology 2006 Aug; 65(8): 776-782.
40.
Guo B, Sallis RE, Greenall A, Petit MM, Jansen E, Young L, et al. The LIM domain
protein LPP is a coactivator for the ETS domain transcription factor PEA3. Molecular
and cellular biology 2006 Jun; 26(12): 4529-4538.
41.
Takaori-Kondo A. APOBEC family proteins: novel antiviral innate immunity.
International journal of hematology 2006 Apr; 83(3): 213-216.
42.
Gallois-Montbrun S, Kramer B, Swanson CM, Byers H, Lynham S, Ward M, et al.
Antiviral protein APOBEC3G localizes to ribonucleoprotein complexes found in P
bodies and stress granules. Journal of virology 2007 Mar; 81(5): 2165-2178.
43.
Stopak KS, Chiu YL, Kropp J, Grant RM, Greene WC. Distinct patterns of cytokine
regulation of APOBEC3G expression and activity in primary lymphocytes,
macrophages, and dendritic cells. The Journal of biological chemistry 2007 Feb 9;
282(6): 3539-3546.
44.
Cheng E, Trombetta SE, Kovacs D, Beech RD, Ariyan S, Reyes-Mugica M, et al.
Rab33A: characterization, expression, and suppression by epigenetic modification.
The Journal of investigative dermatology 2006 Oct; 126(10): 2257-2271.
45.
Jacobsen M, Repsilber D, Gutschmidt A, Neher A, Feldmann K, Mollenkopf HJ, et al.
Ras-associated small GTPase 33A, a novel T cell factor, is down-regulated in patients
with tuberculosis. The Journal of infectious diseases 2005 Oct 1; 192(7): 1211-1218.
Table 1. Hazard ratio for survival in 67 R-CHOP patients
R-CHOP R-CHOP CHOP or CHOP-like (Monti et al) PFS OS OS Correlation HU133A /TLDA° Affymetrix
Probe.Set.ID Effect* Gene Symbol TLDA TLDA Affymetrix
SELECTION : Association with
PFS
0.95 213005_s_at
+
ANKRD15 0.78 0.73 0.74 CHOP + R-CHOP0.95 203795_s_at
+
BCL7A 0.89 0.75 0.71 CHOP + R-CHOP0.98 204971_at
+
CSTA 0.86 0.70 0.84 CHOP + R-CHOP0.90 203434_s_at 0.82
0.87 203435_s_at
+
MME 0.88 0.80 0.76 CHOP + R-CHOP0.97 212646_at
+
RAFTLIN 0.74 0.60 0.67 CHOP + R-CHOP0.83 201259_s_at
+
SYPL 0.51 0.58 0.59 CHOP + R-CHOP0.95 205922_at
+
VNN2 0.68 0.66 0.94 CHOP + R-CHOP0.93 204205_at 1.36
0.93 214995_s_at
-
APOBEC3G 1.73 2.22 0.99 differential effect0.91 205841_at
-
JAK2 1.37 2.10 1.26 differential effect0.94 202822_at
+
LPP 0.59 0.54 0.61 differential effect0.94 206039_at
+
RAB33A 0.71 0.70 1.11 differential effect224837_at 1.38
absents in
HU133A 224838_at
-
FOXP1 1.14 1.49 1.22 additional gene0.99 204249_s_at
+
LMO2 0.83 0.73 0.84 additional gene0.89 203708_at 1.26
0.86 211302_s_at
-
PDE4B 1.25 1.80 1.13 additional gene0.88 205479_s_at 0.86
0.88 211668_s_at
+
PLAU 0.78 0.67 0.79 additional gene0.93 213906_at
+
MYBL1 0.91 0.83 0.83 additional geneHazard ratios were calculated for a two fold increase of the level of expression of the gene in Cox models. Grey cells indicate p values <0.05. °: The correlation was calculated for the 23 samples of the screening set. *: + indicates that a higher expression is associated with a better outcome, - indicates that a higher expression is associated with a worse outcome.
Table 2. Differential expression of the 16 candidate genes according to the COO classification
Gene
symbol Fold-change GC/ABC 95% CI p-value MME 23.64 (12.23-45.69) p<10-13 MYBL1 11.06 (6.21-19.71) p<10-11 ANKRD15 4.29 (2.68-6.88) p<10-7 LMO2 3.32 (1.83-6.04) p<10-3 BCL7A 2.45 (1.44-4.17) p<10-2 CSTA 2.25 (1.27-3.98) p<10-2 LPP 1.80 (1.29-2.51) p<10-3 RAFTLIN 1.68 (1.19-2.38) p<10-2 VNN2 1.67 (1.12-2.50) p=0.01 SYPL 1.65 (1.21-2.23) p<10-2 Overexpressed in GC PLAU 1.32 (0.91-1.90) NS Fold-change ABC/GC 95% CI p-value FOXP1 2.70 (1.86-3.90) p<10-5 PDE4B 1.77 (1.37-2.28) p<10-4 JAK2 1.58 (1.19-2.08) p<10-2 APOBEC3G 1.39 (1.03-1.87) p=0.03 Overexpressed in ABC RAB33A 1.36 (0.83-2.23) NS
This Table indicates the relative expression of the genes in the GC and ABC subgroups defined by hierarchical clustering. The statistical difference between the two groups was assessed with Student t-tests. It is important to note that MME, MYBL1, LMO2 were used to classify the samples, and were thereby expected to show a strong correlation with the COO classification. PLAU and RAB33 gene expression levels were not significantly correlated with the COO classification.
Table 3. Evaluation of the predictive power of candidate models by the C index criterion
Variables C index value (SD)
- IPI - COO - IPI + COO
- APOBEC3G + RAB33A
- IPI + COO + APOBEC3G + RAB33A - LMO2 + MME + FOXP1 + LPP
- LMO2 + MME + LPP + FOXP1 + APOBEC3G + RAB33A - IPI + LMO2 + MME + LPP + FOXP1 + APOBEC3G + RAB33A 0.62 (0.11) 0.63 (0.09) 0.70 (0.12) 0.69 (0.12) 0.77 (0.11) 0.76 (0.09) 0.82 (0.08) 0.84 (0.08)
A model 100% efficient to discriminate fatal versus non-fatal disease would have a C index value of 1. A model with no discrimination power would have a C index value of 0.5.
TITLES AND LEGENDS TO FIGURES
Figure 1. OS and PFS according to LPP or APOBEC3G gene expression in 67 patients treated with R-CHOP.
A. OS according to LPP gene expression B. PFS according to LPP gene expression
C. OS according to APOBEC3G gene expression D. PFS according to APOBEC3G gene expression
Dashed lines indicate patients with gene expression lower than median expression. Plain lines indicate patients with higher than or equal to median gene expression.
Figure 2. PFS and OS according to the COO classification.
A. Hierarchical clustering of the 67 R-CHOP samples according to the expression of 17 genes included in Wright’s predictor. The expression level of each gene corresponds to the Delta Ct centered on the mean gene Delta Ct value, and is depicted according to the colour scale shown at the bottom of the heatmap. Yellow boxes indicate samples of the screening set, and orange boxes, samples from the additional set.
B. OS according to the COO classification of the samples by hierarchical clustering C. PFS according to the COO classification of the samples by hierarchical clustering
Dashed lines indicate patients with an ABC profile. Plain lines indicate patients with a GCB profile.