DOI 10.1007/s00401-014-1260-8 OrIgINAl PAPer
Oligodendroglia in cortical multiple sclerosis lesions decrease
with disease progression, but regenerate after repeated
experimental demyelination
Enrique Garea Rodriguez · Christiane Wegner · Mario Kreutzfeldt · Katharina Neid · Dietmar R. Thal · Tanja Jürgens · Wolfgang Brück · Christine Stadelmann · Doron Merkler
received: 12 October 2013 / revised: 6 February 2014 / Accepted: 10 February 2014 / Published online: 25 February 2014 © The Author(s) 2014. This article is published with open access at Springerlink.com
induction of SCD in rats resulted only in a transient loss of NogoA+, but not Olig2+ cells during the
demyeli-nation phase. This phase was followed by complete oligo-dendroglial repopulation and remyelination, even after four episodes of demyelination. Our data indicate efficient oli-godendroglial repopulation in subpial cortical lesions in rats after repeated SCD that was similar to early, but not chronic MS cases. Accordingly, four cycles of experimental de- and remyelination were not sufficient to induce sustained remy-elination failure as found in chronic cortical MS lesions. This suggests that alternative mechanisms contribute to oligoden-drocyte depletion in chronic cortical demyelination in MS. Keywords Multiple sclerosis · Cortical demyelination · Oligodendrocytes · Oligodendrocyte precursors · Targeted cortical eAe
Introduction
Multiple sclerosis (MS) is characterized by multifocal inflammatory demyelinating lesions in white and gray Abstract Cerebral cortex shows a high endogenous
pro-pensity for remyelination. Yet, widespread subpial cortical demyelination (SCD) is a common feature in progressive multiple sclerosis (MS) and can already be found in early MS. In the present study, we compared oligodendroglial loss in SCD in early and chronic MS. Furthermore, we addressed in an experimental model whether repeated episodes of inflammatory SCD could alter oligodendroglial repopulation and subsequently lead to persistently demyelinated cortical lesions. NogoA+ mature oligodendrocytes and Olig2+
oligo-dendrocyte precursor cells were examined in SCD in patients with early and chronic MS, normal-appearing MS cortex, and control cortex as well as in the rat model of repeated tar-geted cortical experimental autoimmune encephalomyelitis (eAe). NogoA+ and Olig2+ cells were significantly reduced
in SCD in patients with chronic, but not early MS. repeated
D. Merkler and C. Stadelmann share co-senior authorship. e. g. rodriguez and C. Wegner contributed equally to this work. Electronic supplementary material The online version of this article (doi:10.1007/s00401-014-1260-8) contains supplementary material, which is available to authorized users.
e. g. rodriguez · C. Wegner · K. Neid · W. Brück · C. Stadelmann (*) · D. Merkler
Institute of Neuropathology, University Medical Center göttingen, robert-Koch-Str. 40,
37099 göttingen, germany
e-mail: [email protected] D. Merkler (*)
Division of Clinical Pathology, geneva University Hospital, Centre Médical Universitaire, 1, rue Michel Servet, 1211 geneva, Switzerland
e-mail: [email protected]
M. Kreutzfeldt · T. Jürgens · D. Merkler
Department of Pathology and Immunology, geneva University, geneva, Switzerland
D. r. Thal
Institute of Pathology/laboratory for Neuropathology, University of Ulm, Ulm, germany
Present Address: e. g. rodriguez
Department of Neuroanatomy, Institute of Anatomy and Cell Biology, University of Freiburg, Freiburg, germany
matter of the central nervous system (CNS) [31]. Neocorti-cal demyelination in particular is a frequent phenomenon found in 90 % of patients with chronic MS [30, 50], but can already be present in patients with early MS [34]. Despite early description of neocortical lesions in MS [6], these lesions have mostly been overlooked until recently since they are difficult to detect with traditional staining tech-niques [41] or conventional magnetic resonance imaging (MrI) [17, 27]. The use of new MrI sequences has shown that cortical lesions in MS are more common than previ-ously thought [8, 17, 26] and are supposed to contribute to cognitive impairment [7, 44] and epilepsy [9] in MS. Therefore, cortical involvement may represent an important pathophysiological substrate for disease manifestation, pro-gression and therapy in MS [12, 18, 30].
On average, between 10 and 25 % of cortical gray mat-ter (gM) is demyelinated in patients with chronic MS, but individual patients may even reach values of over 70 % [5,
19, 30]. During the progressive stage of the disease, the extent of gM demyelination can even exceed that of white matter (WM) demyelination [19, 30]. Histopathologically, three main types of cortical lesions have been described according to their topographic distribution within the cere-bral cortex: leukocortical (type I) lesions extending through WM and gM, purely intracortical (type II) lesions and subpial (type III) lesions [41]. Subpial cortical demyelina-tion (SCD), the most frequent lesion type in chronic MS, accounts for the majority of demyelinated cortex and seems to occur independent of WM demyelination [3, 30]. Com-pared to WM lesions, cortical demyelination presents with less lymphocyte infiltration and reduced microglia activa-tion [4, 41, 48]. However, the extent of meningeal inflam-mation was shown to correlate with the extent of cortical demyelination and rate of progression in patients with sec-ondary progressive MS [24, 35, 36]. Similarly, meningeal and intracortical infiltrates were topographically associated with cortical lesions in early-stage MS, which supports the concept that inflammatory processes underlie cortical demyelination [34].
Despite the observation that gM lesions have a higher remyelination propensity than WM lesions [2, 12], chronic cortical demyelinated lesions accumulate over time and are most widespread in progressive MS [30]. It has been postu-lated that the depletion of oligodendrocyte precursor cells (OPCs) [10] and oligodendroglial differentiation block [15,
29] could account for remyelination failure in WM lesions. Previous experimental studies furthermore suggested that repeated rounds of de- and remyelination lead to less effi-cient remyelination in WM [25].
In the present study, we analyzed cortical oligodendro-cytes (Ols) and OPCs in early- and late-stage MS. Our findings reveal that both mature Ols and their precursors are significantly reduced in demyelinated cerebral cortex in
late-stage, but not in early MS. To address whether repeated cycles of cortical de- and remyelination could account for the depletion of Ols and lack of remyelination, we used a rat model of targeted cortical experimental autoimmune encephalomyelitis (eAe) which recreates key histopatho-logical features of cortical MS lesions [38]. Here, we induced up to four consecutive cortical eAe lesions within the same cortical area and investigated the impact on repop-ulation of Ols and remyelination. We found that the dif-ferentiation of OPCs into mature Ols was not sustainably impaired even after repeated cortical de- and remyelination. Our study thus suggests that cortical remyelination failure in MS is not necessarily due to repeated waves of de- and remyelination. Further studies are required to unravel the mechanisms underlying cortical remyelination failure in progressive MS.
Materials and methods Clinical data and human tissue
Brain samples were fixed in 4 % formaldehyde and par-affin embedded. Blocks consisted of five autopsy cases with chronic MS [mean age 54.2 (range 41–66) years; mean disease duration 16.8 (range 10–25) years] as well as four biopsy cases with early MS [mean age 36.8 (range 26–45) years; mean disease duration 3.3 (range 2–6) months]. Tissue blocks from age- and sex-matched control autopsy cases without neurological disease [n = 10; 5 males, 5 females; mean age 50.3 (range 35– 75) years] served as controls. For the detection of SCD, paraffin sections were immunostained for myelin basic protein (MBP). Clinical data are summarized in Table 1
(autopsy cases) and Table 2 (biopsy cases). All MS autopsy cases showed a progressive disease course with disease durations of at least 10 years, whereas biopsy cases suffered from early MS. Based on the number of relapses, biopsy cases were either classified as clinically isolated syndrome (CIS) (n = 3) or relapsing–remitting MS (n = 1) as indicated in Table 2. Biopsies were per-formed for diagnostic purposes to exclude neoplastic or
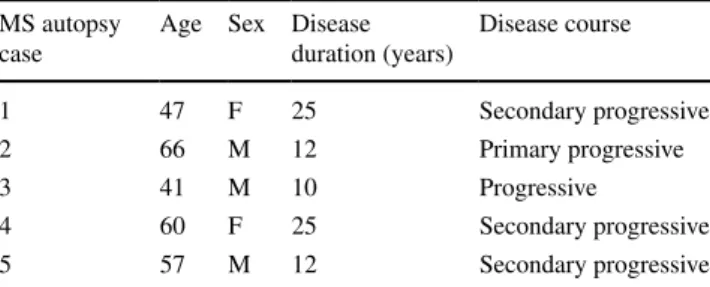
Table 1 Clinical findings of MS autopsy cases MS autopsy
case
Age Sex Disease duration (years) Disease course 1 47 F 25 Secondary progressive 2 66 M 12 Primary progressive 3 41 M 10 Progressive 4 60 F 25 Secondary progressive 5 57 M 12 Secondary progressive
infectious diseases. The study was approved by the ethics committee of the University Medical Center göttingen (WF-004/11).
Histology and immunohistochemistry on human tissue Bielschowsky silver staining and immunohistochemistry were carried out according to standard procedures. The following primary antibodies were used: rabbit anti-MBP (1:1,000, Dako, Denmark), mouse anti-MBP peptide70–89
(SMI94; 1:3,000, Covance, Princeton, New Jersey, USA), mouse anti-KiM1P (1:5,000) [43], rabbit anti-Olig2 (1:100, IBl, Spring lake Park, Minnesota, USA), mouse anti-NogoA (1:10,000, mAb 11C7, a generous gift from M.e. Schwab, Brain research Institute, eTH and University of Zurich, Switzerland) and mouse anti-Ki67 (1:50, clone Mib-1, Dako, Denmark). To identify Olig2+ or NogoA+
cells in control non-MS, normal-appearing MS and demy-elinated MS neocortex, we performed double-immuno-labeling combining either rabbit anti-Olig2 with mouse anti-MBP70–89 (SMI94) or mouse anti-NogoA with rabbit anti-MBP.
Double-labeling immunohistochemistry was performed combining DAB (first primary antibody) and Fast Blue (second primary antibody with APAAP; Dako). For fluores-cence double-labeling, Cy3- or Cy2-conjugated goat anti-mouse Igg and goat anti-rabbit Igg (both from Jackson Immunoresearch europe ltd.) were used.
Morphometry and statistics on human tissue
The density of KiM1P+, NogoA+ and Olig2 strongly
positive (Olig2+) cells was determined as ≥20,000 μm2.
KiM1P+ mononuclear cells of both macrophage and
microglia phenotype were counted in SCD in layers I/II and in layer III and given as cells/mm2. The mean
num-ber of Olig2+ and NogoA+ cells was quantified in layers
I/II and in layer III in control non-MS neocortex, normal-appearing MS neocortex (NAgM) as well as chronic and early SCD.
The density of axons (layer III) was assessed on Biels-chowsky silver-stained sections (1000×) in control non-MS neocortex, non-MS NAgM as well as chronic SCD within at least four visual fields using a 10 × 10 counting grid. Axonal density was given in percent of control non-MS neocortex as a reference (set to 100 %).
Animals and groups
A total number of 101 adult female lewis rats (195 g ± 15, Harlan, Horst, Netherlands) were included in this study. The animals were kept in groups (maximum 8 animals per cage) on a 12:12 h light/dark cycle with food and water
Table
2
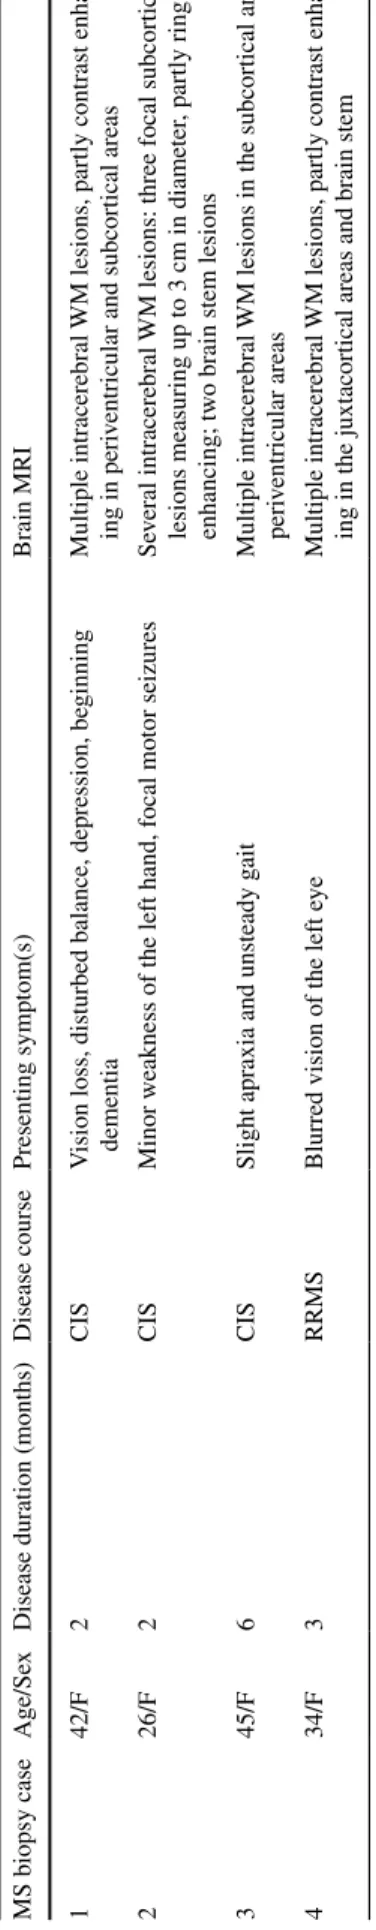
Clinical findings of MS biopsy cases
Based on the number of relapses,
biopsy cases were either classified as clinically isolated syndrome (CIS)
(patients 1–3) or relapsing–remitting MS ( rr MS) (patient 4) as indicated. CIS
patients underwent biopsy after the first relapse, whereas the patient with
rr
MS w
as biopsied after the second relapse
MS biopsy case
Age/Se
x
Disease duration (months)
Disease course Presenting symptom(s) Brain M r I 1 42/F 2 CIS V
ision loss, disturbed balance, depression, be
ginning
dementia
Multiple intracerebral
WM lesions, partly contrast enhanc
-ing in peri
ventricular and subcortical areas
2
26/F
2
CIS
Minor weakness of the left hand, focal motor seizures
Se
veral intracerebral
WM lesions: three focal subcortical
lesions measuring up to 3
cm in diameter
, partly ring
enhancing; tw
o brain stem lesions
3
45/F
6
CIS
Slight apraxia and unsteady g
ait
Multiple intracerebral
WM lesions in the subcortical and
peri ventricular areas 4 34/F 3 rr MS
Blurred vision of the left e
ye
Multiple intracerebral
WM lesions, partly contrast enhanc
provided ad libitum. All experiments were approved by the Bezirksregierung Braunschweig, germany.
Sensitization procedure
recombinant rat myelin oligodendrocyte glycoprotein (rMOg) was produced as described previously [1]. For subclinical immunization, anaesthetized rats (n = 68) were injected subcutaneously (s.c.) with rMOg (50 μg) emulsi-fied in incomplete Freund’s adjuvant (IFA; Sigma-Aldrich Chemie gmbH, Steinheim, germany) as described previ-ously [38]. For control experiments, rats (n = 27) were injected s.c. with PBS emulsified in IFA. A subset of ani-mals (n = 6) received no injection (naive controls). Intracerebral stereotactic injection
Stereotactic injections were performed according to a modified protocol as described previously [38]. Briefly, anaesthetized IFA- or rMOg-sensitized rats received a first stereotactic injection into the cortex (1 mm caudal to the bregma, 2 mm lateral to the sagittal suture, 1.7 mm depth) 19–21 days after immunization. 1 μl of a cytokine mixture [250 ng of recombinant rat tumor necrosis factor-α (TNF-α; r&D Systems, Abingdon, UK; 150 U of recombinant rat interferon-γ (IFN-γ; PeproTech, london, UK)] dissolved in PBS was injected together with a trace of Monastral blue (Fluka, germany). Stereotactic cytokine injection at the same anatomical location was repeated up to four times at intervals of 21 days.
5-Bromo-2-deoxyuridine (BrdU) injection
BrdU labeling was performed in a subset of IFA- or rMOg-sensitized animals (n = 6 per group). Animals were injected twice daily intraperitoneally with 1.5 ml 0.9 % NaCl solution containing 100 mg/kg bodyweight BrdU (Sigma) for 5 days starting on day 2 after cytokine injec-tion. At 21 days after cytokine injection, the animals were killed for histology.
Histopathology and immunohistochemistry of rat tissue Animals were anaesthetized by injecting an overdose of 14 % chloral hydrate (Merck). After transcardial perfu-sion with 4 % paraformaldehyde, brains were dissected and paraffin embedded. Serial brain sections (2 μm) were col-lected from the injection site. Immunohistochemistry was performed as described above. Additional antibodies used were: mouse anti-proteolipid protein (PlP, clone Plpc1, 1:2,500, Biozol), mouse anti-BrdU (1:400 in 10 % FCS, Chemicon) and mouse anti-eD1 (activated macrophages/ microglia, 1:1,000, Serotec).
Morphometric analysis of focal cortical eAe lesions Images were captured using light and fluorescence micro-scopes equipped with a digital camera (Color View II and DP71, Olympus, germany). NogoA+ and Olig2+ cell
pop-ulations were determined on NogoA/MBP and Olig2/MBP double-stained sections. The density of both cell popula-tions was assessed in cortical layers I and II (400×) using a 10 × 10 counting grid and expressed as cells per mm2.
The size of the demyelinated area was quantified on MBP-immunostained sections using Analysis® software
(Analy-sis, Soft Imaging System, germany).
Axonal density was quantified on Bielschowsky silver-impregnated sections as described above and given in percent of untreated controls. The fraction of myelinated axons was determined in cortical layer III within four vis-ual fields (1000×) using a counting grid (10 × 10 squares). The numbers of MBP+ myelin sheaths and
Bielschowsky-impregnated axons intersecting with the crosses of the counting grid were determined. The ratio of MBP+
fib-ers and Bielschowsky-impregnated axons was calculated (expressed in % of axons).
To quantify proliferated OPCs, Olig2 and BrdU double-positive cells were assessed on fluorescence images (200×) of cortical layers I/II (3 optical fields per animal). The quantification applied a custom-made script based on Cog-nition Network language (Definiens CogCog-nition Network Technology; Definiens Developer XD software) and resem-bled previously described scripts [28, 37]. Briefly, cells showing (a) an overlapping signal in the BrdU and Olig2 channel and (b) a signal for DAPI staining (nuclei) were counted and expressed as cells per mm2.
Statistical analysis
Statistical analysis was performed using SPSS (Version 12, SPSS Inc., Chicago, Il, USA) or graphPad Prism (graph-Pad Prism Software, Ink, San Diego, California, USA). Nor-mality of distribution was tested by Kolmogorov–Smirnov tests. Statistical calculations included one-way analysis of variance (ANOVA) if three or more groups were compared, followed by post hoc least significance difference (lSD) test as indicated in the figure legends. For comparisons between two groups, unpaired t tests were performed.
The subanalysis within MS autopsy cases used paired t tests to compare the cell and axonal densities in demyeli-nated MS neocortical layers versus adjacent MS NAgM. To test for altered cell densities in SCD between chronic (autopsies) and early (biopsies) MS cases, Mann–Whit-ney tests were performed. A probability value of less than 0.05 was considered significant. All data are expressed as mean ± standard error of the mean (SeM) and shown in graphs as mean + SeM.
Results
Subpial cortical demyelination in early and chronic MS SCD is prominent in most patients with chronic MS [30], but can already be present in early MS [34]. We detected SCD affecting layers I–III in all selected MS biopsy (n = 4; Fig. 1a) and autopsy (n = 5, Fig. 1b) cases. In addition, all MS autopsy cases also showed adjacent normal-appearing myelinated cortical layers I–III (Fig. 1b). In contrast, most tissue blocks from the investigated MS biopsy cases exhib-ited only demyelinated layers I–III, thereby restricting the analysis of biopsies to demyelinated areas only. All control cases displayed intact neocortical myelin.
Subpial cortical lesions were classified as inac-tive demyelinated lesions in all MS autopsy (n = 5) and biopsy (n = 4) cases based on the absence of myelin-laden
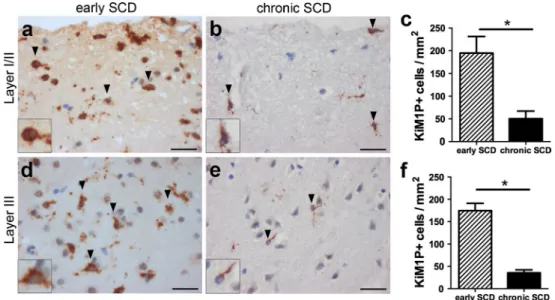
phagocytes. Since the short disease duration in biopsy cases ranged from 2 to 6 months, we investigated whether these early (biopsy) cases displayed increased mac-rophage and microglia infiltration in SCD compared to late (autopsy) cases. The quantitative analysis in demyelinated cortical layers I/II showed significantly higher densities of KiM1P+ cells in early biopsy cases (194.8 ± 36.6 cells/
mm2) (Fig. 2a) compared to late autopsy cases with MS
(50.4 ± 16.9 cells/mm2; p < 0.05) (Fig. 2b, c). Similarly,
the densities of KiM1P+ cells in demyelinated cortical layer
III were also significantly increased in early MS (biopsy) (174.6 ± 16.4 cells/mm2) (Fig. 2d) compared to late MS
(autopsy) (35.6 ± 6.7 cells/mm2; p < 0.05) (Fig 2e, f)
cases. Thus, the more pronounced microglia and mac-rophage activation supported the assumption that SCD noted in biopsies evolved more recently than SCD observed in autopsy brain samples.
Marked reduction of oligodendrocytes in chronic, but not early subpial MS lesions
To investigate whether oligodendroglial densities in SCD are affected by disease duration, we quantified the density of NogoA+ Ols in SCD in patients with a short (early MS)
or a long (chronic MS) disease duration.
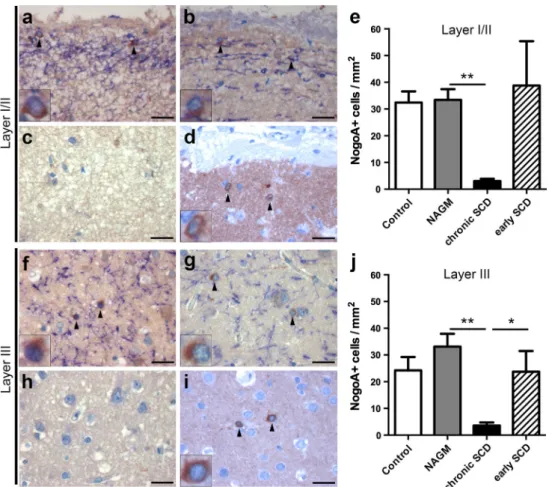
We first assessed the density of NogoA+ Ols in the
superficial layers I/II. Autopsy cases displayed similar numbers of NogoA+ cells in the control cortex (32.4 ± 4.2
cells/mm2, Fig. 3a) compared to normal-appearing MS
cor-tex (NAgM) (33.4 ± 4 cells/mm2, Fig. 3b, e). SCD areas
of progressive MS patients showed a significant decrease of NogoA+ Ols in the superficial layers (3 + 0.8 cells/
mm2, Fig. 3c) compared to adjacent normal-appearing
layers I/II (p < 0.01, Fig. 3b, e). In contrast, NogoA+ cell
numbers in layers I/II were unaltered in SCD of patients with early MS (38.8 + 16.6 cells/mm2, Fig. 3d) as
com-pared to control and MS NAgM (Fig. 3e). The analysis of demyelinated layers I/II showed a trend toward higher numbers of NogoA+ cells in patients with early versus late
MS (p = 0.06).
We further quantified NogoA+ Ols in layer III in MS
and control autopsy cases. MS NAgM displayed similar densities of NogoA+ cells (33.1 ± 4.8 cells/mm2) as
con-trol cortex (24.2 ± 5 cells/mm2) in layer III (Fig. 3f, g). In
progressive MS patients, NogoA+ Ols were significantly
reduced in demyelinated layer III (3.6 ± 1.1 cells/mm2,
Fig. 3h) compared to adjacent normal-appearing layer III (p < 0.01, Fig. 3g, j). In contrast, patients with early MS showed similar oligodendroglial numbers in demyelinated layer III (23.7 ± 7.8 cells/mm2, Fig. 3i) as control and MS
NAgM (Fig. 3j). Significantly more NogoA+ Ols were
detected in demyelinated layer III in patients with early dis-ease than in patients with chronic MS (p < 0.05).
Fig. 1 Subpial cortical demyelination in early and chronic MS cases. Immunohistochemistry for MBP (blue) reveals subpial cortical demyelination (SCD) in early (biopsy) (a) and chronic (autopsy) (b) cases with MS. a exemplary biopsy tissue from one of the patients with early MS shows confluent SCD affecting cortical layers I–III. b exemplary section from one of the autopsy cases with long-standing MS displays the transition zone of normal-appearing myelinated cor-tex (on the left) and SCD (on the right). Arrows indicate the border of the cortical demyelination. Scale bars 1 mm in a and b
reduced density of oligodendrocyte precursor cells (OPCs) in chronic, but not early MS lesions
To address whether the density of OPCs in subpial cortical lesions is affected by disease duration, we quantified OPCs in SCD in early versus late MS. Olig2 is strongly expressed in OPCs and weakly in mature Ols in the adult human CNS [29]. Thus, we only counted the number of Olig2 strong+ cells (referred to as Olig2+ cells).
The densities of Olig2+ cells in the superficial layers I/II
were similar in control (22.7 ± 3.5 cells/mm2, Fig. 4a) and
MS NAgM (21.1 ± 4.8 cells/mm2, Fig. 4b, e). Within
pro-gressive MS cases, Olig2+ cell numbers were decreased in
demyelinated layers I/II (4.3 ± 0.7 cells/mm2, Fig. 4c)
com-pared to adjacent normal-appearing layers I/II (p = 0.05, Fig. 4b, e). In contrast, OPC density was not altered in early SCD of patients with early MS (29.3 ± 14.4 cells/ mm2, Fig. 4d) and showed a trend toward higher densities
compared to chronic SCD (p = 0.06, Fig. 4e). However, we could not detect Olig2+ cells that co-expressed the
prolif-eration marker Ki67 within SCD in these biopsies, indicat-ing that OPCs might have proliferated already before the bioptic surgery took place (data not shown).
We also assessed Olig2+ progenitors in the outer
pyram-idal layer III. The control (17.3 ± 1.5 cells/mm2, Fig. 4f)
and MS NAgM (20.2 ± 2.9 cells/mm2, Fig. 4g) displayed
similar densities of Olig2+ OPCs in layer III. In chronic
MS cases, there was a significant reduction of Olig2+ cells
in demyelinated layer III (7.1 ± 1.8 cells/mm2, Fig. 4h)
compared to adjacent normal-appearing layer III (p < 0.05, Fig. 4g, j). In contrast, early SCD showed no reduction of Olig2+ cells in layer III (35.9 ± 9.4 cells/mm2, Fig. 4i)
compared to control (Fig. 4f) and MS NAgM (Fig. 4g, j). The density of Olig2+ cells in layer III was significantly
reduced in chronic compared to early SCD (p < 0.05, Fig. 4j). Furthermore, the quantification of axonal densities in layer III of chronic SCD did not reveal any significant reduction compared to controls or NAgM (Suppl. Fig. 1). Taken together, these results suggest that Ols and their pre-cursors are not reduced in SCD in early MS, but show a marked decline in progressive disease.
efficient oligodendroglial regeneration after recurrent demyelinating episodes in rats with targeted cortical eAe lesions
We aimed to examine experimentally whether consecu-tive episodes of SCD might lead to loss of oligodendro-glial cells and exhaustion of remyelination. Therefore, we induced repeated SCD within the same anatomical area in an established animal model of MS. In this model, exten-sive cortical remyelination has already been demonstrated after a single demyelinating episode [38]. In the present study, we induced up to four consecutive targeted cortical eAe lesions by repeated stereotactic intracortical cytokine injection (for experimental setup see Fig. 5). As described previously [38], rMOg-immunized rats showed extensive SCD on day 3 after a single intracerebral cytokine injection
Fig. 2 Marked microglia/macrophage activation in early, but not chronic subpial MS lesions. a–f Immunohistochemistry for KiM1P+ macrophages and microglia in SCD of chronic (autopsy) and early (biopsy) cases with MS. representative images show KiM1P+ cells within early (a) and chronic (b) SCD of cortical layers I/II as well as the quantification thereof (c). representative images show KiM1P+
cells in early (d) and chronic (e) SCD within cortical layer III as well as the quantification thereof (f). Black arrowheads point toward exemplary KiM1P+ cells. Insets in a, b, d and e show KiM1P+ cells in greater detail. Scale bars 25 μm in a, b, d, e; error bars indicate SeM. *p < 0.05
(Fig. 6a–c). SCD extended along the pial surface of the ipsilateral hemisphere, reminiscent of subpial type III cor-tical MS lesions. In contrast, the contralateral cortex was devoid of demyelination (Fig. 6d–f).
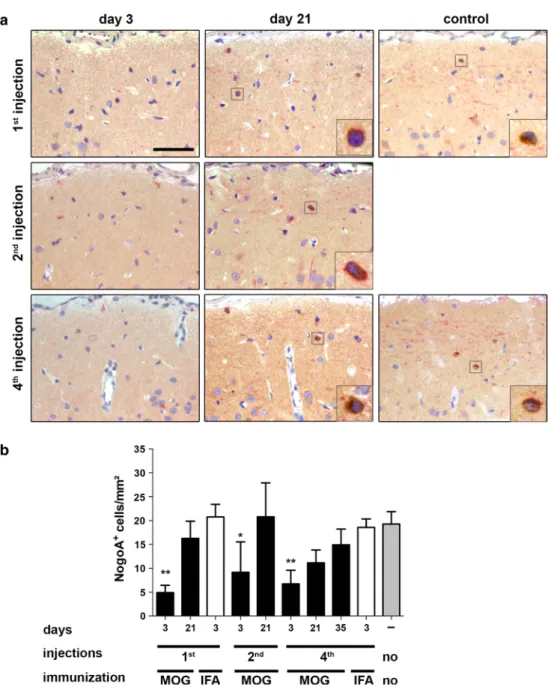
To assess the impact of repetitive SCD on oligodendro-glial regeneration, we then performed repeated intracorti-cal cytokine injections every 3 weeks up to four times into the same anatomical area (see experimental setup Fig. 5). We first assessed the densities of NogoA+ Ols at the
dif-ferent experimental time points and conditions. Three days after the last cytokine injection, NogoA+ Ols were
significantly reduced in rMOg-immunized rats with one (4.9 ± 1.5 cells/mm2; p < 0.01), two (9.2 ± 2.8 cells/mm2, p < 0.05) and four (6.8 ± 2.8 cells/mm2; p < 0.01)
demyeli-nating episodes compared to untreated controls (19.3 ± 2.1 cells/mm2) (Fig. 7a, b). After this initial drop of Ols, a
substantial repopulation of NogoA+ cells was observed in
rMOg-immunized animals 3 weeks after single, twofold and fourfold lesion induction (Fig. 7b). Three weeks after the last injection, animals with one (16.3 ± 3.6 cells/mm2)
and two (20.8 ± 3.5 cells/mm2) demyelinating episodes
showed similar densities of NogoA+ cells as untreated
con-trols. Three weeks following the fourth lesion, there was a trend toward reduced NogoA+ cells compared to
age-matched controls (11.1 ± 2.7 cells/mm2 versus 19.3 ± 2.6
cells/mm2; p = 0.052). To investigate whether this trend
reflected a final stage or rather a delay in oligodendro-glial recruitment, NogoA+ cells were quantified later at
35 days after the fourth injection in rMOg-immunized rats (Fig. 7b). At this later time point, NogoA+ cell density was
similar to control levels (p = 0.36) (Fig. 7b).
We then set out to examine cortical Olig2+ OPCs
(Fig. 8a, b). Three days after the first lesion induction, the density of Olig2+ cells was not reduced in demyelinated
Fig. 3 reduction of oligodendrocytes in cortical layers I/II and layer III in chronic, but not early MS lesions. a–j Immunohistochemistry for MBP (blue) and NogoA+ Ols (brown) within layers I/II (a–d) or layer III (f–i), respectively, and the corresponding quantitative evalu-ation (e, j). representative images of control cortex (a, f), normal-appearing cortex (NAgM) of chronic MS (b, g) as well as chronic (c, h) or early (d, i) SCD. Similar numbers of NogoA+ cells are noted in cortical layers I/II (a, b, d, e) and layer III (f, g, i, j) in the con-trol cortex (a, f), NAgM (b, g) and SCD from patients with early MS
(d, i). In patients with chronic MS, NogoA+ cells are significantly reduced in chronic SCD (c, h) in cortical layers I/II (c) and III (h) each compared to the corresponding NAgM area. The densities of NogoA+ Ols in layer III are significantly decreased in chronic SCD compared to early SCD (j), whereas there is a trend for the group comparison within layers I/II (e) (p = 0.06). NogoA+ cells are indi-cated by black arrowheads and shown in detail in insets. Scale bars 25 μm in a–d and f–i; error bars indicate SeM. *p < 0.05, **p < 0.01
cortex (45.8 ± 2.9 cells/mm2) and similar to non-lesioned
controls (45.7 ± 2.5 cells/mm2, Fig. 8b). Three weeks after
the first lesion induction, however, the density of Olig2+
cells was significantly increased in rMOg-immunized rats (60.1 ± 6.2 cells/mm2) compared to untreated controls
(p < 0.01), to rMOg-immunized rats on day 3 (p < 0.01) and to cytokine-injected controls (40.8 ± 1.0 cells/mm2; p < 0.01).
To examine OPC proliferation after lesion induction, Olig2 and BrdU double-positive cells were quantified in the cortex in animals pretreated with the proliferation marker BrdU. Three weeks after single lesion induction, the density of Olig2/BrdU double-positive cells was sig-nificantly increased in previously demyelinated cortex as compared to the non-demyelinated control group (Suppl. Fig. 2).
Following the second and fourth demyelinating epi-sode, the Olig2+ cell density was already increased on day
3 after the last injection in rMOg-immunized rats (2nd injection 54.1 ± 3.1 cells/mm2, p < 0.05; 4th injection
59.9 ± 5.2 cells/mm2) compared to repeatedly injected
con-trols (Fig. 8a, b). Furthermore, 3 weeks after the second and fourth injection, the numbers of Olig2+ cells were unaltered
in rMOg-immunized rats compared to controls. These find-ings therefore indicate that OPC numbers were not reduced within SCD even after repeated lesion induction.
efficient remyelination after transient acute demyelination in rats with repeated focal lesioning
To compare cortical de- and remyelination after repeated lesioning, animals were evaluated on day 3 for
Fig. 4 reduced oligodendrocyte precursors in chronic, but not early MS lesions. a–j Immunohistochemistry for OPCs with strong Olig2 expression (Olig2+ cells) (brown) and MBP-positive myelin (blue) within layers I/II (a–d) or layer III (f–i), respectively, and the cor-responding quantitative evaluation (e, j). representative images are shown of control cortex (a, f), normal-appearing cortex (NAgM) of chronic MS (b, g) as well as chronic (c, h) and early (d, i) SCD. Sim-ilar numbers of Olig2+ cells are noted in myelinated cortical layers I/II (e) or layer III (j) in control cortex, MS NAgM and SCD from
patients with early MS. In layers I/II, there is a trend for decreased Olig2+ OPCs in chronic SCD (autopsy) (c) compared to either adjacent NAgM (p = 0.05) or demyelinated early SCD (biopsy) (p = 0.06) (e). In layer III Olig2+ cells are significantly reduced in chronic SCD (h, j) compared to NAgM and early SCD (p < 0.05 for both comparisons). Olig2+ cells are indicated by black arrowheads and shown in detail in insets. Scale bars 25 μm in a–d and f–i; error bars indicate SeM. *p < 0.05
demyelination and on day 21 for remyelination after final lesion induction following one, two and four stereotactic cytokine injections.
First, we examined whether repeated cytokine injection was associated with the activation of microglia and mac-rophages in rMOg-immunized animals (Fig. 9). Three days after single, twofold and fourfold lesion induction, the density of activated eD1+ microglia and macrophages
was substantially increased in layer III of the ipsilateral cortex (1st injection 537.1 ± 56.6 cells/mm2, 2nd injection
485.3 ± 52.8 cells/mm2, 4th injection 360 ± 66.3 cells/m2)
in rMOg-immunized rats compared to cytokine-injected control animals (1st injection 56.0 ± 10.7 cells/mm2, 4th
injection 72 ± 4.6 cells/m2, p < 0.001). The infiltration with
eD1+ cells was transient in rMOg-immunized animals and
dropped again to control levels on day 21 after last lesion induction (Fig. 9).
Fig. 5 experimental setup for cortical targeted eAe induction in rats. Animals were immunized with rMOg emulsified in incom-plete Freund’s adjuvant (IFA). Controls (not depicted in the graph) were immunized with IFA only. 20 days later, cytokines were stereo-tactically injected into the cortex either once (top row), twice (mid-dle row) or four times (bottom row) with 3 weeks time interval(s) between each injection
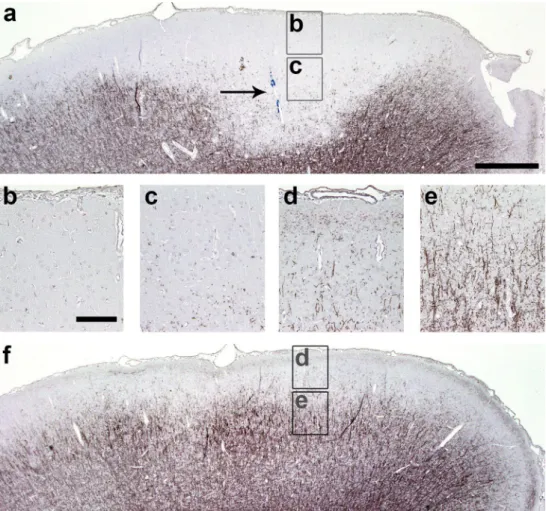
Fig. 6 Focal subpial cortical demyelination in the ipsilateral, but not contralateral cortex after intracerebral cytokine injection in rMOg-immunized rats. a–f representative photographs of MBP-immunostained cortex of rMOg-primed rats on day 3 post-lesion induction (a–c). extensive ipsilateral demyelination is present 3 days
after intracortical cytokine injection in rMOg-immunized rats. Tar-geted lesion is indicated by arrow marking the injected blue dye. d–f In contrast, the contralateral non-injected hemisphere displays intact myelin. Scale bars a and f 500 μm, b–e 100 μm
SCD appeared widespread on MBP-immunostained sec-tions following 3 days after single, two- or fourfold cytokine injection in rMOg-immunized rats (Fig. 10a). In contrast, IFA-immunized controls did not show any signs of demyeli-nation on day 3 after the final cytokine injection (Fig. 10a). In rMOg-immunized animals on day 3 following the last injec-tion, there was a similar degree of cortical demyelination in rats after one (1.5 ± 2.7 mm2), two (1.7 ± 0.2 mm2) or
four (1.8 ± 0.3 mm2) demyelinating episodes (Fig. 10b). All
rMOg-immunized animals showed a significant reduction of the demyelinated area at 3 weeks after final lesion induction compared to the corresponding group on day 3 (1st injec-tion 0.3 ± 0.1 mm2, p < 0.001, 2nd injection 0.5 ± 0.2 mm2, p < 0.01, 4th injection 0.4 ± 0.1 mm2, p < 0.001). The size
of the demyelinated cortical area after 3 weeks was similar in
all rMOg-immunized animals—irrespective of the number of cytokine injections (Fig. 10b). These findings indicate that cortical remyelination is not impaired even after repeated inflammatory demyelination within the same area.
To assess the proportion of remyelinated axons, we quantified axons and myelin fibers after repeated lesioning. Axonal morphology appeared normal, adjacent to the injec-tion site (Suppl. Fig. 3), and axonal densities in layer III resembled untreated control levels after one, two and four stereotactic cytokine injections (Suppl. Fig. 3). To exam-ine whether the density of remyelinated fibers remaexam-ined stable following recurrent cortical demyelination, we cal-culated the ratio between the density of myelinated fib-ers and axons in cortical layer III at different time points (Fig. 10c). In controls the fraction of myelinated cortical
Fig. 7 efficient repopulation with cortical NogoA+ oligoden-drocytes after repeated cycles of cortical demyelination in rats. a representative photographs of NogoA-immunostained sec-tions of lesioned subpial cortex at indicated time points and in different animal groups. b Quantification of NogoA+ cells. At 3 days post-lesion induc-tion, NogoA+ cell density is significantly decreased followed by significant repopulation (on day 21) after one and two demyelinating events. After four episodes of cortical lesion induction, a trend toward lower Ols counts (p = 0.052) is noted in comparison to naive controls. However, 35 days after the fourth lesion induction the density increases again to con-trol levels. Data are expressed as mean + SeM. For statistical evaluation, one-way ANOVA followed by post hoc lSD test is performed (*p < 0.05, **p < 0.01). Scale bar 50 μm, length of enlarged image 14 μm
axons was 40.5 ± 6.4 %. At the demyelination time point (day 3 after the last injection) the proportion of myelinated axons was markedly decreased (1st injection 1.3 ± 0.6 %, 2nd injection 2.7 ± 1.1 %, 4th injection 0.5 ± 0.3 %) in rMOg-immunized rats. Three weeks after the last lesion induction, rMOg-immunized rats displayed a significantly higher proportion of myelinated axons than at the previ-ous demyelination time point (p < 0.01 for 1st, 2nd and 4th injection). Furthermore, a similar fraction of myelinated axons was detected at the remyelination time point after one (16.2 ± 3.0 %), two (22.0 ± 3.8 %) and four (16.6 ± 3.0 %)
stereotactic injections (Fig. 10c). Taken together, these data suggest that the rat cerebral cortex shows a high degree of endogenous oligodendroglial regeneration and remyelination capacity which does not seem to diminish even after four cycles of de- and remyelination in the targeted eAe model. Discussion
Cortical demyelinated lesions in chronic MS patients were recently shown to be widespread and even to exceed
Fig. 8 No reduction of Olig2+ oligodendrocyte precursor popula-tion after repeated demyelinapopula-tion in rats. a representative photo-graphs of Olig2 and PlP double-immunostained sections within the cytokine-injected subpial cortex. Merged overview photographs show Olig2+ precursors (red), PlP+ myelin (green) and DAPI+ nuclei (blue). Arrows point toward Olig2+ OPCs and white squares indi-cate the area from which the insets are taken (upper image Olig2,
middle: DAPI, lower merged image). b No significant reduction of Olig2+ cells is noted at any time point investigated compared to untreated controls. Furthermore, densities of Olig2+ cells are signif-icantly higher on day 21 after the first injection and on day 3 after the fourth injection in rMOg-immunized mice. Data are expressed as mean + SeM. For statistical evaluation, one-way ANOVA followed by post hoc lSD test is performed (**p < 0.01). Scale bar 25 μm
WM lesions with regard to lesion volume [19, 30]. Here, we investigated whether the densities of Ols and OPCs were altered in cortical lesions of early and late-stage MS. Furthermore, we examined the efficacy of OPC and Ol recruitment in cortical demyelinated lesions in a rat model of MS. Our data indicate that NogoA+ Ols as well as
Olig2+ OPCs are substantially reduced in chronic, but not
early cortical MS lesions. In our animal model, NogoA+
cell density was only transiently reduced in the affected cerebral cortex, but rapidly recovered to control levels even after four demyelinating episodes.
remyelination is considered to be an important mecha-nism for long-term axonal protection and is thus of enor-mous therapeutic interest. Accordingly, numerous studies
have investigated the factors promoting remyelination in WM MS lesions [15]. Interestingly, the vast majority of early WM lesions harbor abundant NogoA+ and Olig2+
oligodendroglia and even contain newly formed myelin sheaths that enwrap previously demyelinated axons [33]. Although there is evidence for a variable degree of remy-elination in around 40 % of chronic WM lesions, complete remyelination is rare [21]. Furthermore, chronic late-stage WM lesions contain hardly any mature Ols and also only few OPCs. Cortical lesions show evidence for more extensive remyelination at the lesion border compared to chronic WM lesions [2, 12]. Nevertheless, persistent cor-tical demyelination is an important feature of progressive MS, indicating that cortical remyelination fails at a certain
Fig. 9 Transient increase of activated macrophages and microglia shortly after single and repeated cytokine injec-tion in rats. a representative photographs show eD1-immunostained sections within the cytokine-injected cortex on days 3 and 21 after last lesion induction of the indicated experimental groups. b Quan-tification of eD1+ activated macrophages and microglia within cortical layer III. On day 3 after lesioning, the density of eD1+ macrophages and microglia is significantly higher in rMOg- than IFA-immu-nized animals after single or repeated, respectively, cytokine injection(s). Data are expressed as mean + SeM. For statistical evaluation one-way ANOVA followed by post hoc lSD test is performed (*p < 0.05, **p < 0.01, ***p < 0.001). Scale bar 100 μm
disease stage. It remains unclear which factors contribute to Ol demise and the failure of oligodendroglial differen-tiation in chronic cortical MS lesions. Our findings of rela-tively preserved axonal densities within chronic SCD argue against marked axonal loss as the decisive factor for corti-cal remyelination failure. even though we cannot rule out the possibility that subtle axonal changes and degeneration may still occur in MS gM, such alterations are unlikely to result in OPC loss and the complete lack of remyelination observed in chronic SCD. It seems likely that other factors such as loss of local signals required for OPC survival and
migration [39, 49, 51] contribute to remyelination failure. Furthermore, microglial, astrocytic and neuronal changes might contribute to reduced myelin regeneration in MS cortex.
One hypothesis investigated in the present study was that multiple demyelinating events may lead to failure of remyelination. This is mainly supported by experimen-tal models of the disease [32]. repeated or sustained epi-sodes of demyelination might finally exhaust the ability of OPCs to divide and differentiate into myelinating Ols. Alternatively, OPCs might be depleted from repeatedly
Fig. 10 Unaltered remyelination after repeated cortical demyelina-tion in rats. a representative photographs show MBP-immunostained sections within cytokine-injected cortex on days 3 and 21 after last lesion induction in rMOg-immunized animals and controls. b Quan-tification of the demyelinated cortical area in rMOg- or IFA-immu-nized animals following intracerebral cytokine injection. Animals immunized with rMOg show a similar size of cortical demyelina-tion on day 3 after single or repeated lesion inducdemyelina-tion. likewise, the area of cortical demyelination is consistently decreased in these experimental groups on day 21 after single or repeated lesioning. In
contrast, IFA-immunized controls (“IFA”) show no signs of demy-elination. c Quantification of the myelinated axon fraction reveals a significant reduction of the myelinated axon fraction in demyelinated (day 3) animals compared to remyelinated (day 21) animals and con-trols. The fraction of myelinated axons remains stable at the remy-elination time point (day 21) after single versus repeated injection, but is still significantly lower than in controls. Data are expressed as mean + SeM. For statistical evaluation, one-way ANOVA followed by post hoc lSD test is performed (**p < 0.01, ***p < 0.001). Scale bar 100 μm
demyelinated lesions and be unable to repopulate lesions from the periphery. In addition, multiple demyelinating episodes might furthermore change the tissue microenvi-ronment and the susceptibility of axons to myelination.
In the present study we investigated if multiple cortical demyelinating events lead to the reduction of mature Ols and OPCs, thus limiting the extent of cortical remyelina-tion. We employed a targeted eAe model based on subclin-ical immunization with rMOg [38]. This model reproduces SCD found in MS patients and allows for precise lesion localization and timing. Our data indicate that repeated induction of cortical demyelination does not substantially affect the recruitment of OPCs, the generation of mature Ols or remyelination in rats. It should be noted, however, that a temporary reduction in mature Ols was observed after four cytokine injections, but Ol density recovered at later time points, indicating a slight delay in recruitment.
Our findings are in line with previous experimental work that relied on non-immunological mechanisms of demy-elination. efficient remyelination was observed after three repeated injections of ethidium bromide into the cerebellar peduncle [40]. Similarly, unaltered remyelination capac-ity was also observed in mice after two episodes of toxic cuprizone-induced demyelination [25]. These results in rodent models of CNS demyelination with good preserva-tion of axons, driven by inflammapreserva-tion or by gliotoxic sub-stances, highlight that endogenous remyelination capacity is not substantially impaired even after repeated episodes of demyelination.
In contrast to these experimental findings, patients with long-standing MS showed oligodendroglial depletion in chronic SCD as evidenced by reduced NogoA+ Ols and
Olig2+ OPCs. The reduction of OPCs in chronic SCD
sug-gests that failure of cortical remyelination cannot simply be attributed to differentiation failure of OPCs, as it was suggested for WM MS lesions [11, 29, 42]. Furthermore, the strong reduction in Ols and OPCs observed in long-standing human cortical MS lesions cannot be mimicked by recurrent demyelinating events in our experimental model. One might speculate that four courses of demyelination are not sufficient to exhaust the remyelinating capacity in the rat cortex. It is also conceivable that our model, which is based on anti-MOg antibody-mediated myelin destruc-tion, may not fully mimic the pathogenesis of MS, where the target(s) of the immune reaction and the contribution of anti-myelin antibodies have not yet been determined. In addition, it is well known that remyelination in the rodent brain is a very robust phenomenon. As such, the loss of Ols and OPCs seen in chronic MS may represent a phenomenon that is specific to the disease process in humans. Our model thus is suited to study early lesion formation, but does not lead to the late-stage oligodendroglial deficiency and inabil-ity to remyelinate as found in chronic MS lesions.
In early MS biopsies, NogoA+ mature Ols did not show
any reduction in demyelinated cortical lesions, whereas a transient decrease was observed in the animal setting. How-ever, it is important to note that the lesion stage of SCD is likely to differ between early human biopsy cases and rats with induced SCD. The animal model allows immediate investigations within 3 days after lesion induction, whereas this is not possible in patients who had already undergone a set of diagnostic investigations prior to biopsy. given these temporal differences, it may not be surprising that proliferating OPCs were only observed in rat, but not in human early SCD. Whether mature Ols observed in early MS lesions represent preserved or already repopulated Ols cannot be distinguished based on these single time point biopsies. Interestingly, we noted a trend toward higher OPC numbers in cortical layer I/II in MS biopsies which might indicate previous OPC proliferation.
One important factor associated with altered remyelina-tion capacity and disease progression is aging [14]. In the current study we used up to 4- to 5-month-old rats with a follow-up period of up to 4 months. In contrast, human MS autopsy cases in this study had an average age of 54 years and showed a progressive disease course for at least 10 years. Therefore, experiments in older animals might be required to test whether repeated induction of SCD would finally result in impaired cortical remyelination. Previous experimental studies showed reduced recruitment of OPCs into the lesion area and impaired oligodendroglial differ-entiation in older animals [46, 47]. Furthermore, increased axonal vulnerability and decreased remyelination efficiency were recently reported in aged rats after targeted demy-elination in the spinal WM [22]. Similarly, remyelination is less efficient in aged animals after lysolecithin [20] or cuprizone [45] induced demyelination. Mechanisms con-tributing to such age-related effects may involve intrinsic determinants such as age-dependent epigenetic control of gene expression of OPCs [45] and extrinsic factors acting on OPCs in the lesion microenvironment [23, 52].
A recent study investigated the presence of Ng2+
poly-dendrocytes in cortical demyelinated MS lesions and found similar densities in cortical demyelinated lesions, normal-appearing and control cortex [12]. genetic fate mapping indicates that Ng2+ polydendrocytes can generate both
Ols and astrocytes in gM [53]. Interestingly, constitutive deletion of Olig2 in Ng2+ cells leads to their conversion
into astrocytes in the neocortex and corpus callosum [54]. These findings suggest that Olig2 is crucial for the differen-tiation of Ng2+ polydendrocytes into Ols in the cerebral
cortex. Thus, Ng2+ polydendrocytes lacking Olig2
expres-sion in chronic SCD may have lost their capacity to differ-entiate into myelin-forming Ols.
The precise pathogenetic mechanisms leading to SCD are still not known. However, chronic T- and B-lymphocytic
inflammation in the meninges was associated with shorter time to progression and more severe clinical disease in secondary progressive MS [36]. Meningeal inflammation and cortical demyelination were also recently identified as important features of primary progressive MS, which strongly suggests that inflammation and “neurodegenera-tion” are closely linked phenomena in MS [13]. recent experimental findings indicate that the subarachnoid injec-tion of proinflammatory cytokines is sufficient to induce cortical demyelination in MOg-immunized animals [16]. Consequently, chronically elevated cytokine levels may impede the proliferation, differentiation and survival of cortical Ols, and finally lead to persistent demyelination.
In conclusion, we show that oligodendroglial cells are present in early cortical MS lesions, but substantially decreased in chronic SCD. The latter could not be modeled in our experimental studies in which recruitment of Ols and remyelination were not impaired even after repeated cortical demyelination. This suggests that failure of corti-cal remyelination in chronic MS may not simply result from repeated episodes of cortical demyelination affecting mature Ols, but may also require other factors damaging OPCs at an early differentiation stage. Further studies are needed to unravel the factors involved and mechanisms responsible for the cortical remyelination failure observed in progressive MS.
Acknowledgments We acknowledge the excellent technical sup-port by Mariann Vorm, Jasmin reichl and Brigitte Maruschak, and thank Cynthia Bunker for help with editing the manuscript. C.S. and W.B. were supported by the DFg (Tr-SFB43 “The brain as a target of inflammatory processes”). D.M. holds a stipendiary professorship of the Swiss National Science Foundation (No. PP00P3_128372) and is supported by the gemeinnützige Hertie Stiftung and the Swiss MS Society. D.M. and W.B. are supported by the Klaus-Tschira Stif-tung gmbH. C.W. and W.B. were supported by research funding from Novartis Pharma gmbH. We thank Sven Müller for outstand-ing administrative help. We are indebted to our patients and their relatives.
Conflict of interest The authors do not report any conflict of interest.
Open Access This article is distributed under the terms of the Crea-tive Commons Attribution license which permits any use, distribu-tion, and reproduction in any medium, provided the original author(s) and the source are credited.
References
1. Adelmann M, Wood J, Benzel I et al (1995) The N-terminal domain of the myelin oligodendrocyte glycoprotein (MOg) induces acute demyelinating experimental autoimmune encepha-lomyelitis in the lewis rat. J Neuroimmunol 63:17–27
2. Albert M, Antel J, Bruck W, Stadelmann C (2007) extensive cor-tical remyelination in patients with chronic multiple sclerosis. Brain Pathol 17:129–138
3. Bo l, geurts JJ, van der Valk P, Polman C, Barkhof F (2007) lack of correlation between cortical demyelination and white matter pathologic changes in multiple sclerosis. Arch Neurol 64:76–80 4. Bo l, Vedeler CA, Nyland H, Trapp BD, Mork SJ (2003)
Intracortical multiple sclerosis lesions are not associated with increased lymphocyte infiltration. Mult Scler 9:323–331
5. Bo l, Vedeler CA, Nyland HI, Trapp BD, Mork SJ (2003) Sub-pial demyelination in the cerebral cortex of multiple sclerosis patients. J Neuropathol exp Neurol 62:723–732
6. Brownell B, Hughes JT (1962) The distribution of plaques in the cerebrum in multiple sclerosis. J Neurol Neurosurg Psychiatry 25:315–320
7. Calabrese M, Agosta F, rinaldi F et al (2009) Cortical lesions and atrophy associated with cognitive impairment in relapsing– remitting multiple sclerosis. Arch Neurol 66:1144–1150 8. Calabrese M, Filippi M, gallo P (2010) Cortical lesions in
multi-ple sclerosis. Nat rev Neurol 6:438–444
9. Calabrese M, grossi P, Favaretto A et al (2012) Cortical pathol-ogy in multiple sclerosis patients with epilepsy: a 3 year longitu-dinal study. J Neurol Neurosurg Psychiatry 83:49–54
10. Carroll WM, Jennings Ar, Ironside lJ (1998) Identification of the adult resting progenitor cell by autoradiographic tracking of oligodendrocyte precursors in experimental CNS demyelination. Brain 121:293–302
11. Chang A, Nishiyama A, Peterson J, Prineas J, Trapp BD (2000) Ng2-positive oligodendrocyte progenitor cells in adult human brain and multiple sclerosis lesions. J Neurosci 20:6404–6412 12. Chang A, Staugaitis SM, Dutta r et al (2012) Cortical
remyelina-tion: a new target for repair therapies in multiple sclerosis. Ann Neurol 72:918–926
13. Choi Sr, Howell OW, Carassiti D et al (2012) Meningeal inflam-mation plays a role in the pathology of primary progressive mul-tiple sclerosis. Brain 135:2925–2937
14. Confavreux C, Vukusic S (2006) The natural history of multiple sclerosis. rev Prat 56:1313–1320
15. Franklin rJ, Ffrench-Constant C (2008) remyelination in the CNS: from biology to therapy. Nat rev Neurosci 9:839–855 16. gardner C, Magliozzi r, Durrenberger PF, Howell OW, rundle
J, reynolds r (2013) Cortical grey matter demyelination can be induced by elevated pro-inflammatory cytokines in the subarach-noid space of MOg-immunized rats. Brain 136:3596–3608 17. geurts JJ, Bo l, Pouwels PJ, Castelijns JA, Polman CH, Barkhof
F (2005) Cortical lesions in multiple sclerosis: combined post-mortem Mr imaging and histopathology. AJNr Am J Neurora-diol 26:572–577
18. geurts JJ, Calabrese M, Fisher e, rudick rA (2012) Measure-ment and clinical effect of grey matter pathology in multiple scle-rosis. lancet Neurol 11:1082–1092
19. gilmore CP, Donaldson I, Bo l, Owens T, lowe J, evangelou N (2009) regional variations in the extent and pattern of grey mat-ter demyelination in multiple sclerosis: a comparison between the cerebral cortex, cerebellar cortex, deep grey matter nuclei and the spinal cord. J Neurol Neurosurg Psychiatry 80:182–187
20. gilson J, Blakemore WF (1993) Failure of remyelination in areas of demyelination produced in the spinal cord of old rats. Neuro-pathol Appl Neurobiol 19:173–181
21. goldschmidt T, Antel J, Konig FB, Bruck W, Kuhlmann T (2009) remyelination capacity of the MS brain decreases with disease chronicity. Neurology 72:1914–1921
22. Hampton DW, Innes N, Merkler D, Zhao C, Franklin rJ, Chan-dran S (2012) Focal immune-mediated white matter demyelina-tion reveals an age-associated increase in axonal vulnerability and decreased remyelination efficiency. Am J Pathol 180:1897–1905 23. Hinks gl, Franklin rJ (2000) Delayed changes in growth factor
gene expression during slow remyelination in the CNS of aged rats. Mol Cell Neurosci 16:542–556
24. Howell OW, reeves CA, Nicholas r et al (2011) Meningeal inflammation is widespread and linked to cortical pathology in multiple sclerosis. Brain 134:2755–2771
25. Johnson eS, ludwin SK (1981) The demonstration of recurrent demyelination and remyelination of axons in the central nervous system. Acta Neuropathol 53:93–98
26. Kangarlu A, Bourekas eC, ray-Chaudhury A, rammohan KW (2007) Cerebral cortical lesions in multiple sclerosis detected by Mr imaging at 8 Tesla. AJNr Am J Neuroradiol 28:262–266 27. Kidd D, Barkhof F, McConnell r, Algra Pr, Allen IV, revesz T
(1999) Cortical lesions in multiple sclerosis. Brain 122:17–26 28. Kreutzfeldt M, Bergthaler A, Fernandez M et al (2013)
Neuro-protective intervention by interferon-gamma blockade prevents CD8+ T cell-mediated dendrite and synapse loss. J exp Med 10:2087–2103
29. Kuhlmann T, Miron V, Cui Q, Wegner C, Antel J, Bruck W (2008) Differentiation block of oligodendroglial progenitor cells as a cause for remyelination failure in chronic multiple sclerosis. Brain 131:1749–1758
30. Kutzelnigg A, lucchinetti CF, Stadelmann C et al (2005) Cortical demyelination and diffuse white matter injury in multiple sclero-sis. Brain 128:2705–2712
31. lassmann H (2007) New concepts on progressive multiple scle-rosis. Curr Neurol Neurosci rep 7:239–244
32. linington C, engelhardt B, Kapocs g, lassman H (1992) Induc-tion of persistently demyelinated lesions in the rat following the repeated adoptive transfer of encephalitogenic T cells and demy-elinating antibody. J Neuroimmunol 40:219–224
33. lucchinetti C, Bruck W, Parisi J, Scheithauer B, rodriguez M, lassmann H (1999) A quantitative analysis of oligodendro-cytes in multiple sclerosis lesions. A study of 113 cases. Brain 122:2279–2295
34. lucchinetti CF, Popescu BF, Bunyan rF et al (2011) Inflamma-tory cortical demyelination in early multiple sclerosis. N engl J Med 365:2188–2197
35. Magliozzi r, Howell O, Vora A et al (2007) Meningeal B-cell follicles in secondary progressive multiple sclerosis associate with early onset of disease and severe cortical pathology. Brain 130:1089–1104
36. Magliozzi r, Howell OW, reeves C et al (2010) A gradient of neuronal loss and meningeal inflammation in multiple sclerosis. Ann Neurol 68:477–493
37. Manrique-Hoyos N, Jurgens T, gronborg M et al (2012) late motor decline after accomplished remyelination: impact for pro-gressive multiple sclerosis. Ann Neurol 71:227–244
38. Merkler D, ernsting T, Kerschensteiner M, Bruck W, Stadelmann C (2006) A new focal eAe model of cortical demyelination: mul-tiple sclerosis-like lesions with rapid resolution of inflammation and extensive remyelination. Brain 129:1972–1983
39. Murtie JC, Zhou YX, le TQ, Vana AC, Armstrong rC (2005) PDgF and FgF2 pathways regulate distinct oligodendrocyte lin-eage responses in experimental demyelination with spontaneous remyelination. Neurobiol Dis 19:171–182
40. Penderis J, Shields SA, Franklin rJ (2003) Impaired remyelina-tion and depleremyelina-tion of oligodendrocyte progenitors does not occur following repeated episodes of focal demyelination in the rat cen-tral nervous system. Brain 126:1382–1391
41. Peterson JW, Bo l, Mork S, Chang A, Trapp BD (2001) Tran-sected neurites, apoptotic neurons, and reduced inflammation in cortical multiple sclerosis lesions. Ann Neurol 50:389–400 42. Prineas JW, Kwon ee, goldenberg PZ et al (1989) Multiple
scle-rosis. Oligodendrocyte proliferation and differentiation in fresh lesions. lab Invest 61:489–503
43. radzun HJ, Hansmann Ml, Heidebrecht HJ et al (1991) Detec-tion of a monocyte/macrophage differentiaDetec-tion antigen in rou-tinely processed paraffin-embedded tissues by monoclonal anti-body Ki-M1P. lab Invest 65:306–315
44. roosendaal SD, Moraal B, Pouwels PJ et al (2009) Accumula-tion of cortical lesions in MS: relaAccumula-tion with cognitive impairment. Mult Scler 15:708–714
45. Shen S, Sandoval J, Swiss VA et al (2008) Age-dependent epige-netic control of differentiation inhibitors is critical for remyelina-tion efficiency. Nat Neurosci 11:1024–1034
46. Shields S, gilson J, Blakemore W, Franklin r (2000) remyelina-tion occurs as extensively but more slowly in old rats compared to young rats following gliotoxin-induced CNS demyelination. glia 29:102
47. Sim FJ, Zhao C, Penderis J, Franklin rJ (2002) The age-related decrease in CNS remyelination efficiency is attributable to an impairment of both oligodendrocyte progenitor recruitment and differentiation. J Neurosci 22:2451–2459
48. Stadelmann C, Albert M, Wegner C, Bruck W (2008) Cortical pathology in multiple sclerosis. Curr Opin Neurol 21:229–234 49. Stankoff B, Aigrot MS, Noel F, Wattilliaux A, Zalc B, lubetzki C
(2002) Ciliary neurotrophic factor (CNTF) enhances myelin for-mation: a novel role for CNTF and CNTF-related molecules. J Neurosci 22:9221–9227
50. Wegner C, esiri MM, Chance SA, Palace J, Matthews PM (2006) Neocortical neuronal, synaptic, and glial loss in multiple sclero-sis. Neurology 67:960–967
51. Woodruff rH, Fruttiger M, richardson WD, Franklin rJ (2004) Platelet-derived growth factor regulates oligodendrocyte pro-genitor numbers in adult CNS and their response following CNS demyelination. Mol Cell Neurosci 25:252–262
52. Zhao C, li WW, Franklin rJ (2006) Differences in the early inflammatory responses to toxin-induced demyelination are asso-ciated with the age-related decline in CNS remyelination. Neuro-biol Aging 27:1298–1307
53. Zhu X, Bergles De, Nishiyama A (2008) Ng2 cells generate both oligodendrocytes and gray matter astrocytes. Development 135:145–157
54. Zhu X, Zuo H, Maher BJ et al (2012) Olig2-dependent develop-mental fate switch of Ng2 cells. Development 139:2299–2307