Sumoylation regulates the stability and nuclease
activity of Saccharomyces cerevisiae Dna2
Lepakshi Ranjha
1,7
, Maryna Levikova
2,7
, Veronika Altmannova
3,4
, Lumir Krejci
3,4,5
& Petr Cejka
1,6
Dna2 is an essential nuclease-helicase that acts in several distinct DNA metabolic pathways
including DNA replication and recombination. To balance these functions and prevent
unscheduled DNA degradation, Dna2 activities must be regulated. Here we show that
Sac-charomyces cerevisiae Dna2 function is controlled by sumoylation. We map the sumoylation
sites to the N-terminal regulatory domain of Dna2 and show that in vitro sumoylation of
recombinant Dna2 impairs its nuclease but not helicase activity. In cells, the total levels of
the non-sumoylatable Dna2 variant are elevated. However, non-sumoylatable Dna2 shows
impaired nuclear localization and reduced recruitment to foci upon DNA damage.
Non-sumoylatable Dna2 reduces the rate of DNA end resection, as well as impedes cell growth
and cell cycle progression through S phase. Taken together, these
findings show that in
addition to Dna2 phosphorylation described previously, Dna2 sumoylation is required for the
homeostasis of the Dna2 protein function to promote genome stability.
https://doi.org/10.1038/s42003-019-0428-0
OPEN
1Institute for Research in Biomedicine, Università della Svizzera italiana (USI), Faculty of Biomedical Sciences, Via Vincenzo Vela 6, 6500 Bellinzona, Switzerland.2Institute of Molecular Cancer Research, University of Zürich, Winterthurerstrasse 190, 8057 Zürich, Switzerland.3Department of Biology, Masaryk University, Kamenice 5, 625 00 Brno, Czech Republic.4International Clinical Research Center, St. Anne’s University Hospital, 656 91 Brno, Czech Republic.5National Center for Biomolecular Research, Masaryk University, Kamenice 5, 625 00 Brno, Czech Republic.6Department of Biology, Institute of Biochemistry, Eidgenössische Technische Hochschule (ETH), 8093 Zürich, Switzerland.7These authors contributed equally: Lepakshi Ranjha, Maryna Levikova. Correspondence and requests for materials should be addressed to P.C. (email:[email protected])
123456789
P
ost-translational modifications (PTMs) regulate protein
functions through multiple mechanisms. The covalent
attachment of a small ubiquitin-like modifier (SUMO) to
target substrates is a common modification with a widespread
role in DNA damage response
1–4. SUMO is a small, 76 amino
acids long peptide, which is attached to a lysine residue of the
target substrate via its C-terminal glycine. These enzymatic
reactions are catalyzed by E1, E2, and E3 ligases, similarly to the
ubiquitination system. While vertebrate cells possess three SUMO
proteins (SUMO1 and very similar SUMO2 and SUMO3),
Sac-charomyces cerevisiae contain only a single SUMO protein named
Smt3
1,5.
Sumoylation may compete with other PTMs, such as
ubiqui-tination, acetylation, methylation, hydroxylation, or poly
ADP-ribosylation. It may thus affect protein function indirectly by
interfering with other regulatory pathways, or have a more direct
effect. Sumoylation can positively or negatively regulate protein
stability and proteasomal degradation
6. Additionally,
sumoyla-tion can affect protein–protein interacsumoyla-tions, binding of proteins to
nucleic acids, recruitment and subcellular localization or directly
regulate enzymatic properties
1–4,7. A number of proteins can
specifically interact with sumoylated proteins via their
SUMO-interacting motifs (SIMs)
8. Notably, the SUMO–SIM interaction
can be intermolecular but also intramolecular, as most proteins
targeted by sumoylation also bear SIMs
2. Many proteins acting in
DNA metabolism are regulated by sumoylation, although
typi-cally only a minor fraction of the protein pool is modified
7.
Proteins involved in the homologous recombination (HR)
path-way and DNA damage checkpoint were shown to be subjects of a
sumoylation wave following DNA end resection upon DNA
damage, but the effects on the activities of the individual proteins
remain largely uncharacterized
9.
Dna2 is an essential nuclease-helicase involved in several key
processes of DNA metabolism, including DNA replication, HR
and checkpoint activation
10–15. All Dna2 functions, except for its
role in checkpoint activation, absolutely require its nuclease
activity. Specifically, the Dna2 nuclease is essential for the
pro-cessing of long
flaps that arise during lagging strand synthesis in
DNA replication, while short
flaps are mostly processed by flap
endonuclease 1 (FEN1/Rad27)
12. Dna2 also functions in a poorly
defined pathway upon replication stress, and may be involved in
the degradation of reversed replication forks
16–18. In addition to
DNA replication, Dna2 nuclease functions in conjunction with a
cognate RecQ family helicase (Sgs1 in yeast) to resect
5′-termi-nated DNA end near DNA double-strand breaks (DSBs),
pro-ducing 3′-terminal ssDNA overhangs at break ends
19. The
helicase activity of Dna2 has a supporting function in this process
to degrade ssDNA, while unwinding of dsDNA ahead of Dna2 is
catalyzed by Sgs1
14,20–22. DNA end resection initiates and
com-mits DSB repair to HR. Dna2 is however not the only nuclease
that functions in DNA end resection. The Mre11 nuclease within
the Mre11-Rad50-Xrs2 complex functions upstream of Dna2 in
conjunction with Sae2 and also has a structural role to promote
the Sgs1-Dna2 pathway
14,19,21. The Exo1 nuclease instead
func-tions in parallel with Dna2
19,23,24. Although most reports suggest
that Dna2 and Exo1 represent separate and sometimes redundant
pathways, there is evidence that both branches can cooperate in
some cases
19,24–26.
The recruitment of Dna2 to DSBs is stimulated by
CDK-dependent phosphorylation, which also promotes DNA end
resection
25. However, the underlying mechanisms that regulate
Dna2 levels and activity remain undefined. To date, it has been
reported that sumoylation of Sae2 and the Mre11-Rad50-Xrs2
complex promotes DNA resection by limiting inhibitory
aggre-gation
27. Yeast Mre11 has the capacity to bind sumoylated
pro-teins, which likely facilitates resection complex assembly
28,29.
In contrast, sumoylation of human EXO1 was shown to facilitate
its degradation by promoting ubiquitination
30. Interestingly,
ssDNA generated in course of DNA end resection is required for
the induction of sumoylation upon DNA damage, showing that
DNA end resection proteins are both triggers and targets of
sumoylation
9.
Here, we report that S. cerevisiae Dna2 is sumoylated.
Sumoylation specifically attenuates the nuclease activity of
recombinant Dna2, while the helicase activity is not affected. In
cells, sumoylation leads to reduced levels of the total Dna2
pro-tein, indicating that it facilitates Dna2 degradation. However, the
non-sumoylatable Dna2 variant shows impaired nuclear
locali-zation and reduced recruitment to DNA damage foci. Our results
demonstrate the necessity for precise regulation of Dna2
func-tions to maintain genome stability.
Results
Saccharomyces cerevisiae Dna2 is sumoylated in vivo by Siz2.
Multiple factors involved in DNA metabolism are sumoylated,
which may regulate their recruitment, stability or biochemical
function
4,7. To test whether S. cerevisiae Dna2 is sumoylated, we
overexpressed His-tagged Smt3, coding for the yeast SUMO
protein. We note that the amount of His-tagged Smt3 is much
higher than that of endogenous Smt3, which improves the
detection limit
31. Next, we performed Ni-NTA affinity pulldowns
of His-Smt3-protein conjugates under denaturing conditions
(Fig.
1
), as used previously for other proteins
31,32. To detect Dna2
in the Ni-NTA eluates, we constructed a S. cerevisiae strain
expressing Myc-tagged Dna2 from its native chromosomal locus.
We were able to identify a slower-migrating Dna2-myc species in
the Smt3 pulldown sample (Fig.
1
a, lane 4). In contrast, this
band was reduced when the Ni-NTA affinity purification was
performed with cells transformed with the empty vector that did
not express His-Smt3 (Fig.
1
a, compare lanes 4 and 5), or when
Dna2 was not Myc-tagged (Fig.
1
a, compare lanes 4 and 6). This
suggested that the slower-migrating Dna2 variant may represent a
sumoylated form of Dna2. Since Siz1 and Siz2 are the main
SUMO E3 ligases in S. cerevisiae
2, we wished to determine their
role in Dna2 sumoylation. We deleted them individually or in
combination and repeated the pulldown of the Smt3-protein
conjugates (Fig.
1
b). Only the deletion of SIZ2 or both SIZ1 and
SIZ2, but not SIZ1 alone, led to the decrease of the
slower-migrating Dna2 signal (Fig.
1
b, lanes 5–8). This provided further
support that the observed band indeed corresponds to
sumoy-lated Dna2, and identified Siz2 as the main SUMO ligase
responsible for this modification.
Next, we set out to determine whether Dna2 sumoylation levels
vary throughout the cell cycle. To this point, we synchronized S.
cerevisiae DNA2-myc cells in the G1 phase by
α-factor and
monitored Dna2 protein, as well as its sumoylation levels at
various time points after release (Supplementary Fig. 1a, b).
Surprisingly, the total amounts of Dna2 were low in G1 and early
S phase, while they substantially increased in late S and G2/M
phases of the cell cycle (Supplementary Fig. 1a, b, see also below).
Interestingly, proteasomal degradation of Dna2 upon genotoxic
treatments was reported in yeast cells treated with caffeine,
independently of its checkpoint inhibition effect
33. The Dna2
levels throughout the cell cycle differed from those of Rad27,
which were highest in early S-phase (Supplementary Fig. 1c).
Sumoylation of Dna2 was apparent at the cell cycle phases when
Dna2 was abundant (Supplementary Fig. 1a, b). The
fluctuation
of Dna2 levels throughout the cell cycle might be at least in part
due to protein degradation by proteasome. Therefore, we treated
asynchronous cells with the proteasomal inhibitor MG132 (or
dimethyl sulfoxide, DMSO, as a control), and added
α-factor to
synchronize the cells in G1. Dna2 protein levels were then
followed by western blotting (Supplementary Fig. 1d–f). The
Dna2 protein levels in cells treated with DMSO, relative to
α-tubulin, decreased in course of the synchronization as cells were
arresting in G1 (Supplementary Fig. 1d–f). In contrast, Dna2
levels were modestly stabilized in cells treated with MG132
(Supplementary Fig. 1d–f) showing that proteasomal degradation
may be at least in part responsible for the
fluctuation of the
Dna2 levels throughout the cell cycle. Finally, we observed that
the apparent Dna2 sumoylation level was reduced upon treatment
of cells with various DNA-damaging drugs (Supplementary
Fig. 1g). However, these drugs are also expected to arrest a
proportion of the cells in early S-phase due to problems with
DNA replication, as shown for MMS (Supplementary Fig. 1h, i).
Therefore, the reduced sumoylation of Dna2 upon DNA damage
may simply reflect the reduced overall pool of Dna2.
We note that under all tested conditions, the proportion of
sumoylated Dna2 is very low. We failed to detect sumoylated
Dna2 in cells that were not transformed with His-tagged Smt3, or
without performing the Smt3 pulldown
first, as observed with a
variety of other proteins
34–36. In summary, we show here that
S. cerevisiae Dna2 is likely sumoylated in a reaction dependent
on the Siz2 SUMO ligase. Additionally, we found that the Dna2
protein levels vary throughout the cell cycle, with the highest
amounts detected at a late S-G2 phase.
Sumoylation attenuates the nuclease activity of Dna2. We next
set out to determine the impact of sumoylation on the nuclease
and helicase activities of recombinant Dna2. To this point, we
first optimized an in vitro sumoylation assay with purified Dna2
and the recombinant sumoylation machinery from S. cerevisiae
(Fig.
2
a). When Smt3 was included in the sumoylation reaction,
wild-type Dna2, the nuclease-deficient Dna2 E675A and
helicase-deficient Dna2 K1080E polypeptides migrated higher
on a polyacrylamide gel compared to the mock-treated (without
Smt3) Dna2 variants (Fig.
2
a), showing that Dna2 can be
effi-ciently sumoylated in vitro. We next tested the effect of
Dna2 sumoylation on its nuclease and helicase activities, using
a 5′-tailed oligonucleotide-based DNA substrate (Fig.
2
b–e, and
Supplementary Fig. 2a, b). Sumoylated wild-type Dna2 was
~3-fold less efficient in substrate cleavage than its non-sumoylated
variant from mock reactions lacking Smt3 (Fig.
2
b, c). This was
similar to helicase-dead Dna2 K1080E (Supplementary Fig. 2a,
b), indicating that sumoylation inhibits the nuclease activity of
Dna2. The effect was specific to Dna2 sumoylation, as
recom-binant Smt3 alone had no inhibitory effect on Dna2 nuclease
activity when added to the nuclease reactions (Supplementary
Fig. 2c).
In order to test the effect of sumoylation on the helicase
activity, we utilized the nuclease-deficient Dna2 E675A, as it is
established that the DNA unwinding activity of Dna2 can only
be observed upon inactivation of the nuclease
37–39. Using Dna2
E675A, we observed that the unwinding capacity was unaffected
by sumoylation (Fig.
2
d, e), despite the levels of sumoylation of all
Dna2 variants were comparable (Fig.
2
a). This suggested that
sumoylation specifically inhibits the nuclease, but not the helicase
capacity of Dna2. To further confirm this observation, we also
analyzed the Dna2 ATPase activity, which is detectable in both
wild-type and nuclease-deficient variants. Importantly,
sumoyla-tion did not affect the rate of ATP hydrolysis by Dna2 (Fig.
2
f),
confirming the selective inhibition of the Dna2 nuclease by
sumoylation. Previously, we and others proposed that the motor
activity of Dna2 may not function as a DNA helicase to unwind
dsDNA, but rather as a ssDNA translocase to facilitate
degradation of ssDNA produced by Sgs1 during DNA end
resection
20,22. The interplay of the helicase and nuclease activities
determines the length of DNA fragments resulting from ssDNA
processing: helicase of Dna2 extended the average length of the
DNA products
20,22. To this point, we observed that sumoylation
moderately decreased the overall rate of ssDNA degradation by
Dna2, in agreement with its inhibitory effect on the Dna2
nuclease (Fig.
2
g–i). We also observed that sumoylation of Dna2
led to the generation of longer fragments during the degradation
of ssDNA (Supplementary Fig. 2d). The sumoylation of Dna2
instead did not notably affect its DNA-binding activity
(Supple-mentary Fig. 2e–g). In summary, our results demonstrate that
sumoylation selectively inhibits the nuclease, but not ATPase,
DNA helicase or DNA-binding activities of Dna2 in vitro.
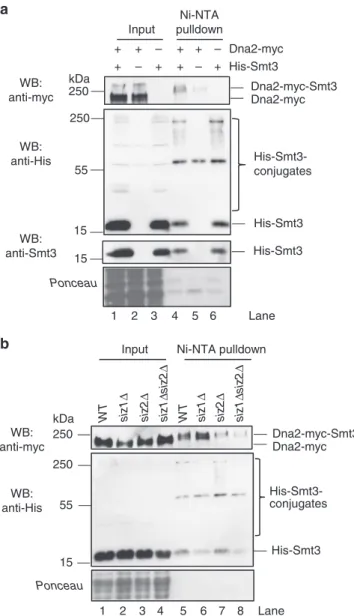
Input Ni-NTA pulldown 1 2 3 4 5 6 1 2 3 4 5 6 7 8 His-Smt3 Dna2-myc – + + + – + – + + + – + WB: anti-myc WB: anti-Smt3 WB: anti-His His-Smt3 His-Smt3 Dna2-myc-Smt3 Ponceau His-Smt3-conjugates Dna2-myc kDa 250 250 55 15 15
a
b
Input Ni-NTA pulldownsiz 1Δ siz 2Δ WT siz 1Δ siz 2Δ siz 1Δ siz 2Δ WT Dna2-myc-Smt3 WB: anti-myc WB: anti-His His-Smt3 His-Smt3-conjugates Ponceau Lane kDa 250 250 55 15 Dna2-myc siz 1Δ siz 2Δ Lane
Fig. 1 S. cerevisiae Dna2 is sumoylated in vivo by the Siz2 SUMO ligase. a Ni-NTA pulldown of His-Smt3 (SUMO) protein conjugates from S. cerevisiae (FF18733 background) cells expressing myc-tagged Dna2. Cells were transformed with vector coding for His-Smt3 or an empty vector as a negative control. Input and pulldown samples were analyzed by western blotting (WB) using antibodies specific for myc tag (detecting Dna2-myc), Smt3 (detecting SUMO/Smt3) and His tag (detecting all His-tagged Smt3 conjugates). Ponceau-stained membrane sections shown serve as a control for equal loading. A representative western blot is shown.b A
representative experiment as ina, but using wild type, siz1Δ, siz2Δ and siz1Δ siz2Δ strains
Dna2 is sumoylated at its N-terminus. To identify the lysine
residues within Dna2 that are sumoylated, we performed mass
spectrometry analysis of the in vitro sumoylated sample, and
identified six potential sites of modification (Fig.
3
a). All these
lysines (K21, K33, K60, K93, K103, and K247) map to the
unstructured N-terminal domain of Dna2 that was shown to
mediate checkpoint activation upon replication stress, facilitate
nuclear localization, promote binding to secondary DNA
struc-tures, participate in the interaction with RPA and limit the Dna2
nuclease
15,25,37,40,41. To verify that sumoylation targets the
N-terminal domain of Dna2, we tested wild type, nuclease- and
helicase-deficient Dna2 variants lacking the N-terminal 405
amino acids in the in vitro sumoylation assay (Fig.
3
b, c). The
sumoylation of the Dna2
Δ405Nvariants was much less efficient
than that of the full-length protein (Fig.
3
c, compare fractions of
unmodified Dna2 variants upon adding Smt3). This confirmed
the N-terminal domain as a target of sumoylation in Dna2. The
truncated Dna2 variants were shown to display elevated levels of
5′ 3′ 3′ 5′ 31 bp No protein Sumo-Dna2 (pM) 17 35 70 140 +Smt3, –Dna2 Dna2 (pM) 17 35 70 140 Substrate Cleaved DNA
c
5′ 3′ 3′ 5′ 31 bp No protein Sumo-Dna2 E675A (pM) 17 35 70 140 Heated Dna2 E675A (pM) 17 35 70 140 dsDNA ssDNAd
a
b
+ – – + – + Smt3 Sumo-Dna2 Dna2 250 150 100 + kDa MarkerDna2 wt Dna2 K1080EDna2 E675A –Dna2
e
0 0 20 40 60 80 100 Sumo-Dna2 Dna2 Cleaved DNA (%)f
5′ 3′ 3′ 5′ 31 bp Marker Sumo-Dna2 (3 nM) 100 0 +Smt3, –Dna2 nt 20 10 1 Marker Dna2 (3 nM) Time (min) ssDNA degradation Substrateg
h
i
+ dsDNA ssDNA DNA degradation 5′ 3′ 19 nt 19 nt 19 nt 19 nt 30 nt 3′ 5′ 31 bp DNA degradation 5′ 3′ 3′ 5′ 31 bp + dsDNA ssDNA ATP hydrolysis –Dna2, +Smt3 Dna2 (4 nM) Sumo-Dna2 (4 nM) 2200 nt DNA degradation +Smt3, –Dna2 2200 nt DNA degradation 2200 nt DNA degradation 0 0 20 40 60 80 1.20 1.15 1.10 1.05 Sumo-Dna2 E675A Dna2 E675A Unwound DNA (%) Absorbance at 340 nm (Sumo–)Dna2 (pM)(Sumo–)Dna2 E675A (pM) Time (min)
0 0 20 40 60 80 100 Time (min) Substrate utilization (%) Dna2 Sumo-Dna2 30 30 30 16 8 4 2 1 0 1 2 4 8 1630 10 20 30 20 40 60 80 50 100 150 1 2 3 4
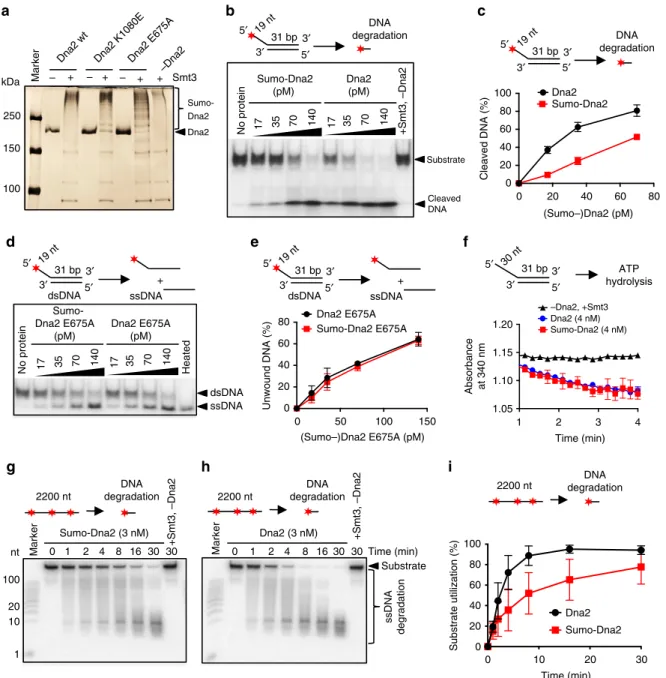
Fig. 2 Sumoylation of Dna2 attenuates its nuclease but not its helicase activity in vitro. a Silver-stained polyacrylamide gel showing in vitro sumoylated (+) and mock-treated (−) S. cerevisiae recombinant Dna2 proteins. Sumoylated Dna2 migrates higher in the gel and is indicated. Dna2 K1080E and Dna2 E675A represent helicase and nuclease-dead variants, respectively.b Representative native polyacrylamide gel showing the degradation of 5′-tailed substrate by sumoylated (Sumo-Dna2) or mock-treated Dna2. The top oligonucleotide was32P-labeled at the 5′-end. The reactions contained replication protein A (RPA) and various Dna2 variant concentrations, as indicated. Filled star indicates position of32P label.c Quantitation of experiments such as in b. Average shown, n= 2; whiskers, range. d Representative native polyacrylamide gel showing the unwinding of 5′-tailed substrate by sumoylated nuclease-dead Dna2 (Sumo-Dna2 E675A) and mock-treated Dna2 E675A.e Quantitation of experiments such as in d. Averages shown, n= 2; whiskers, range. f Quantitation of kinetic experiments showing the absorbance at 340 nm, which corresponds to ATP hydrolysis rate by wild-type sumoylated (Sumo-Dna2) or mock-treated Dna2 (Dna2). Averages shown, n= 2; whiskers, range. g Representative denaturing polyacrylamide gel showing nucleolytic degradation of randomly labeled 2200 nt-long ssDNA by wild-type sumoylated Dna2 (Sumo-Dna2) in the presence of RPA.h Experiment as in g, but with non-sumoylated Dna2.i Quantitation of experiments such as in g and h. Shown is the total substrate utilization. Averages shown, n= 2; whiskers, range
nuclease activity compared to the full-length protein, implicating
the N-terminal domain as an inhibitor of its nuclease activity
41.
Our results thus suggest that sumoylation of the N-terminal
domain may strengthen this inhibitory function.
Next, we substituted all six lysines for non-sumoylatable
residues and purified the mutant polypeptide (Dna2
6K). The
sumoylation of this recombinant Dna2 variant was notably
reduced in comparison to the wild-type protein (Fig.
3
d, e,
compare lanes 3 and 5, note fractions of unmodified Dna2
variants), confirming the mass spectrometry analysis.
Impor-tantly, the nuclease activity of Dna2
6Kwas very similar to that of
the wild-type protein, showing that the lysine substitutions per se
did not compromise the function of the N-terminal domain to
limit the Dna2 nuclease (Fig.
3
f, g). To determine whether the six
lysine residues are the sites of sumoylation also in vivo, we
constructed a myc-tagged dna2
6Kstrain by allelic replacement
strategy
42. Using this mutant strain and myc-tagged DNA2 cells
as a control, we observed that sumoylation of the Dna2 variant
was greatly reduced upon lysine replacement (Fig.
3
h, compare
lanes 5 and 6). In summary, we identified six lysine residues
within the N-terminal regulatory domain of Dna2 that are
sumoylated both in vitro and in vivo. Sumoylation of this
N-terminal domain appears to strengthen its capacity to limit the
nuclease activity of Dna2.
Non-sumoylatable Dna2 shows impaired recruitment. We next
set out to test whether sumoylation controls the stability of the
Dna2 protein. To this point, we synchronized wild-type DNA2
and dna2
6Kcells by
α-factor in G1, and monitored total Dna2
protein levels upon release throughout the cell cycle (Fig.
4
a, b).
Notably, we observed that the Dna2
6Kprotein was ~2–3-fold
more abundant in every phase of the cell cycle tested, as well as in
asynchronous cells compared to its wild type counterpart.
Sumoylation, however, did not affect the relative protein
dis-tribution throughout the cell cycle. Both wild-type and Dna2
6Kproteins were most abundant in late S-G2 phase of the cell cycle,
and least abundant in G1 (Fig.
4
a, b). The DNA2 messenger
RNA (mRNA) levels from DNA2 and dna2
6Kcells were identical,
as anticipated (Fig.
4
c), in agreement with the model that
sumoylation reduces Dna2 protein stability through a
post-translational mechanism. Previously, it has been reported that the
kDa 200 116 45 Marker Dna2 97 Dna2 6K 66 kDa Smt3 + − + − Sumoylated Dna2 200 97 66 Dna2 –Dna2 Dna2 6K Dna2 + 400 800 1000 1522 Helicase Nuclease Regulatory
S. cerevisiae Dna2 protein
K21 K33 K60 K93K103 K247
b
c
d
e
No protein Dna2 (pM) 17 35 70 140 Dna26K (pM) 17 35 70 140 Substrate Cleaved DNAf
g
Marker kDa 200 116 97 66 45 Dna2 Dna2 Δ 405N Dna2 E675A Δ 405N Dna2 K1080E Δ 405N Dna2 K1080E Δ 405N Dna2Δ405N (variants) 200 116 97 66 Marker − + Marker Smt3 Dna2 Δ 405N Dna2 E675A Δ 405N Dna2 Dna2 full-length kDa + − − + + − +a
Input Ni-NTA pulldown
His-Smt3 − + + WB: anti-myc WB: anti-His His-Smt3 Dna2-myc-Smt3 Ponceau − + + − − dna2 6K Dna2-myc
h
Dna2 variant No Dna2DNA2 DNA2 dna2 DNA2 DNA2
6K dna2 6K dna2 6K 5′ 3′ 3′ 5′ 31 bp 19 nt 19 nt DNA degradation 5′ 3′ 3′ 5′ 31 bp DNA degradation 1 2 3 4 5 6 7 8 Lane 116 – – – – 0 50 100 150 0 20 40 60 80 Dna2 Dna26K Dna2 (pM) Cleaved DNA (%) 1 2 3 4 5 Lane 1 2 3 4 5 6 7 8 9 10 11 Lane Sumoylated Dna2 kDa 250 15
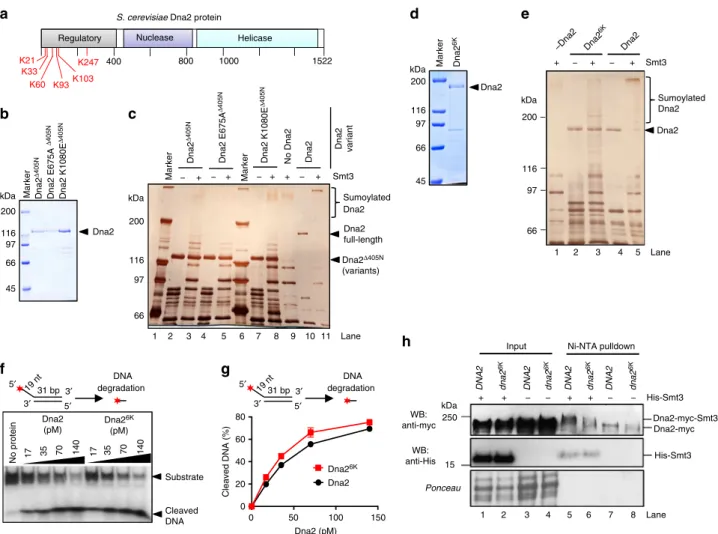
Fig. 3 Sumoylation targets the N-terminal regulatory domain of Dna2. a A schematic representation of Dna2 domain structure. Sumoylated lysine (K) residues, as determined by mass spectrometry analysis of recombinant Dna2, are depicted in red.b Coomassie stained polyacrylamide gel showing purified wt, E675A and K1080E Dna2 variants lacking 405 N-terminal amino acids (Δ405N). c Silver-stained polyacrylamide gel showing in vitro sumoylated (+) and mock-treated (−) full-length and Δ405N Dna2 variants. d Coomassie stained gel showing recombinant non-sumoylatable Dna26K(K21A, K33A, K60A, K93A, K103A, K247A).e Silver-stained polyacrylamide gel showing in vitro sumoylated (+) and mock-treated (−) wt Dna2 and Dna26K polypeptides.f Representative native polyacrylamide gel showing the degradation of 5′-tailed substrate by wt Dna2 or Dna26Kproteins. g Quantitation of experiments such as inf. Averages shown, n= 2; whiskers, range. h Ni-NTA pulldown of His-Smt3 protein conjugates from wild-type Dna2 and Dna26K expressing strains (JKM139 background). Representative western blot (WB) from three independent experiments is shown. The bands in the anti-myc western blot in lanes 7 and 8 likely represent non-sumoylated myc-tagged Dna2 that was nonspecifically bound to the Ni-NTA resin
non-phosphorylatable Dna2 S17A and S237A variants showed
impaired nuclear localization
25. To test whether the
non-sumoylatable Dna2
6Ktranslocates into the nucleus, we prepared
nuclear extracts and compared the levels of wild-type Dna2 and
Dna2
6Kvariants. As shown in Fig.
4
d, Dna2
6Kwas more
abun-dant only in total but not in nuclear extracts. The nuclear levels of
Dna2
6Kwere comparable, or even slightly lower than that of
wild-type Dna2 (Fig.
4
d). This showed that the Dna2
6Kvariant is less
efficiently imported into the nucleus than the wild-type protein.
We also monitored the YFP-tagged Dna2/Dna2
6Kby microscopy.
While Dna2 shows little detectable staining or foci without DNA
damage, we observed that Dna2
6Kshowed reduced recruitment
to DNA damage sites compared to the wild-type protein (Fig.
4
e).
In summary, although the Dna2
6Kmutant shows elevated protein
levels in total cell extracts, the variant is not more abundant
than wild-type Dna2 in the nucleus and shows reduced
recruit-ment to sites of DNA damage.
Non-sumoylatable Dna2 impairs DNA end resection. Dna2
catalyzes long-range DNA end resection together with Sgs1 in a
pathway that may act redundantly with the Exo1 nuclease
19. To
establish whether misregulated Dna2 affects resection, we
ana-lyzed DNA end processing in DNA2 and dna2
6Kcells in an exo1Δ
background, which is needed to highlight defects in the Dna2
pathway
19. To this point, we used an established system that
measures DNA end resection by southern blotting
19. DNA is
cleaved at the MAT locus by HO endonuclease, the expression
of which is induced by the addition of galactose
43. Resected
DNA, which becomes single-stranded, cannot be digested by a
restriction endonuclease, leading to a loss of specific southern blot
signals corresponding to locations at various distances from the
DSB
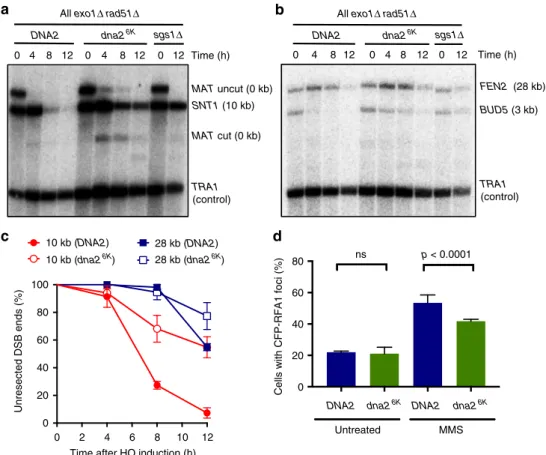
19. At all positions tested, we observed reduced DNA end
resection in dna2
6Kcompared to DNA2 cells (Fig.
5
a–c). This was
further confirmed by monitoring the levels of CFP-RPA foci as a
read out of ssDNA accumulation. Wild-type cells treated with
MMS showed higher accumulation of RPA foci in contrast to
Dna2
6K(Fig.
5
d). The impaired resection in dna2
6Kcells is in
agreement with the reduced nuclear localization and recruitment
of the Dna2
6Kvariant.
Non-sumoylatable Dna2 impedes growth rate. To further
describe
the
cellular
phenotypes
arising
from
impaired
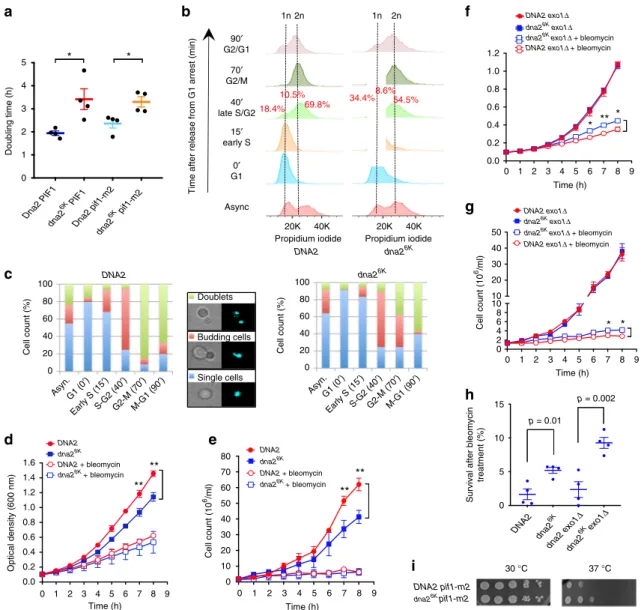
Dna2 sumoylation, we compared the doubling time of DNA2 and
dna2
6Kstrains, as determined by monitoring optical density of
the cultures during exponential growth (Fig.
6
a). We observed
that the dna2
6Kstrain showed a significantly increased doubling
time (lower growth rate) compared to wild-type cells (Fig.
6
a).
The inactivation of the Pif1 helicase was shown to bypass the
requirement for Dna2 in Okazaki fragment processing during
lagging strand DNA replication
44. To determine whether DNA
repair or replication functions of Dna2 are affected by preventing
Dna2 sumoylation, we used the pif1-m2 mutant, which affects
nuclear, but not mitochondrial functions of Pif1
45. The reduced
growth rate was also apparent in the pif1-m2 background (Fig.
6
a
and Supplementary Fig. 3a). This did not exclude a potential
function in DNA replication, but suggested that impaired
Dna2 sumoylation also affects pathways other than Okazaki
fragment processing. Furthermore, in siz2Δ cells, where
a
G1 Early S Late S-G2 G2-M G2-G1 Async G1 Early S Late S-G2 G2-M G2-G1 Async
Dna2-myc WB:
anti-myc
DNA2-myc dna26k-myc
Ponceau
b
d
Time (min) 0 15 40 70 90 – 0 15 40 70 90 – DNA2 dna26K 1 2 3 4 5 6 7 8 9 0 20 40 60 80Cells with YFP-DNA2
foci (%) p < 0.0001 MMS anti-tubulin β-tubulin WB: anti-myc Dna2-myc Ponceau * Total protein Total protein
c
Whole celle
lysate Nuclear extract Dna2 Dna26K + – – – – + + + 0 5 10 15 mRNA levels ( Δ Ct value) DNA2 mRNA RAD27 mRNADNA2 dna26K DNA2 dna26K
G1 Late S-G2 G2-M 0.0 0.2 0.4 0.6 0.8 1.0 1.2
Relative protein levels
kDa 250 kDa 250 50 Lane 10 11 12 Early S G2-G1 DNA2 DNA2 6K
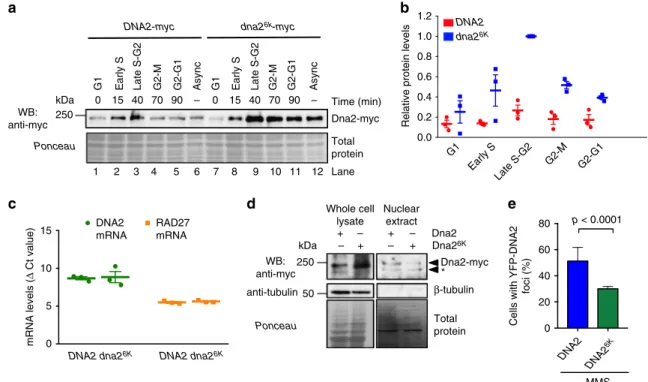
Fig. 4 Sumoylation targets Dna2 for degradation. a A representative western blot comparing the levels of Dna2 vs. non-sumoylatable Dna26Kproteins. Cells (JKM139 background) were synchronized at G1, and released for indicated times. Ponceau-stained membrane is a control for equal loading. Protein levels from asynchronous cells (Async) are also shown.b Quantitation of Dna2 or Dna26Kprotein levels from the experiments such as shown ina. The values are expressed relative to Dna26Klevels at S-G2. Averages shown, n= 3; whiskers, s.e.m. c Real-time PCR was used to obtain cycle threshold levels (relative to Actin,ΔCt) to quantitate DNA2 and RAD27 mRNA levels from DNA2 and dna26Kcells (JKM139 background). Averages shown, n= 3; whiskers, s.e.m.d Comparison of Dna2 and Dna26Klevels in whole cell (20μg) and nuclear extracts (3.8 μg) (JKM139 background) by western blotting. Asterisk indicates a putative Dna2 truncation product.e Quantitative analysis of Dna2-YFP or Dna26K-YFP foci. Cells (yLK354 and yLK388, W303 background) were treated with methyl-methanesulfonate (MMS, 0.015% for 3 h) and subjected to microscopy analysis. The fraction of cells showing Yellow Fluorescent Protein foci is shown. Average and SEM of three independent experiments are shown (n > 160 cells per strain). Statistical significance relative to the wild type was determined by Fisher’s exact test from the total numbers of cells with or without foci from all experiments
Dna2 sumoylation is reduced (Fig.
1
b), the dna2
6Kmutation did
not affect the growth rate (Supplementary Fig. 3b). We note that
the siz2Δ mutation brought about reduced growth rate in both
dna2
6Kand DNA2 backgrounds, likely due to a global defect in
sumoylation (Supplementary Fig. 3b). Nevertheless, the result
suggests that the growth rate reduction is likely linked to the
reduced sumoylation of Dna2
6K. Strains bearing dna2 variants
with less than six mutated lysines did not show an obvious delay
in doubling rate, although we note that we were not able to test
the K21 mutant alone (Supplementary Fig. 3a). This suggests that
Dna2 is either sumoylated alternatively at all six lysine residues,
or the inability to sumoylate Dna2 at one position shifts the
preference towards another residue in the vicinity.
Analysis of cell cycle distribution by
fluorescence-activated cell
sorting (FACS) showed that a higher proportion of asynchronous
dna2
6Kcells accumulated in the G2 phase of the cell cycle (Fig.
6
b
and Supplementary Fig. 3c). Synchronization experiments
then revealed that the inability to sumoylate Dna2 slows down
the capacity of the yeast cells to progress through S phase,
independently of PIF1 status (Fig.
6
b and Supplementary Fig. 3d,
e). This was separately confirmed by observing cellular and
nuclear morphology by microscopy during synchronization. The
appearance of budding cells upon release from G1 was similar in
both dna2
6Kand DNA2 cells (Fig.
6
c). However, at 70 min
post-release,
∼85% of wild-type cells completed nuclear division and
were in the process of cytokinesis. In contrast, at the same time
point, only 38% of dna2
6Kcells reached this stage (Fig.
6
c).
Altogether, our data show that strains with non-sumoylatable
Dna2 exhibit delayed progression through S phase, which results
in impaired growth rate. The reduced growth of dna2
6Kcells was
reminiscent of a growth arrest observed upon Dna2
over-expression shown previously
46. Likewise, dna2
Δ405Ncells lacking
the N-terminal domain of Dna2, which hyperactivates the Dna2
nuclease, also grow poorly
41.
Non-sumoylatable Dna2 is bene
ficial upon stress. Next, we
explored the role of Dna2 sumoylation upon the induction of
DNA damage by the radiomimetic drug bleomycin, which causes
DNA breaks. The DNA2 and dna2
6Kcells were grown in rich
medium without or with bleomycin, and cell growth was
mon-itored by optical density measurements and cell counting. As
above, we observed a significantly reduced growth rate of dna2
6Kcells compared to wild-type cells without induced DNA damage
(Fig.
6
d, e). With bleomycin, in contrast, the growth of DNA2 and
dna2
6Kcells was very similar (Fig.
6
d, e). Likewise, in exo1Δ
background, without DNA damage, the growth of DNA2 and
dna2
6Kcells was indistinguishable (Fig.
6
f, g). Upon bleomycin
treatment, however, dna2
6Kexo1Δ cells in contrast grew better
than DNA2 exo1Δ cells, showing that dna2
6Kmutation provides
growth advantage under conditions of genotoxic stress in the
exo1Δ background (Fig.
6
f, g). The dna2
6Kmutation was similarly
TRA1 (control) FEN2 (28 kb) BUD5 (3 kb) TRA1 (control) SNT1 (10 kb) MAT uncut (0 kb) 0 4 8 12 0 4 8 12 0 12 Time (h) 0 4 8 12 0 4 8 12 0 12
DNA2 dna26K sgs1Δ DNA2 dna26K sgs1Δ
All exo1Δ rad51Δ All exo1Δ rad51Δ
Time (h)
a
b
0 2 4 6 8 10 12 0 20 40 60 80 100Time after HO induction (h)
Unresected DSB ends (%) 10 kb (DNA2) 28 kb (DNA2) 10 kb (dna26K) 28 kb (dna26K )
c
0 20 40 p < 0.0001 60 80 nsCells with CFP-RFA1 foci (%)
Untreated
d
MAT cut (0 kb)
DNA2 dna26K DNA2 dna26K
MMS
Fig. 5 Non-sumoylatable dna26Kcells are impaired in resection of HO-induced DNA breaks.a DNA at the MAT locus was cleaved upon induction of the HO endonuclease with galactose. DNA cleavage and end resection at the indicated time and distance (MAT locus, 0 kb and SNT1, 10 kb) was estimated by southern blotting in DNA2, dna26K, or sgs1Δ cells (JKM139 background). All strains contained exo1Δ and rad51Δ mutations. TRA1 was used as a loading control.b Experiment as in a, but measuring resection at BUD5 (3 kb) and FEN2 (28 kb) loci. c Quantitation of DNA end resection at indicated distances from the DSB from experiments such as shown ina and b. Averages shown, n= 3; error bars, s.e.m. d Quantitative analysis of Rfa1-CFP foci in DNA2 or dna26Kcells (W303 background). Yeast strains (yLK414, and yLK415) were grown under normal conditions or treated with methyl-methanesulfonate (MMS, 0.015% for 3 h) and subjected to microscopy analysis. The fraction of cells showing CFP-Rfa1 (Cyan Fluorescent Protein fused to the replication protein A subunit 1) foci is shown. Average and SEM of three independent experiments are shown (n > 160 cells per strain). Significance relative to wild type was determined by Fisher’s exact test from the total numbers of cells with or without foci from all experiments
beneficial in cell survival assays upon bleomycin treatment, in
both EXO1 and exo1Δ backgrounds (Fig.
6
h). Finally, dna2
6Kcells were less temperature sensitive than DNA2 in the pif1-m2
background (Fig.
6
i). The dna2
6Kmutation did not result in a
detectable change in checkpoint activation, as scored by Rad53
phosphorylation, without or with bleomycin treatment
(Supple-mentary Fig. 4a). Likewise, we did not detect altered amount of
DNA double-strand breaks in dna2
6Kcells compared to wild type
upon DNA damage (Supplementary Fig. 4b). In summary, we
show that in contrast to unperturbed conditions where dna2
6Kcells are impaired, this mutation can be beneficial upon genotoxic
stress. This collectively indicates that Dna2 levels must be
prop-erly balanced to optimally promote genome stability.
Discussion
Dna2 is a nuclease with multiple roles in DNA metabolism, which
remain to be fully defined
12,15,19. In order to support its diverse
functions, the activity and stability of Dna2 must likely be tightly
regulated to allow efficient DNA processing, but not at the cost of
2n 1n
1n 2n DNA2 exo1Δ
dna26K exo1 Δ
DNA2 exo1Δ + bleomycin
dna26K exo1Δ + bleomycin
0 0.0 0.2 0.4 0.6 0.8 1.0 1.2 Time (h)
Time after release from G1 arrest (min)
0′ G1 15′ early S 40′ late S/G2 70′ G2/M 90′ G2/G1 Async DNA2 18.4% 69.8% 10.5% 34.4% 54.5% 8.6% Propidium iodide Propidium iodide 20K 40K 20K 40K
b
a
DNA2c
30 °C 37 °Cd
e
i
h
0.0 0.2 0.4 0.6 0.8 1.0 1.2 1.4 1.6 Optical density (600 nm) ** ** 0 10 20 30 40 50 60 70 80 ** ** Cell count (10 6/ml) Cell count (10 6/ml) * * ** 0 2 4 6 8 10 10 20 30 40 50 * * Dna2 PIF1 dna2 6K PIF1 Dna2 pif1-m2 dna2 6K pif1-m2 0 100 80 60 Cell count (%) 40 20 0 1 2 3 4 5 Doubling time (h) * * 0 5 10 15Survival after bleomycin
treatment (%) p = 0.01 p = 0.002
f
g
Asyn.G1 (0 ′) Early S (15 ′) S-G2 (40 ′) G2-M (70 ′) M-G1 (90 ′) 100 80 60 Cell count (%) 40 20 0 Asyn.G1 (0 ′) Early S (15 ′) S-G2 (40 ′) G2-M (70 ′) M-G1 (90 ′) Doublets Budding cells Single cells dna26K dna26K 1 2 3 4 5 6 7 8 9 DNA2 exo1Δ dna26K exo1ΔDNA2 exo1Δ + bleomycin
dna26K exo1Δ + bleomycin
0 Time (h) 1 2 3 4 5 6 7 8 9 0 Time (h) 1 2 3 4 5 6 7 8 9 0 Time (h) 1 2 3 4 5 6 7 8 9 DNA2 dna2 exo1 Δ dna2 6K exo1 Δ dna2 6K DNA2 dna26K dna26K + bleomycin DNA2 + bleomycin DNA2 dna26K DNA2 pif1-m2 dna26K pif1-m2 dna26K + bleomycin DNA2 + bleomycin
Fig. 6 Non-sumoylatable Dna2 is toxic under normal growth conditions but beneficial upon stress. a Doubling times calculated from cell growth monitored by optical density measurements of wild-type DNA2 and dna26Kcells in wild-type PIF1 or pif1-m2 cells (JKM139 background), as indicated. Averages shown, n= 4; whiskers, s.e.m.; p-values were obtained with two-tailed t-test. b FACS analysis of cell cycle progression of DNA2 and dna26Kstrains (JKM139 background). Cells were synchronized in G1 byα-factor and released for indicated times. 1n and 2n DNA content is indicated by vertical lines. c Cell cycle progression analysis of DNA2 and dna26Kcells (JKM139 background) synchronized as inb, but monitored by light orfluorescence (DAPI) microscopy. Quantitated were single cells (no visible bud), budding cells (with incomplete nuclear division) or doublet cells (complete nuclear division but cells still physically connected).d Growth of DNA2 and dna26Kstrains (JKM139 background) without or with bleomycin (0.1μg/ml), monitored by optical density measurements. Averages shown, n= 3; error bars, s.e.m.; **(p < 0.01, two-tailed t-test). e Growth of DNA2 and dna26Kstrains (JKM139 background) without or with bleomycin (0.1μg/ml), monitored by cell counts. Averages shown, n = 3; error bars, s.e.m.; **(p < 0.01, two-tailed t-test). f Growth of DNA2 exo1Δ and dna26Kexo1Δ strains (JKM139 background) without or with bleomycin (0.1 μg/ml), monitored by optical density measurements. Averages shown, n= 4; error bars, s.e.m.; *(p < 0.05); **(p < 0.01) (two-tailed t-test). g Growth of DNA2 exo1Δ and dna26Kexo1Δ strains (JKM139 background) without or with bleomycin (0.1μg/ml), monitored by cell counts. Averages shown, n = 2; whiskers, range. h Cell (JKM139 background) survival, scored by colony-forming capacity, of indicated strains after treatment with bleomycin (0.1μg/ml) for 8 h. Averages shown, n = 4; whiskers, s.e.m.; p-values were obtained with two-tailed t-test.i Temperature sensitivity of DNA2 and dna26Kstrains (JKM139 background) in the pif1-m2 background. Plates were incubated at 30 °C for 2 days or 37 °C for 3 days. Representative experiments are shown
unscheduled DNA degradation. The results presented here reveal
that yeast Dna2 is post-translationally modified by sumoylation.
We found that sumoylation targets multiple residues located
within the N-terminal domain of Dna2, which has a known
regulatory function. Previously, it was described that the
N-terminal domain of Dna2 is phosphorylated by CDK, which
facilitates nuclear import and recruitment to DNA, which in
turn promotes DNA end resection
25. Sumoylation, as revealed
here, likely regulates the Dna2 functions by several mechanisms.
In total cell extracts, we found that the non-sumoylatable Dna2
mutant (denoted Dna2
6K) was
∼2–3-fold more abundant than
wild-type Dna2. Sumoylation often promotes proteolysis, which
is mediated by SUMO-targeted ubiquitin ligases in both yeast and
humans
6,47. For example, human FEN1 and the
FANCI-FANCD2 complex are sumoylated, which precedes their
ubiquitin-mediated proteasomal degradation
48,49. Sumoylation
also promotes the proteasomal degradation of human EXO1,
while yeast Exo1 is likewise sumoylated
30. Jentsch and colleagues
identified a sumoylation wave that occurs in response to DSBs
that requires extensive resection
9. As several resection pathways
are regulated by sumoylation
27,30, modification of resection
proteins might thus represent a feedback loop. Importantly, while
Dna2
6Klevels were elevated in total cell extracts, we found that
the Dna2
6Kvariant was no more abundant than the wild-type
protein in nuclear extracts, and showed a defect in recruitment
to DNA damage sites. Therefore, similarly as the
non-phosphorylatable Dna2 variant
25, we found that Dna2
6Kwas
partially impaired in nuclear import and recruitment. As a result,
dna2
6Kcells showed a modest defect in DNA end resection.
The mechanism how phosphorylation and sumoylation regulate
these transactions, as well as whether there is a crosstalk between
the two processes, remains to be defined.
Furthermore, using a reconstituted system, we show that
sumoylation specifically reduces the nuclease, but not DNA
binding, helicase or ATPase activities of recombinant Dna2. Seo
and colleagues observed that the N-terminal domain binds a
Dna2 region located further downstream between the nuclease
and the helicase domains, and proposed that the N-terminus of
Dna2 might fold over the nuclease domain to limit its activity
41.
Consequently, Dna2
Δ405, a variant lacking the N-terminal
domain, displays higher levels of nuclease activity compared to
the full-length polypeptide in vitro, and the dna2
Δ405mutation
impairs cell growth
41. Our observations support the role of the
N-terminal domain in Dna2 regulation as its sumoylation limits
the Dna2 nuclease activity. We note that the fraction of
sumoy-lated Dna2 protein at any time in cells is very small, so inhibition
of the Dna2 nuclease by sumoylation cannot affect the activity
of most Dna2 molecules in the protein pool. However, it may be
relevant if Dna2 is preferentially modified “on site”, i.e., when
bound to a particular DNA substrate or a protein partner
7.
What are the other consequences of abrogated Dna2
sumoy-lation? We observed that the non-sumoylatable dna2
6Kstrain
displayed a notably decreased growth rate characterized by
defects in timely progression through the S and G2 phases of the
cell cycle. Balanced levels of the Dna2 protein and activity are
required for optimal growth conditions. Lack of Dna2 is lethal,
while higher than physiological Dna2 levels are toxic as well.
Overexpression of Dna2 was shown to lead to growth arrest
46.
Also, dna2
Δ405cells, lacking the Dna2 N-terminal domain,
dis-played reduced growth rate, while the recombinant Dna2
Δ405mutant is more active as a nuclease than the full-length protein
in vitro
41. In contrast to normal growth conditions, we found that
non-sumoylatable Dna2 can be beneficial upon high levels of
genotoxic stress. Specifically, we observed that dna2
6Kcells did
not show reduced growth rate compared to wild-type cells in
the presence of the radiomimetic drug bleomycin. Instead, the
dna2
6Kmutation even provided growth advantage in the exo1Δ
background, or in assays where cell survival was monitored upon
prolonged exposure to bleomycin. As Dna2 is involved in
mul-tiple DNA metabolic pathways, some of which are not yet
understood, linking the phenotypes of the dna2
6Kcells with a
particular function is challenging. To determine whether
sumoylation controls DNA replication or repair functions of
Dna2, we analyzed the phenotypes of dna2
6Kcells in wild-type
PIF1 or pif1-m2 background, which abrogates the necessity for
Dna2 in Okazaki fragment processing
44. The phenotypes of
dna2
6Kcells were not affected by the pif1-m2 mutation. This did
not exclude a potential effect of Dna2 sumoylation on Okazaki
fragment processing, but indicated that sumoylation also controls
Dna2 functions separate from lagging strand DNA replication.
The precise mechanism however remains to be defined.
Finally, we found that Dna2 protein levels vary during the cell
cycle. Dna2 amounts were lowest in G1 and early S, increased
throughout S to peak in the G2/M phase of the cell cycle. This
variation was not affected by sumoylation, as dna2
6Kcells showed
a similar variation. The Dna2 expression profile differs
sig-nificantly from that of FEN1/Rad27, which is mostly expressed in
early S phase
48. Yeast Dna2 and Fen1 were proposed to function
together in the processing of long DNA
flaps during Okazaki
fragment maturation
12,50. The different expression profile of
Dna2 is in agreement with our previous data that Dna2 may also
function in long DNA
flap processing separately from FEN1
51, or
reflect an Okazaki fragment processing independent function of
Dna2 later in the cell cycle. To this point, yeast dna2Δ cells arrest
in G2-M and human cells with depleted DNA2 arrest in late
S-G2, while yeast rad27Δ (FEN1-deficient) cells accumulate
already in S phase
52–54. This supports the notion that FEN1/
Rad27 and Dna2 act in only partially overlapping pathways
51.
The N-terminal regulatory domain of Dna2 is not present in
the human homolog, suggesting that the mechanism of Dna2/
DNA2 regulation may not be directly conserved. However,
increased expression of human DNA2 was observed in multiple
cancers, which was proposed to counteract replication stress
55,56.
As elevated replication stress is a hallmark of cancer cells,
increased DNA2 expression might help tumor cells overcome this
barrier. Together, the data presented here identify mechanisms
that help regulate Dna2 function, which needs to be balanced to
promote genome stability.
Methods
Recombinant proteins. Wild-type Dna2, Dna2 E675A, and Dna2 K1080E were expressed as fusions with N-terminal FLAG tag and C-terminal His tag. The protein was expressed from a galactose inducible promoter in yeast, and purified by affinity chromatography using Ni-NTA agarose (Qiagen) and M2 anti-FLAG affinity gel (Sigma)39. Genes coding for the Dna2Δ405Nvariants (wt, E675A and
K1080E), as well as for full-length Dna26K(six lysine residues replaced by alanines)
were fused with N-terminal FLAG tag and a C-terminal His tag, cloned into a pYes2 vector (ThermoFisher) and expressed and purified as the full-length pro-teins. Yeast RPA was expressed in Escherichia coli and purified using HiTrap Blue, HiTrap Desalting and HiTrap Q chromatography columns (GE Healthcare)57. The
S. cerevisiae SUMO machinery proteins, including GST-Aos1/Uba2, His-Ubc9, His-FLAG-Smt3-KR (all lysines substituted by arginines, denoted as Smt3 in the text), His-Siz1 (1–465) and His-Siz2 were expressed in E. coli, and purified by affinity and ion exchange chromatography58,59. Yeast nuclear extracts were
prepared by a standard procedure60.
In vitro sumoylation assays and mass spectrometry analysis. In vitro sumoylation assays were performed in 20μl reactions by incubating recombinant Dna2 (350 ng) with GST-Aos1/Uba2 (200 ng), His-Ubc9 (160 ng), His-Siz1 (60 ng) and His-FLAG-Smt3-KR (800 ng) in a buffer containing 50 mM Tris-HCl (pH 7.5), 5 mM magnesium chloride and 1 mM ATP for 40 min at 30 °C61. Proteins were
then directly used for biochemical assays (upon appropriate dilution) or were separated by electrophoresis in polyacrylamide gels and visualized by silver staining using standard procedures. The mass spectrometry analysis of sumoylated Dna2 was carried out by Dorothea Anrather and Gustav Ammerer in Max. F. Perutz Laboratories, Vienna, Austria.
DNA substrates. Oligonucleotides X12-3 and X12-4SC were used for the pre-paration of the 5′-tailed ssDNA substrate with 19 nt-long ssDNA overhang, and oligonucleotides PC292 and X12-4SC for the preparation of the 30 nt-long 5′-tailed substrate39,62. The oligonucleotides used for the nuclease and helicase assays were
32P-labeled at the 5′ terminus with [γ-32P] ATP (Perkin Elmer) and T4
poly-nucleotide kinase (New England Biolabs) according to the manufacturer’s instructions. Unincorporated nucleotides were removed using MicroSpin G25 columns (GE Healthcare) before annealing of the substrates. The randomly labeled 2200 nt-long substrate was prepared by random incorporation of [α-32P] dATP
(Perkin Elmer) into a PCR product, using LigFor and LigRev primers and yeast genomic DNA (yWH436 strain) as a template20. The sequences of oligonucleotides
are listed in Supplementary Table 1.
Nuclease, helicase, and ATPase assays. The experiments were performed in 15μl volume in a reaction buffer containing 25 mM Tris-acetate (pH 7.5), 2 mM magnesium acetate, 1 mM ATP, 1 mM dithiothreitol (DTT), 0.1 mg/ml bovine serum albumin (BSA, New England Biolabs), 1 mM phosphoenolpyruvate, 16 units/ml pyruvate kinase (Sigma), 1 nM DNA substrate (in molecules), 16.8 nM RPA in case of 5′-tailed oligonucleotide-based substrates and 350 nM RPA in case of 2200 nt-long substrate. The reactions were assembled on ice and Dna2 variants were added, as indicated. The reactions with oligonucleotide-based substrates were incubated for 30 min at 30 °C62. Reactions with the 2200 nt-long substrate were
incubated at 30 °C and aliquots were taken at indicated time points. Reactions were stopped by adding an equal volume of formamide dye (95% formamide, 20 mM ethylenediaminetetraacetic acid [EDTA], 0.03% bromophenol blue), samples were heated at 95 °C for 4 min and separated on 20% denaturing polyacrylamide gels (ratio acrylamide:bisacrylamide 19:1, Biorad). Afterfixing in a solution containing 40% methanol, 10% acetic acid and 5% glycerol for 30 min, the gels were dried on DE81 chromatography paper (Whatman) and exposed to storage phosphor screens (GE Healthcare)63. The screens were scanned by Typhoon phosphor imager (GE
Healthcare), and data were quantitated using ImageQuant software. ATPase assay was based on a reaction in which the regeneration of hydrolyzed ATP is coupled to the oxidation of NADH, which can be monitored spectrophotometrically in real-time. The reaction buffer contained the indicated concentrations of Dna2 (or Sumo-Dna2) and 1μM (nucleotides) nucleic acid cofactors, 1 mM ATP, 25 mM Tris-acetate (pH 7.5), 1 mM magnesium acetate, 0.1 mM DTT, 1 mM phosphoe-nolpyruvate, 25 units/ml pyruvate kinase (Sigma), 25 units/mlL-lactate dehy-drogenase (Sigma), and 200μM NADH (Sigma)62,64.
DNA-binding assays. The experiments were performed in a 15μl volume in a binding buffer containing 25 mM Tris-acetate (pH 7.5), 1 mM EDTA, 1 mM DTT, 0.1 mg/ml BSA and 1 nM (in molecules)32P-labeled DNA substrate. After the
addition of the sumoylated or mock-treated Dna2 E675A, the reactions were incubated at 30 °C for 30 min, mixed with 4μl loading dye (50% glycerol, 0.03% bromophenol blue) and separated on 6% polyacrylamide gels. The gels were then dried and processed as noted above.
Yeast strains and plasmids. The experiments shown in Fig.1and Supplementary Fig. 1 were performed using S. cerevisiae FF18733 strain (F. Fabre). The DNA2 gene was C-terminally tagged with 9-MYC tag using pYM18 plasmid65. Plasmid variants
used for His-Smt3 pulldown experiments were YEp181-CUP1-His-SMT3 and the corresponding empty vector (a kind gift from H. Ulrich, IMB, Mainz). All other experiments were performed using JKM139-derived and yWH436 strains19. The
dna26Kmutant (and variants) with lysines replaced by alanines were constructed
by allele replacement strategy using pRS306 plasmid that included selection on minimal media lacking uracil and counterselection with 5-fluoroorotic acid42.
Gene deletions were conducted as follows:Δdna2::URA3 (template for PCR-based deletion cassette pUG72),Δsiz1::URA3 (pUG72), Δsiz2::hphNT1 (pFA6), Δexo1-hphNT1 (pFA6),Δrad51-KanMX (pUG6)65. The imaging of CFP-Rfa1 or
YFP-Dna2 was carried out with strains derived from W303. For full strain list see Supplementary Table 2. Primer sequences are available upon request.
Western blot analysis. Cell extracts were prepared by lysing the cells (from 2 ml culture for input and 50 ml culture for Ni-NTA pulldowns) with 1.85 M sodium hydroxide and 7.4% (v/v) beta-mercaptoethanol followed by protein precipitation with Trichloroacetic acid (10% [v/v]final, PanReac Applichem). Samples were centrifuged (3000 × g for 5 min), the protein pellets were solubilized and denatured in the denaturing buffer (8 M urea, 200 mM Tris-HCl (pH 6.8), 1 mM EDTA, 5% sodium dodecyl sulfate (SDS), 1.5% DTT, 0.03% bromophenol blue) for 10 min at 60 °C before electrophoresis32. Protein electrophoresis and western blotting
were performed according to standard procedures. Following antibodies were used: anti-c-Myc-tag mAb (1:1000, A00704, GenScript), anti-Smt3 (1:1000, ab14405, Abcam), anti-His-tag mAb (1:2500, A00186, GenScript), anti-Rad53 (1:1000, yC-19, sc-6749, Santa Cruz Biotechnology), anti-α-Tubulin (1:1000, YOL1/34, sc-53030, Santa Cruz Biotechnology). Uncropped blots are presented in Supplementary Fig. 5.
Detection of Smt3-Dna2 conjugates. Yeast cells transformed with Yep181-CUP1-His-SMT3 or YEplac181 were grown exponentially until OD600= 1 in minimal medium. Smt3 expression was induced with copper sulfate (100μM final), which was also used to treat samples transformed with an empty vector (no His-Smt3) as a control. Cells were lysed under denaturing conditions as described above. Proteins were precipitated and purified by Ni-NTA affinity chromato-graphy32. Sumoylation of Dna2 was analyzed by western blotting. Genotoxic
treatments were conducted for 1.5 h before harvesting using the following drugs (final concentrations, unless indicated otherwise): methyl-methanesulfonate (MMS, 0.03%, Sigma-Aldrich), bleomycin (5μg/ml, Bleocin, Merck Millipore), etoposide (295μg/ml, Sigma-Aldrich).
Cell synchronization andflow cytometry. Cells were grown until OD600= 0.35 and synchronized by the addition ofα-factor (4 μg/ml, Primmbiotech) in YPD medium (2% bacto peptone, 1% yeast extract, 2% glucose) or minimal medium for 2 h. Cells were released into S-phase by treatment with Pronase (20 mg/ml, Sigma-Aldrich). Samples were collected forflow cytometry and Ni-NTA pulldowns at indicated time points. Forflow cytometry, cells were fixed in 70% ethanol and 250 mM Tris-HCl (pH 7.5) at 4 °C overnight, treated with RNase A (1 mg/ml, Roche) at 37 °C overnight, washed and resuspended in 50 mM Tris-HCl (pH 7.5), 200 mM NaCl, 80 mM MgCl2and propidium iodide (50μg/ml, Sigma-Aldrich). After brief sonication in 50 mM Tris-HCl (pH 7.5), the DNA content was mea-sured using CyAn ADP 9flow cytometer (Beckman Coulter) operated with Summit software and the data was analyzed with FlowJo software (TreeStar). MG132 treatment. Yeast strains were grown overnight in minimal medium containing 0.1% proline and diluted into the same medium containing additionally 0.003% SDS to permeabilize the cells66. After 1 h,α-factor (3 μg/ml, Primmbiotech)
and 75μM MG132 (Sigma) or an equivalent volume of DMSO were added to the cultures. Samples forflow cytometry and western blot analysis were collected at indicated time points.
Pulsed-field gel electrophoresis. Pulsed-field gel electrophoresis was performed at 14 °C in 0.9% (w/v) Pulsed Field Certified Agarose (Biorad) containing TBE buffer (89 mM Tris-borate, 2 mM EDTA) in a CHEF DR III apparatus (9 h, 120°, 5.5 V/cm, 30–18 s switch time; 6 h, 117°, 4.5 V/cm, 18–9 s switch time; 6 h, 112°, 4 V/cm, 9–5 s switch time; Biorad)67. The agarose gel was stained with ethidium
bromide and imaged on an Alpha Innotech Imager.
Growth curves and DNA damage sensitivity assays. Indicated yeast strains were grown overnight in YPD medium (2% bacto peptone, 1% yeast extract, 2% glu-cose). Next morning, the cells were diluted into fresh YPD medium with or without bleomycin (0.1μg/ml) at OD600= 0.1. At indicated time points, growth was monitored by optical density measurements at 600 nm (OD600) or by cell counts. To monitor cell survival, the cells were treated with bleomycin (0.1μg/ml for 8 h) and plated at various dilution on solid YPD medium without the drug. After 2–3 days, the colonies were counted, and expressed as a fraction of survivors from treated vs. non-treated cultures. To monitor temperature sensitivity, various dilutions of the indicated strains were plated on solid YPD medium. The plates were then incubated for 2 days at 30 °C or 3 days at 37 °C.
Quantitative reverse transcription PCR (qRT-PCR). Dna2 and dna26Kcells were
lysed in three volumes of Trizol (TRI REAGENT, TR118, Molecular Research Center) and RNA was isolated using RNA extraction kit (Zymo Research). RNA (500 ng) was reverse transcribed to complementary DNA (cDNA) using qScript cDNA SuperMix (QuantaBio) according to the manufacturer’s instructions. The qRT-PCR reaction was carried out by mixing corresponding cDNA (25 ng), forward and reverse primers with PerfeCTa SYBR Green Fastmix (QuantaBio) as mentioned in manufacturer’s guidelines. RAD27 (orthologue of human FEN1) was used as a control. The primers used are listed in Supplementary Table 1. The RT-PCR was performed in ABI-7900 HT system (Applied Biosystems) and the mRNA levels are reported asΔCt values relative to Actin.
Fluorescence microscopy. Cells were grown shaking in liquid SC+Ade medium at 25 °C overnight. Next day the cultures were diluted in fresh SC+Ade medium to OD600= 0.25, grown for 2–3 hours and processed for fluorescence microscopy68.
CFP-Rfa1 or YFP-Dna2 foci were visualized on a DeltaVision Elite microscope (Applied Precision, Inc.) equipped with a 100 × objective lens. Images were acquired using softWoRx (Applied Precision, Inc.) software. Image analysis and fluorescence intensity quantification were done using Volocity software (Perkin Elmer).
Nuclear staining with 4′,6-diamidino-2-phenylindole (DAPI). Cells were grown in YPD medium (50 ml) to OD600= 0.35, synchronized in G1 phase by adding 3μg/ml α-factor for 1.5 h, released into S-phase upon 20 mg/ml Pronase treatment. Samples for DAPI staining and FACS were collected at indicated time points upon release. For DAPI staining, one volume of cells wasfixed with 2 volumes of 100% ethanol for 1 h. Cells were pelleted (5000 × g for 1 min) and washed with PBS,