DNA-Mediated Self-Assembly of Plasmonic Antennas with
a Single Quantum Dot in the Hot Spot
Francesca Nicoli, Tao Zhang, Kristina Hübner, Boyuan Jin, Florian Selbach,
Guillermo Acuna, Christos Argyropoulos, Tim Liedl, and Mauricio Pilo-Pais*
Dr. F. Nicoli, Dr. T. Zhang,[+] Prof. T. Liedl, Dr. M.Pilo-Pais[++] Faculty of Physics and Center for Nanoscience (CeNS) Ludwig-Maximilians-Universität
München (LMU) 80539 Munich, Germany E-mail: [email protected] K. Hübner, Dr. F. Selbach
Department of Chemistry and Center for Nanoscience (CeNS) Ludwig-Maximilians-Universität München (LMU)
81377 Munich, Germany B. Jin, Prof. C. Argyropoulos
Department of Electrical and Computer Engineering University of Nebraska-Lincoln Lincoln, NE 68588, USA Prof. G. Acuna Department of Physics University of Fribourg 1700 Fribourg, Switzerland
small objects,[1] fluorescence enhance-ment for sensing mole cules at low con-centrations, and Raman spectroscopy.[2] In the case of quantum emitters (QEs) located in a hot spot, the plasmonic enhance-ment increases the absorption. In addition, the spatially confined field in such a plas-monic cavity exhibits quantized modes that promote spontaneous emission (decreased lifetime), the so-called Purcell enhance-ment.[3] Both, plasmonic enhancement and emitter–cavity interactions depend on the relative arrangement and proximity between the QE and the metallic NPs as well as their spectral overlap.[4–6] These interac-tions can be exploited to achieve integrated optoplasmonic devices,[7] such as tunable single photon emission sources with high photon yield and transi-tion rates.[8–15] More interestingly, plasmon control over individual QEs provides many of the requirements demanded by quantum information,[3,5] including Purcell enhancement with direc-tional routing,[13–15] the creation of superposed plasmon–exciton quantum states,[5] and nonlinear optical effects for photonic switches.[16,17] Plasmonic antennas coupling to bright single-fluorophore emitters could further find applications in biosensing and bioimaging.[18] Great efforts have been undertaken on control-ling the Purcell enhancement in plasmonic cavities. It is known that the quality factor (Q) of a plasmonic antenna is usually only
on the order of a few tens.[19] Therefore, a small mode volume (V) is desired in order to obtain a high plasmonic-mediated
Pur-cell factor ( ~ /P Q V).[5,20] To this end, gaps between two closely spaced metallic NPs are ideal to place single QEs with the goal of achieving deterministic, modular, and high throughput assembly of QE–antenna complexes.
DNA can be used as a versatile construction material to arrange metallic[21–27] and semiconductor NPs,[28–30] fluoro-phores,[31–34] and nanodiamonds.[35] DNA-assembled plasmonic hot spots have already been employed to promote enhance-ment of fluorescence[8–10,36,37] and Raman spectroscopy,[38–43] and to obtain strong coupling between plasmons and excitons of J aggregates.[44] Additionally, DNA self-assembly is a versatile technique that can be extended to various plasmonic materials and different QEs, giving custom tunability over the optical properties of the assemblies.[45–48] Importantly, this method enables a one-pot fabrication of trillions of devices in parallel. Here, we employ DNA strand complementarity in combination with stoichiometric tuning and steric hindrance to assemble plasmonic antennas with a small cavity volume, consisting of DNA self-assembly is a powerful tool to arrange optically active components
with high accuracy in a large parallel manner. A facile approach to assemble plasmonic antennas consisting of two metallic nanoparticles (40 nm) with a single colloidal quantum dot positioned at the hot spot is presented here. The design approach is based on DNA complementarity, stoichiometry, and steric hindrance principles. Since no intermediate molecules other than short DNA strands are required, the structures possess a very small gap (≈ 5 nm) which is desired to achieve high Purcell factors and plasmonic enhancement. As a proof-of-concept, the fluorescence emission from antennas assembled with both conventional and ultrasmooth spherical gold particles is measured. An increase in fluorescence is obtained, up to ≈30-fold, compared to quantum dots without antenna.
1. Introduction
When incident radiation is coupled longitudinally to two metallic nanoparticles (NPs) that are in close proximity, oscillating elec-trons, or plasmons, produce a localized region with a strongly enhanced field. The increased field strength of such hot-spots has enabled several applications including optical trapping of
[+]Present address: Max-Planck-Institute for Intelligent Systems, 70569 Stuggart, Germany
[++]Present address: Department of Physics, University of Fribourg, 1700 Fribourg, Switzerland
http://doc.rero.ch
two 40 nm metallic NPs (MNPs) with a single colloidal QD positioned in between. We show that this method is easy to implement, no complex DNA monofunctionalization,[9,49] or protein coverage[36] of the NPs is required, and that it provides high fabrication yields of antennas with an individual quantum dot in a small gap (≈6 nm). Moreover, colloidal NPs possess better crystallinity than lithographically made gold islands,[4] and self-assembled structures are more versatile as they can be readily deposited on any substrate.[12–15,50] To assess the modu-larity of our assembly process, we fabricated antennas with different MNPs (gold and silver) and measured their plasmon resonance. We then characterized the fluorescence emission enhancement of individual QDs placed in the hot spot of the antenna by using wide-field epifluorescence, laser illuminated microscopy. Post scanning electron microscopy (SEM) mapping is performed to ensure that all reported emissions corre-spond to well-formed Au–QD–Au complexes. We observe that depending on the antenna configuration, the fluorescence emission can be enhanced up to ≈30-fold compared to single QDs without antenna.
2. Results and Discussion
2.1. Assembly Principles
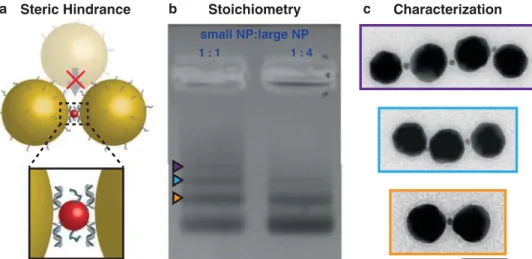
The antenna assemblies consist of one ≈5 nm small NP (either a colloidal QD or a MNP), positioned between two 40 nm MNPs. Each species is separately functionalized with 15 nucleotide (nt) long DNA strands that are complementary to each other and mixed in solution in an ≈1:5 smallNP: largeNP ratio. The dispro-portionate size difference and molar excess favor the formation of largeNP− smallNP− largeNP assemblies. When two large NPs have docked via DNA hybridization to two sides of a small NP, the resulting excluded volume prevents the attachment of further large NPs (see assembly scheme in Figure 1a). The relative excess
of large NPs over small NPs further inhibits the formation of long chains. Using this simple assembling strategy and standard purification procedures, we produce a high yield of antennas with an individual QD located at the center of a plasmonic cavity.
We explored the effects of varying stoichiometry and rela-tive size between the two species. When reducing the stoichi-ometric ratio
(
Nsmall _ NP:Nlarge _ NP)
, the likelihood of obtaininghigher order chains of nanocomponents increases, as free small NPs in solution can bridge already formed antennas to additional large NPs. As shown in Figure 1c, this pro-cess results in the formation of mostly linear arrays of the type largeNP− [smallNP− largeNP]n when n = 1 and 2 (ladder
of bands in the gel shown in Figure 1b). Electrostatic repul-sion of the charged particles maximizes their separation, leading to mostly rather stretched conformations of the chains. For a ladder composed of four gold NPs (n = 3),
mul-tiple conformations are observed (see Note S2, Supporting Information). If the reciprocal size of the particles becomes comparable
(
rsmall _ NP~rlarge _ NP)
, other assembly configurationssuch as nonlinear structures can occur (Note S1, Supporting Information). The different species assembled in solution can be purified through gel electrophoresis. In the unstained gels, multiple bands corresponding to different structures are visible (Figure 1b). Owing to the slower mobility of the higher-order chains in the gel, there is a clear separation between the individual species, which allowed us to isolate and extract the structure of interest. After purification, we estimated the assembly yield of correctly formed antennas within the extracted target band by transmission electron microscopy (TEM) inspection (Figure 1c). We found that depending on the Nsmall _ NP:Nlarge _ NP ratio, 74% to 84% of the structures
cor-respond to the antenna assembly with a single small NP in the gap (see Note S2 in the Supporting Information for more details). To demonstrate the versatility of our method, we assembled four distinct structures with different materials and characterized their plasmon resonance. We constructed
small NP:large NP
1 : 1 1 : 4
a Steric Hindrance b Stoichiometry c Characterization
Figure 1. Assembly and characterization of the plasmonic antenna with a single small NP in the gap. a) Scheme of the assembly principle based
on steric hindrance and controlled stoichiometry. Zoom-in shows the DNA hybridization scheme (“zipper” conformation). b) Purification process (gel electrophoresis, 1% agarose in 1× TAE and 5.5 mM MgCl2) of the target structures, 1:1 and 1:4 refer to the stoichiometric ratio between 5 and 40 nm AuNPs. The fastest migrating band corresponds to one large particle, the second fastest (orange) to two large particles connected by a small one, then three large particles connected by two small ones (blue), etc. c) TEM characterization of exemplary structures extracted from the gel. Other possible conformations including large TEM zoom-outs can be found in Figure 3 and Figures S2–S6 in the Supporting Information. Scale bar 50 nm.
one “all gold” structure where we placed a single 5 nm AuNPs in between two 40 nm AuNPs (Figure 2a), and three struc-tures where we placed a CdSeS/ZnS QD in between two 40 nm MNPs (Figure 2b–d). For the QD antennas, we used either conventionally available AuNPs which possess multiple crystal facets or ultrasmooth highly spherical AuNPs,[51,52] which lead to a narrower plasmonic resonance distribution of the assembled structures. To further demonstrate the ver-satility of our assembly methodology, we fabricated antennas
using silver NPs (AgNPs), which exhibit sharper plasmon resonances than their gold counterparts, granting access to a different part of the optical spectrum.[53]
2.2. Optical Measurements
We characterized the plasmon resonance of the Au–QD–Au antennas assembled with conventional particles and with ultr-asmooth spherical particles. For the former, we obtained a spread in the plasmon resonance between 2.05 and 2.25 eV (Figure 3a). We attribute the spread to the variability of size and shape of AuNPs (see TEM image in Figure 3a), to the different conformations that the assemblies acquire during deposition and subsequent drying on the substrate, and to varying orienta-tions of crystal facets, edges, and vertices of the not perfectly round NPs (see also Note S3 in the Supporting Information). In turn, antennas fabricated with ultrasmooth AuNPs show a narrower plasmon resonance distribution between 2.13 and 2.25 eV (Figure 3b).
The fluorescence emission of semiconductor QDs arises from the electron-hole recombination process at the bandgap, and therefore exhibits a defined energy. QD absorption, in contrast, is continuous from the ultraviolet part of the spectrum all the way to the energy corresponding to the level difference of the first electron transition, where a peak arises (see Note S4 and Figure S10 in the Supporting Information for absorption and emission spectra of QDs). This repre-sents an advantage over most organic fluorophores in which
2.05 2.15 2.25 0.0 0.1 0.2 0.3 0.4
Relative Frequenc
y
Plasmon Resonance [eV]
2.05 2.15 2.25 0.0 0.1 0.2 0.3 0.4
Relative Frequenc
y
Plasmon Resonance [eV]
a
b
Figure 3. TEM images and plasmon resonance spread of Au–QD
antennas. Antennas fabricated with a) conventional and b) ultrasmooth AuNPs. As seen on TEM images, assemblies made with ultrasmooth NPs display lower gap variability, displayed also in more uniform colors of the DF images. Also, the histograms of the respective plasmon resonances (N > 50) show a narrower spread for ultrasmooth NP assemblies. Note that the x-axes display peak energies in eV. Scale bar is 100 nm.
400 450 500 550 600
Normalized Scattering
Wavelength [nm]
500 550 600 650 700QD-Ag Antenna
5 nm Au-Au Antenna
QD-Au Antenna conventional NPs
QD-Au Antenna ultrasmooth NPs
a
b
Figure 2. Assembly of the plasmonic antennas with different
mate-rials and characterization of the plasmon resonance. a) Scheme, TEM imaging, and b) plasmon resonance of antennas made of all Au (orange), Au–QD with conventional AuNPs (dark red), Au–QD with ultrasmooth spherical AuNPs (purple), and Ag–QD (light blue). Scale bar 20 nm.
the emission spectrum is modestly redshifted (Stokes shift) from the excitation spectrum. Thus, optical antennas can be engineered to selectively affect the quantum dots excitation or the emission processes by tuning the plasmon resonance to overlap with the appropriate spectrum (excitation or emis-sion). In this way, the plasmonic effect on the overall fluores-cence emission can be decoupled and individually studied. In our experiments, the plasmon spectrum of the antenna is only slightly shifted from the emission peak by 0.12 eV. Conse-quently, fluorescence quenching by the AuNPs is expected but with a faster decay rate.[54]
We studied the fluorescence emission properties of our structures immobilized on a glass surface in dry conditions. The emission was recorded with a single-photon sensitive camera in the emission pathway of an epifluorescence micro-scope[55] (see Experimental Section for the detailed descrip-tion of the setup). Upon excitadescrip-tion with a circularly polarized laser at 561 nm, we monitored fluorescence from the area of interest by recording the emission intensity as a time series with a bandpass detection filter (570–620 nm). Subsequently, the same area was analyzed with a dark-field (DF) microscope and the resulting map was overlaid with the fluorescence image, as shown in Figure 4. This procedure established a spatial correlation between spots exhibiting fluorescence
and the scattering signals of the antennas. The matching of fluorescence and DF measurements allows the selective anal-ysis of only those emission spots corresponding to the targeted structures while discarding any potential fluorescent contami-nants.[56–58] From the series of frames obtained in the epifluo-rescence measurements, we extracted an intensity time trace for each fluorescent spot (Note S5, Supporting Information). The emission traces were then correlated with the specific plasmon resonance spectrum of each individual antenna, as shown in Figure 4 (see also Note S6 in the Supporting Information). Finally, to ensure the correct assembly of the analyzed structures, each antenna was imaged under SEM using the corresponding DF map as a reference (Figure 4 and Figure S16, Supporting Information).
To determine the effect of the plasmonic hot spot on the QD emission behavior, we compared the fluorescence of single DNA-functionalized QDs with the emission from Au–QD–Au assemblies fabricated with either conventional AuNPs or ultr-asmooth spherical NPs. We quantify the fluorescence emission enhancement of QDs positioned in the plasmonic antenna by normalizing each on-state by the average emission of single QDs without the antenna and obtained a maximum emission enhancement of ≈30× . Exemplary fluorescence traces of QDs and antennas are shown in Figure 5. Two physical processes
DF scattering
500 550 600 650 700Wavelength [nm]
Nor
m.
Scatt.
0 0.2 0.4 0.6 0.8 1SEM
a
b
c
Emission [10 counts]
Time [s]
50 100 150 200 250 300 200 210 220 230 3
Epi-fluorescence
19x
Figure 4. Epifluorescence–DF–SEM correlation. Overlapping a) epifluorescence (left) and DF (right) images of the same area. Exemplary b)
fluores-cence trace and c) scattering spectrum correlation of the spot highlighted in green and its corresponding SEM image (scale bar 50 nm). All fluoresfluores-cence and scattering spectra can be found in Note S9 in the Supporting Information.
influenced by the presence of the antennas are the absorption and emission rates (See Note S7 in the Supporting Informa-tion for a theoretical descripInforma-tion).[14,54,59] Changes in absorp-tion and the spontaneous emission rates depend on the strength of the field, and on the spectral overlap between the plasmon resonance and the emitter’s spectral signature. Indi-vidual QDs in our experiments started emitting immediately upon illumination, displayed a relatively uniform behavior and bleached after a short time. In contrast, the fluorescence emission of all analyzed QD–antenna structures is of greater intensity compared to that of the individual emitters. However, the intensity traces show different behavior from one structure to the other. The on-states are often heterogeneous, displaying multilevel emission intensities, as well as different on-state times.[60,61] Some antennas fluoresced as soon as they were illuminated, while others emitted only after some seconds of irradiation. Although just 10–15% of the antennas lack a QD in the middle (Note S3, Supporting Information), only a frac-tion of the measured antennas displays fluorescence within the acquisition time (400 s). Interestingly, antennas assembled with ultrasmooth spherical NPs display fewer on-states than the ones assembled with conventional AuNPs. The photoemis-sion of QDs have been observed to depend greatly on the surrounding environment, such as the thickness of the pas-sivating shell and capping ligands, leading to effects including significant long off-states and erratic behavior to reduced blinking.[62] The QDs used in this study have a quantum yield (QY) of ≈5% (Note S4, Supporting Information). This low photo-stability is likely the result of their thin passivation layer,[63] which is a common feature of such relatively small QDs, and the presence of thiolated ligands.[64] Assemblies built from even smaller QDs (< 5nm) would result in smaller gap sizes, and therefore higher field and Purcell enhancement, but the smaller sizes would demand an even thinner passivation layer which could further compromise their photostability. Thicker passivating shells, on the other hand, would lead to higher QYs but would in turn result in larger gap sizes and therefore reduced field enhancement.[65] For our study, we had to balance between these factors. The fraction of emitting antennas and duration of the on-states can be improved by using QDs that are more photostable (e.g., high-quality thin pas-sivating shell to reduce surface trapping,[66] surface ligands that decrease nonradiative pathways[67,68]) while the fluorescence
intensity increased by significantly detuning the QD emission from the plasmon resonance.
Since the total emission enhancement depends on the plasmon coupling, we correlated the emission enhancement (maximum fluorescence) and the total emission (emission inte-grated over 400 s) with the plasmon resonance of the respec-tive antenna. As shown by TEM imaging, we observe multiple conformations of the QD–antenna when using commercial NPs, ranging from “stretched,” “compressed,” and “squeezed” conformations (Figure S9, Supporting Information). This is reflected on the spread shown in the plots (Figure 6). We specu-late that the high variability of the enhancement depends on the precise location of the QD within the gap, as corroborated by full-wave simulations (Note S7, Supporting Information). In addition, the presence of facets and the intrinsic variability in the emission of QDs contribute to the spread. Antennas assembled using ultrasmooth NPs (represented by triangles in Figure 6) on the other hand display a more robust assembly with a preferred “compressed” conformation.
To further ensure that the fluorescence observed in our antennas originates from individual QDs and not from poten-tial contaminants (e.g., DNA, buffer contaminants),[57,58] we assembled a control structure consisting of two 40 nm AuNPs spaced by 5 nm without any central particle. The assembly of the control dimers is mediated by a two-layer DNA origami sheet, which determines the width of the gap (cf. our pre-vious work[44] and Note S8, Supporting Information). As expected, none of the control structures showed any emission (Figure S13, Supporting Information).
Finally, we performed fluorescence lifetime measurements on the antennas using a confocal setup at 580 nm excitation wavelength. As expected, the lifetimes of the analyzed traces are highly suppressed compared to individual QDs. The values obtained, following a deconvolution analysis, exhibit a mean lifetime of 0.065 ns, which are greatly below reported values of similar QDs[69] and as one would expect from Purcell enhance-ment due to the nearby AuNPs. These results have a substantial uncertainty since they are considerably lower than the instru-ment response function full width half maximum (FWHM) of ≈0.4 ns (Note S10, Supporting Information). Nevertheless, this analysis yields an upper limit for the lifetime values in the sub-0.4 ns range, well below reported values for similar quantum dots in the absence of antennas.[69]
0 25 50 10 0 a b c 200 220 0 25 50 75 Time [s] 0 100 200 300 400 300 200 100 0 400 300 200 100 0 400 300 200 100 0 400 Time [s] 0 100 200 300 400 Time [s] 0 100 200 300 400
QD without antenna QD with antenna, conventional NPs QD with antenna, ultrasmooth NPs 3x 1x 9x Emission [10 counts] 3 330 350 0 20 40 60 0 25 50 10 0 a b c 200 220 0 25 50 75 Time [s] 0 100 200 300 400 300 200 100 0 400 300 200 100 0 400 300 200 100 0 400 Time [s] 0 100 200 300 400 Time [s] 0 100 200 300 400
QD without antenna QD with antenna, conventional NPs QD with antenna, ultrasmooth NPs 3x 1x 9x Emission [10 counts] 3 330 350 0 20 40 60
Figure 5. Time traces and antenna enhancement. Exemplary fluorescence emission time-traces of a) QDs and antennas made of b) conventional and
c) ultrasmooth AuNPs. The antennas display enhanced emission up to ≈30× compared to individual QDs. Note that the antennas display multilevel fluorescence, as discussed in the main text. The enhancement of the displayed antennas is indicated by the number in the upper left corner. Acquisition binning is 100 ms. All antennas time traces can be found in Note S9 in the Supporting Information.
3. Conclusion
In this work, we presented a simple strategy to build plas-monic antennas with a single QD located at the center of the gap with high yields using DNA-mediated self-assembly. We demonstrate the functionality of these antennas by measuring fluorescence enhancement of the QDs up to ≈30-fold. Due to the fine tuning of this fabrication technique, which is based on steric hindrance and controlled stoichiometry of the species, we fulfilled two fundamental requirements of nanoantennas: i) a very small gap combined with ii) a single QE positioned at the center of a plasmonic cavity. These two factors are impor-tant for the realization of single photon sources and for the control over exciton–plasmon interactions. To obtain reliable fluorescence antennas using our methodology, it is necessary to use high-quality components, such as ultrasmooth NPs[51] to reduce the spread of the plasmon resonances and to obtain a rigid assembly, and well-passivated QDs[66] to avoid excessive off-states and blinking and homogeneous on-states. Our simple self-assembly approach is scalable, as we fabricate trillions of QD–antennas in a few simple steps. This methodology can be extended to any other plasmonic material and any QE function-alized with DNA. Furthermore, our structures can be deposited and measured on different substrates, which implies advan-tages over small gap antennas fabricated via a mirror geometry.
4. Experimental Section
AuNPs Functionalization: Gold and silver NPs of sizes 40 and
5 nm (BBI Solution, for conventional NPs) were functionalized with DNA (sequences in Table S2 in the Supporting Information) using salt aging method, as published in Hurst et al. but using 5 min steps intervals between salt additions.[70] Five nanometer NPs were purified by spin filtration using a 100k Dalton cut-off filter (Amicon Ultra-0.5, #UFC510008, Merck, KgaA). 40 nm NPs were purified using gel electrophoresis (described below).
Synthesis of Ultrasmooth Spherical AuNPs: Forty nanometer
ultrasmooth spherical gold NPs were synthesized in a four-step process.[71,72] First Au3+ ions were reduced to small gold clusters with NaBH4 in cetyltrimethylammonium bromide (CTAB) solution. Seed particles were grown afterwards by adding these clusters in a growth
solution containing Au3+ ions, ascorbic acid, and CTAB. Further larger nanopolyhedrons were formed by anisotropic growth of the small seed particles in cetyltrimethylammonium chloride (CTAC) solution with Au3+ ions and ascorbic acid. To obtain finally ultrasmooth NPs, the surface of nanopolyherdrons were etched by addition of Au3+ ions in CTAB solution.
QDs Functionalization: QDs (Cytodiagnostics) were functionalized
with DNA by mixing the particles with the sequence in Table S2 in the Supporting Information, in water solution and incubated at room temperature for 1 h. QDs were purified by spin filtration with 100k Dalton cut-off filter (Amicon Ultra-0.5). The QDs were estimated to be functionalized with 5 to 40 DNA strands.
Gel Electrophoresis: Forty nanometer AuNPs, antenna constructs, and
control origami dimers were purified using a 1% agarose gel in 40 mM Tris, 1 mM EDTA, and 11 mM MgCl2 (AuNPs, control dimers) or 5.5 mM MgCl2 (antennas). All gels were cooled in an ice water bath and ran at 6 V cm−1 for ≈2 h.
Transmission Electron Microscopy: TEM imaging was performed with a
JEOL JEM-1100 with an acceleration voltage of 80 kV. An ≈10 μL of the sample was deposited on a previously Argon-plasma activated carbon/ formvar substrate (TedPella) for 3 min. Control sample (AuNP dimer with 2LS DNA origami) was subsequently stained with a 2% uranyl formate solution to visualize the DNA origami structure between the AuNPs, while antenna constructs were imaged without staining.
Epi-Fluorescence Microscopy: All fluorescence measurements were
performed with a custom-built setup as described in Schnitzbauer et al.[55] Maximum enhancement occurred when the polarization of the incident light was aligned with the longitudinal axis of the dimer for which a polarizer was introduced followed by a λ/4 plate in the optical path of the 561 nm laser. Illumination is performed using ≈5 mW (≈60 μW μm−2) at the clear aperture of an oil immersion objective (Apo SR TIRF, 100×, NA = 1.49, WD = 0.12 mm, Nikon). This was necessary since the constructs were randomly oriented on the substrate. To separate excitation and emission, a bandpass filter (595 nm center wavelength, 50 nm bandwidth) was placed in the detection path. The signal was acquired by an EMCCD camera (Andor, iXon Ultra, model no. DU-897) with EM gain set to 300. Fluorescence traces were recorded for a period of 400 s with an acquisition time of 100 ms per frame. Fluorescence trace analysis is described in Note S5 in the Supporting Information.
Confocal Lifetime Measurements: Confocal fluorescence measurements
were performed using a home-built confocal setup based on an Olympus IX-83 inverted microscope and a 78 MHz-pulsed laser beam with a wavelength of 580 nm at ≈2 μW excitation power, measured in front of the entrance of the microscope (SuperK Extreme, NKT Photonics). A neutral density filter was used to regulate the laser intensity, followed by a linear polarizer and a λ/4 plate. A dichroic beam splitter (T 610 LPXR, AHF) and an immersion oil objective (UPlanSApo 100×, NA = 1.4, WD = 0.12 mm,
Enhancement Plasmon [eV] 2.05 2.10 2.15 2.20 Plasmon [eV] 0 2 4 6 8 Integrated emission [10 6 counts] a b 2.05 2.10 2.15 2.20 0 5 10 15 20 25 30
Figure 6. Fluorescence versus plasmons resonance correlation. a) Fluorescence enhancement and b) integrated emission of several antennas as a
function of each antenna plasmon resonance over 400 s. Squares and triangles correspond to antennas made with conventional and ultrasmooth spherical AuNPs, respectively. The enhancement is normalized to the average QD emission (red dashed line). Points of the same energy correspond to different on-states of the same antenna. Time traces of all points shown in the graph can be found in Note S9 in the Supporting Information.
Olympus) were used to focus onto the sample. Micropositioning was performed using a Piezo-Stage (E-501.00, Physik Instrumente GmbH&Co. KG). Emitted light was then collected using the same objective and filtered from the excitation light by the dichroic beam splitter. The light was later focused on a 50 μm pinhole (Linos) and detected using a Single-Photon Avalanche Diode (SPCM, AQR 14, PerkinElmer) registered by an TCSPC system (HydraHarp 400, PicoQuant) after additional spectral filtering (Brightline HC 650/60, AHF analysentechnik). A custom-made LabVIEW software (National Instruments) was used to process the gained raw data. Data analysis of the fluorescence lifetime decays were performed by a mono-exponentially fit and a deconvolution from the instrument response function, using the program FluoFit (PicoQuant). Sample preparation for lifetime measurements is described in Note S10 in the Supporting Information.
Dark-Field Microscopy: All DF measurements were performed with
a custom-built setup and procedure as thoroughly described in Roller et al.[44] The signal from each structure was acquired for 60 s in full CCD mode. After isolating the pixels corresponding to the signal of the structure, the corresponding background (adjacent pixels) was subtracted from the signal and normalized using a white Lambertian standard (Spectralon SRS-99, Labsphere).
Scanning Electron Microscopy: SEM measurements were performed
using a Zeiss Leo-DSM 982 SEM microscope, at 3 kV acceleration voltage, working distance 6 mm. Before imaging, samples were sputtered with a few nm layer of Au/Pd.
Supporting Information
Supporting Information is available from the Wiley Online Library or from the author.
Acknowledgements
F.N., T.L., and M.P. conceived the experiment. F.N. and M.P. conducted the wide-field fluorescence and DF experiments, SEM imaging, and corresponding data analysis. K.H. and M.P. conducted the lifetime measurements, and K.H. and G.A. analyzed the lifetime data. T.Z. contributed to the sample fabrication. F.S. fabricated the ultrasmooth spherical NPs. B.J. and C.A. performed the numerical calculations. All the authors contributed to data interpretation and the manuscript preparation. The authors are grateful for the financial support from the Volkswagen foundation and the European Research Council (ERC) through the starting grant 336440, ORCA. B.J. and C.A. acknowledge partial support from the National Science Foundation (NSF) through the Nebraska Materials Research Science and Engineering Center (MRSEC) (grant No. DMR-1420645). G.A. thanks support from Deutsche Forschungsgemeinschaft (DFG, German Research Foundation) AC 279/2-1. The authors thank Prof. Ralf Jungmann, Maximilian Strauß, and Alexander Auer for providing accessibility and support with their TIRF optical setup, Prof. Philip Tinnefeld for accessibility to the confocal instrument, and Prof. Alexander Högele for insightful discussions.
Conflict of Interest
The authors declare no conflict of interest.
Keywords
DNA self-assembly, fluorescence, nanoantennas, plasmonic enhancement, quantum dots
[1] M. L. Juan, M. Righini, R. Quidant, Nat. Photonics 2011, 5, 349. [2] C. Zhan, X.-J. Chen, J. Yi, J.-F. Li, D.-Y. Wu, Z.-Q. Tian, Nat. Rev.
Chem. 2018, 2, 216.
[3] O. Benson, Nature 2011, 480, 193.
[4] L. Novotny, N. van Hulst, Nat. Photonics 2011, 5, 83.
[5] M. S. Tame, K. R. Mcenery, S¸. K. Özdemir, J. Lee, S. A. Maier, M. S. Kim, Nat. Phys. 2013, 9, 329.
[6] M. Pelton, Nat. Photonics 2015, 9, 427.
[7] P. Lodahl, S. Mahmoodian, S. Stobbe, Rev. Mod. Phys. 2015, 87, 347.
[8] G. P. Acuna, F. M. Moller, P. Holzmeister, S. Beater, B. Lalkens, P. Tinnefeld, Science 2012, 338, 506.
[9] M. P. Busson, B. Rolly, B. Stout, N. Bonod, S. Bidault, Nat.
Commun. 2012, 3, 962.
[10] S. Bidault, A. Devilez, V. Maillard, L. Lermusiaux, J.-M. Guigner, N. Bonod, J. Wenger, ACS Nano 2016, 10, 4806.
[11] R. Chikkaraddy, V. A. Turek, N. Kongsuwan, F. Benz, C. Carnegie, T. Van De Goor, B. De Nijs, A. Demetriadou, O. Hess, U. F. Keyser, J. J. Baumberg, Nano Lett. 2018, 18, 405.
[12] N. Kongsuwan, A. Demetriadou, R. Chikkaraddy, J. J. Baumberg, O. Hess, EPJ Appl. Metamater. 2018, 5, 6.
[13] G. M. Akselrod, C. Argyropoulos, T. B. Hoang, C. Ciracì, C. Fang, J. Huang, D. R. Smith, M. H. Mikkelsen, Nat. Photonics 2014, 8, 835.
[14] T. B. Hoang, G. M. Akselrod, C. Argyropoulos, J. Huang, D. R. Smith, M. H. Mikkelsen, Nat. Commun. 2015, 6, 1.
[15] T. B. Hoang, G. M. Akselrod, M. H. Mikkelsen, Nano Lett. 2016, 16, 270.
[16] S. M. Skoff, A. Rauschenbeutel, Nat. Photonics 2016, 10, 438. [17] A. D. Boardman, A. V. Zayats, in Modern Plasmonics (Eds:
A. Maradudin, J. R. Sambles, W. L. Barnes), Elsevier Science, Oxford
2014, pp. 329–347.
[18] I. Kaminska, J. Bohlen, S. Mackowski, P. Tinnefeld, G. P. Acuna,
ACS Nano 2018, 12, 1650.
[19] C. Sauvan, J. P. Hugonin, I. S. Maksymov, P. Lalanne, Phys. Rev.
Lett. 2013, 110, 237401.
[20] J. A. Schuller, E. S. Barnard, W. Cai, Y. C. Jun, J. S. White, M. L. Brongersma, Nat. Mater. 2010, 9, 193.
[21] C. J. Loweth, W. B. Caldwell, X. Peng, A. P. Alivisatos, P. G. Schultz,
Angew. Chem., Int. Ed. 1999, 38, 1808.
[22] F. A. Aldaye, H. F. Sleiman, J. Am. Chem. Soc. 2007, 129, 4130. [23] S. Pal, J. Sharma, H. Yan, Y. Liu, Chem. Commun. 2009, 6059. [24] A. J. Mastroianni, S. A. Claridge, A. P. Alivisatos, J. Am. Chem. Soc.
2009, 131, 8455.
[25] B. Ding, Z. Deng, H. Yan, S. Cabrini, R. N. Zuckermann, J. Bokor,
J. Am. Chem. Soc. 2010, 132, 3248.
[26] S. Sheikholeslami, Y.-W. Jun, P. K. Jain, A. P. Alivisatos, Nano Lett.
2010, 10, 2655.
[27] R. J. Macfarlane, B. Lee, M. R. Jones, N. Harris, G. C. Schatz, C. A. Mirkin, Science 2011, 334, 204.
[28] M. M. Maye, O. Gang, M. Cotlet, Chem. Commun. 2010, 46, 6111. [29] S. H. Ko, K. Du, J. A. Liddle, Angew. Chem., Int. Ed. 2013, 52, 1193. [30] Z. Deng, A. Samanta, J. Nangreave, H. Yan, Y. Liu, J. Am. Chem.
Soc. 2012, 134, 17424.
[31] J. K. Hannestad, P. Sandin, B. Albinsson, J. Am. Chem. Soc. 2008,
130, 15889.
[32] R. Chhabra, J. Sharma, H. Wang, S. Zou, S. Lin, H. Yan, S. Lindsay, Y. Liu, Nanotechnology 2009, 20, 485201.
[33] I. H. Stein, C. Steinhauer, P. Tinnefeld, J. Am. Chem. Soc. 2011, 133, 4193.
[34] F. Nicoli, A. Barth, W. Bae, F. Neukirchinger, A. H. Crevenna, D. C. Lamb, T. Liedl, ACS Nano 2017, 11, 11264.
[35] T. Zhang, A. Neumann, J. Lindlau, Y. Wu, G. Pramanik, B. Naydenov, F. Jelezko, F. Schüder, S. Huber, M. Huber, F. Stehr, A. Högele, T. Weil, T. Liedl, J. Am. Chem. Soc. 2015, 137, 9776.
[36] E. Cohen-Hoshen, G. W. Bryant, I. Pinkas, J. Sperling, I. Bar-Joseph,
Nano Lett. 2012, 12, 4260.
[37] A. Puchkova, C. Vietz, E. Pibiri, B. Wünsch, M. Sanz Paz, G. P. Acuna, P. Tinnefeld, Nano Lett. 2015, 15, 8354.
[38] D.-K. Lim, K.-S. Jeon, H. M. Kim, J.-M. Nam, Y. D. Suh, Nat. Mater.
2010, 9, 60.
[39] J. Prinz, B. Schreiber, L. Olejko, J. Oertel, J. Rackwitz, A. Keller, I. Bald, J. Phys. Chem. Lett. 2013, 4, 4140.
[40] M. Pilo-Pais, A. Watson, S. Demers, T. H. Labean, G. Finkelstein,
Nano Lett. 2014, 14, 2099.
[41] P. Kühler, E.-M. Roller, R. Schreiber, T. Liedl, T. Lohmüller, J. Feldmann, Nano Lett. 2014, 14, 2914.
[42] V. V. Thacker, L. O. Herrmann, D. O. Sigle, T. Zhang, T. Liedl, J. J. Baumberg, U. F. Keyser, Nat. Commun. 2014, 5, 3448.
[43] S. Simoncelli, E.-M. Roller, P. Urban, R. Schreiber, A. J. Turberfield, T. Liedl, T. Lohmüller, ACS Nano 2016, 10, 9809.
[44] E.-M. Roller, C. Argyropoulos, A. Högele, T. Liedl, M. Pilo-Pais,
Nano Lett. 2016, 16, 5962.
[45] S. J. Tan, M. J. Campolongo, D. Luo, W. Cheng, Nat. Nanotechnol.
2011, 6, 268.
[46] M. Pilo-Pais, G. P. Acuna, P. Tinnefeld, T. Liedl, MRS Bull. 2017,
42, 936.
[47] N. Liu, T. Liedl, Chem. Rev. 2018, 118, 3032.
[48] A. Kuzyk, R. Jungmann, G. P. Acuna, N. Liu, ACS Photonics 2018, 5, 1151.
[49] M. P. Busson, B. Rolly, B. Stout, N. Bonod, E. Larquet, A. Polman, S. Bidault, Nano Lett. 2011, 11, 5060.
[50] R. Chikkaraddy, B. de Nijs, F. Benz, S. J. Barrow, O. A. Scherman, E. Rosta, A. Demetriadou, P. Fox, O. Hess, J. J. Baumberg, Nature
2016, 535, 127.
[51] Y.-J. Lee, N. B. Schade, L. Sun, J. A. Fan, D. R. Bae, M. M. Mariscal, G. Lee, F. Capasso, S. Sacanna, V. N. Manoharan, G.-R. Yi, ACS
Nano 2013, 7, 11064.
[52] J. Lee, J. H. Huh, K. Kim, S. Lee, Adv. Funct. Mater. 2018, 28, 1. [53] C. Vietz, I. Kaminska, M. Sanz Paz, P. Tinnefeld, G. P. Acuna, ACS
Nano 2017, 11, 4969.
[54] P. Bharadwaj, L. Novotny, Opt. Express 2007, 15, 14266.
[55] J. Schnitzbauer, M. T. Strauss, T. Schlichthaerle, F. Schueder, R. Jungmann, Nat. Protoc. 2017, 12, 1198.
[56] A. Neumann, J. Lindlau, A. Högele, arXiv1706.08341v1, arXiv.org
e–Print Arch. 2017.
[57] F. T. Rabouw, N. M. B. Cogan, A. C. Berends, W. Van Der Stam, D. Vanmaekelbergh, A. F. Koenderink, T. D. Krauss, C. D. M. Donega, Sci. Rep. 2016, 6, 21187.
[58] X. Wang, X. Ren, K. Kahen, M. A. Hahn, M. Rajeswaran, S. Maccagnano-Zacher, J. Silcox, G. E. Cragg, A. L. Efros, T. D. Krauss, Nature 2015, 527, 544.
[59] P. Anger, P. Bharadwaj, L. Novotny, Phys. Rev. Lett. 2006, 96, 113002.
[60] P. Bharadwaj, L. Novotny, Nano Lett. 2011, 11, 2137.
[61] F. T. Rabouw, M. Kamp, R. J. A. van Dijk-Moes, D. R. Gamelin, A. F. Koenderink, A. Meijerink, D. Vanmaekelbergh, Nano Lett.
2015, 15, 7718.
[62] S. J. Lim, L. Ma, A. Schleife, A. M. Smith, Coord. Chem. Rev. 2016,
320–321, 216.
[63] M. Nirmal, B. O. Dabbousi, M. G. Bawendi, J. J. Macklin, J. K. Trautman, T. D. Harris, L. E. Brus, Nature 1996, 383, 802. [64] A. M. Munro, D. S. Ginger, Nano Lett. 2008, 8, 2585.
[65] B. Ji, E. Giovanelli, B. Habert, P. Spinicelli, M. Nasilowski, X. Xu, N. Lequeux, J.-P. Hugonin, F. Marquier, J.-J. Greffet, B. Dubertret,
Nat. Nanotechnol. 2015, 10, 170.
[66] O. Chen, J. Zhao, V. P. Chauhan, J. Cui, C. Wong, D. K. Harris, H. Wei, H. S. Han, D. Fukumura, R. K. Jain, M. G. Bawendi, Nat.
Mater. 2013, 12, 445.
[67] S. Hohng, T. Ha, J. Am. Chem. Soc. 2004, 126, 1324.
[68] M. D. Peterson, L. C. Cass, R. D. Harris, K. Edme, K. Sung, E. A. Weiss, Annu. Rev. Phys. Chem. 2014, 65, 317.
[69] W. Qin, R. A. Shah, P. Guyot-Sionnest, ACS Nano 2012, 6, 912. [70] S. J. Hurst, A. K. R. Lytton-Jean, C. A. Mirkin, Anal. Chem. 2006,
78, 8313.
[71] Q. Ruan, L. Shao, Y. Shu, J. Wang, H. Wu, Adv. Opt. Mater. 2014,
2, 65.
[72] J. H. Yoon, F. Selbach, L. Langolf, S. Schlücker, Small 2018, 14, 1702754.