ADAPTIVE VALUE NETWORKS
Convergence of Emerging Tools, Technologies and Standards as
Catalytic Drivers
*Shoumen Datta1, Bob Betts2, Mark Dinning3, Feryal Erhun4, Tom Gibbs5,
Pinar Keskinocak6, Hui Li1, Mike Li1, Micah Samuels7
Massachusetts Institute of Technology1, Timogen Inc.2, Dell Corporation3, Stanford University4, Intel Corporation5, Georgia Institute of Technology6, Amazon.com7
Abstract: If a typhoon in the South China Sea impacts the shipment and delivery of memory chips to an assembly plant in Mexico City, you can count on the ripple effect to impact financial service providers, manufacturers and suppliers, shippers in charge of logistics and of course, the end-consumer. Can we plan to reduce the risk arising from such uncertainties? Can businesses (semiconductor plants, banks, logistics providers) cooperate to minimize uncertainties? Conventional wisdom states that uncertainties are equivalent to accidents and hence by nature remain unpredictable. However, application of tools and technologies based on emerging standards may partially disprove such wisdom. Focus on demand management may be the guiding light for supply chain practitioners. Can we collapse information asymmetries (between manufacturers and their lending institutions, for example) and add far more value to networks or demand webs? Real-time operational adaptability is key, especially in fast ‘clockspeed’ industries. Confluence of emerging tools, technologies and standards are required to converge to catalyze the evolution of such adaptable enterprise. Can real-time distributed data, in-network processing, Agent-based autonomy, taken together, tame the Bullwhip Effect? Can the (semantic) web catalyze the “Nash Equilibrium” of people (games) and information (theory) in our quest for real time "predictive" decision support systems? We will explore a few of these issues and how they may coalesce to enable the adaptive value network of the future.
Key words: Adaptive value networks, Game theory, Bullwhip effect, Agent, Automatic Identification Technologies
New technologies for supply chain management and flexible manufacturing imply that businesses can perceive imbalances in inventories at an early stage — virtually in real time — and can cut production promptly in response to the developing signs of unintended inventory build up.
Alan Greenspan
Testimony to the U.S. Senate Committee on Banking, Housing and Urban Affairs (13 February 2001)
*Disclaimer: This article is an over-simplified and incomplete exploration of a few tools and technologies that may converge to influence decision support systems in a manner that may catalyze the transformation of current-day supply chains toward an adaptive value network. In addition to named contributions, the corresponding author has used several sources of information in an effort to ‘connect the dots’ to suggest how apparently distant disciplines, if coalesced, may be complementary. Although the list of references is seriously incomplete, it should be amply clear that the original research is not due to the corresponding author. However, quotes, opinions, comments expressed in this article are solely attributable to the corresponding author and do not represent the views of MIT as an institution or the co-authors or their institutions or organizations. Some terms, for example, information asymmetry, may be used in a generic sense to imply lack of information or information visibility. This article is not an original research document but rather a synthesis of a few ideas, which, if taken together, may be catalytic in the transformation of supply chain management to become adaptive or perhaps even predictive. In this chapter we suggest that adaptive may morph into ‘predictive’ through a confluence of principles. We advocate inclusion of ARCH (autoregressive conditional heteroskedasticity) and GARCH (generalized ARCH) in the context of supply chains to model high frequency (volume) real-time data (from RFID tags) that may also exhibit volatility (http://pages.stern.nyu.edu/~rengle/). All errors of content or coherence are solely due to the corresponding author.
1.
INTRODUCTION
“At the science museum in Barcelona, I saw an exhibit that beautifully illustrated ‘chaos.’ A nonlinear version of a pendulum was set up so that a visitor could hold the bob and start out in a chosen position with a chosen velocity. One could then watch the subsequent motion, which was also recorded with a pen on a sheet of paper. The visitor was then invited to seize the bob again and try to imitate exactly the previous initial position and velocity. No matter how carefully it was done, the subsequent motion was quite different from what it was the first time. I asked the museum director what the two men were doing who were standing in a corner, watching us. He replied, “Oh, those are two Dutchmen waiting to take away the “chaos.” Apparently, the exhibit was about to be dismantled and taken to Amsterdam. I have wondered ever since whether the services of those two Dutchmen would not be in great demand across the globe, by organizations that wanted their chaos taken away.” (Gell-Mann 1994).
The holy grail of industry is to remove “chaos” from the supply chain in order to better adapt to demand fluctuations. Managing uncertainty is compounded by the increasing degree of information asymmetry1 between
the supply “chain” (value network2) partners (designers, suppliers,
distributors, retailers, consumers) who have different and often conflicting objectives, that threaten to create barriers on the road to adaptive business networks of the future (Heinrich and Betts, 2003).
Ampex pioneered the video recorder market in 1956. Each unit was priced at $50,000 and the only competitors, RCA and Toshiba, were way behind. Sony, JVC and Matsushita were mere observers. Masaru Ibuka, co-founder of Sony and Yuma Shiraishi at JVC, issued directives for their respective engineers to produce an unit that would cost $500, a mere 1% of Ampex’s price. In the 1980’s, video recorder sales went from $17 million to $2 billion at Sony, $2 million to $2 billion at JVC, $6 million to $3 billion at Matsushita and $296 million to $480 million at Ampex. Failure to adapt eclipsed Ampex. (Tellis and Golder, 1996).
One business objective of suppliers is to secure large volume purchase commitments (with delivery flexibility) from manufacturers. It conflicts with the manufacturer’s objective that must include rapid response to demand fluctuation yet the manufacturer must mass produce (to take advantage of economies of scale) yet production runs must adapt to fluctuations even though a certain run may have been planned based on demand forecast. Thus, manufacturers may need more or less raw materials and therefore seek flexibility in purchasing raw materials, which conflicts with the supplier’s objective. Manufacturer’s desire to run long production batches are in
conflict with the warehouse and distribution centers that aim to reduce inventory due to storage capacity constraints. The latter increases cost of transportation for all the players.
During 2000, supply chain related costs in USA alone exceeded $1 trillion (10% of GDP), which is close to the entire GDP of Russia, is more than the GDP of Canada or Spain or the combined GDP of all the 22 nations who are members of the League of Arab Nations. The combined GDP of all 22 Arab nations is less than that of Spain ( www.wrmea.com/archives/sept-oct02/0209044-2.html; www.bea.doc.gov; www.cia.gov). A mere 10% savings of supply chain costs in USA is nearly equal to the GDP of Ireland. Therefore, tools and processes that may reduce supply chain inefficiencies and help it better adapt to demand changes, are valuable. We will briefly explore some of the tools that may catalyze the adaptive value network.
Some emerging technologies may take leading catalytic roles but technology is not the solution. Ability to adapt supply chains will depend on continuous business process innovation led by management capable of envisioning use of technology as a tool to reduce (1) inefficiencies, (2) uncertainties and (3) information asymmetry within the value network. In essence, decision making processes should respond to (dynamic) information such that the system (enterprise) is able to rapidly adapt and/or respond.
One driver of this transformation (from ‘push’ based supply chain management to ‘pull’ based adaptive value networks) is the potential use of real-time information to catalyze or trigger autonomous decision steps capable of re-planning and execution. By some estimates, business in 2003 generated more than1 terabyte of data per second (excludes data gathered by automatic identification technologies). Is this equivalent to information? It is unlikely that this data, as is, can be considered as information. Even when we extract the information, will it offer a “transactional” value? The ability to extract intelligence from data to manage information may be the differentiator between companies who will profit from data (such as automatic identification or sensors) versus those who will not. Data that is stored in business systems (such as ERP) may suffer from problems that reduces the value of their information. ERP systems may also compromise the efficacy of dynamic data if the data feeds static systems unable to respond in near real-time. When such ERP data and/or information sources are used by strategic planners for forecasting and optimization, it leaves room for speculation about the validity of the outcome since the process may have been optimized, or forecast delivered, based on “noise” rather than robust dynamic data. Stemming from poor data quality and information asymmetry between supply chain partners, these errors (of optimization, forecasting) accumulate at successive stages of a supply chain and manifests
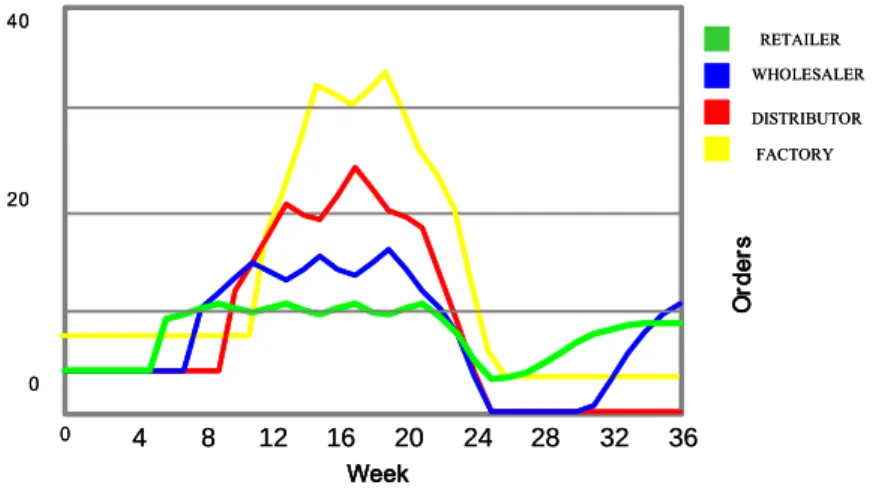
itself as the generic Bullwhip Effect (Forrester 1961, Sterman 1989, Lee et al., 1997) (Figure 1-1 and Figure 1-2).
40 20 0 0 4 8 12 16 20 24 28 32 36 Week O rder s DISTRIBUTOR WHOLESALER FACTORY RETAILER 40 20 0 0 4 8 12 16 20 24 28 32 36 Week O rder s DISTRIBUTOR WHOLESALER FACTORY RETAILER
Figure 1-1. The Bullwhip Effect (Source: Joshi 2000)
RET AILER 40 20 0 0 4 8 12 16 20 24 28 32 36 Week O rder s WHOLESALER DIST RIBUT OR FACT ORY RET AILER 40 20 0 0 4 8 12 16 20 24 28 32 36 Week O rder s WHOLESALER DIST RIBUT OR FACT ORY
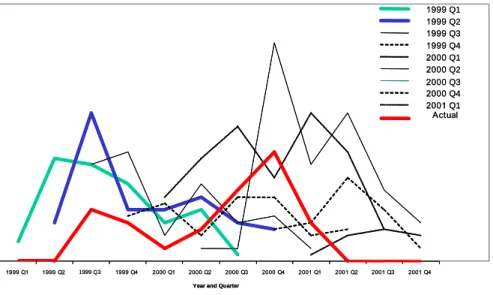
Example from the semiconductor equipment supply chain shows demand forecast versus actual purchase of equipment by Intel Corporation (Figure 1-3).
1999 Q1 1999 Q2 1999 Q3 1999 Q4 2000 Q1 2000 Q2 2000 Q3 2000 Q4 2001 Q1 2001 Q2 2001 Q3 2001 Q4
Year and Quarter
1999 Q1 1999 Q2 1999 Q3 1999 Q4 2000 Q1 2000 Q2 2000 Q3 2000 Q4 2001 Q1 Actual 1999 Q1 1999 Q2 1999 Q3 1999 Q4 2000 Q1 2000 Q2 2000 Q3 2000 Q4 2001 Q1 2001 Q2 2001 Q3 2001 Q4
Year and Quarter
1999 Q1 1999 Q2 1999 Q3 1999 Q4 2000 Q1 2000 Q2 2000 Q3 2000 Q4 2001 Q1 Actual
Figure 1-3. Intel Tool Order Data 1999-2001 (Source: Cohen, Ho, Ren and Terwiesch, 2003)
2.
TOWARD ADAPTIVE VALUE NETWORKS:
INFORMATION VISIBILITY (TRANSPARENCY)
Tools and technologies that may be catalytic in taming the Bullwhip Effect may also have an impact on making supply chains more adaptive by ushering in adaptive decision support systems. However, both assume the success of business process innovation to improve intra- and inter-enterprise information exchange as well as efforts to break down data silos as a segue to distributed data infrastructure. In thinking about adaptive supply chain management, it is helpful to analyze how the tools and technology catalysts may help connect objects to processes and processes to decision systems. Some of these “catalysts” may be classified into two broad (albeit arbitrary) categories. We will make an attempt to show how a few of these catalysts may (converge to) transform current supply chains to become more adaptive (Table 1-1).
Table1-1. Tools and Concepts versus Data Mobility
Tools and Concepts Data Mobility
Operations Research and Game Theory Automatic identification technologies (RFID, UWB, GPS)
Distributed Artificial Intelligence and Agents
Wireless protocols (802.11, 802.16) ‘Clockspeed’ as defined by Charles
Fine, MIT
Sensor networks Semantic Web
Simulation
3.
OPERATIONS RESEARCH AND GAME
THEORY
3The workhorse of optimization (algorithms) is based on operations research. It is an area of intense research and innumerable sources of information are available. However, Game Theory was not such a “household” name until 1994 when John Nash, and later the movie about him, changed the public’s perception so much so that generic business journals began touting the virtues of Game Theory.
Having game theory in your corporate ‘bag of tricks’ can mean the difference between success and failure. (Investor’s Business Daily, 25 January 1996).
Managers have much to learn from game theory - provided they use it to clarify their thinking, not as a substitute for business experience (The Economist, 15 June 1996).
Game theory helps us model, analyze and understand the behavior of multiple self-interested parties who interact while making decisions. As such, Game Theory deals with interactive optimization problems. In particular, it is a tool for analyzing situations where the parties strive to maximize their (expected) offs while choosing their strategies. Each party’s final pay-off depends on the profile of strategies chosen by all parties. Most business situations can be modeled by a “game” since in any business interaction, involving two or more parties, the pay-off of each party depends on the other party’s actions.
For centuries economists have worked on various game-theoretic models but Neumann and Morgenstern (1944) are credited as the fathers of modern Game Theory. Game Theory has since enjoyed an explosion of developments, including the concept of equilibrium (Nash, 1950), games
with imperfect information (Kuhn, 1953), cooperative games (Aumann, 1959; Shubik, 1962) and auctions (Vickrey, 1961).
3.1
Let the Game Begin
The overarching theme in Game Theory is “interactions.” In business, each decision maker is a player making a decision or choosing a strategy that will be impacted by the competitor.
“A chip manufacturer slashed prices of its desktop and mobile processors just days after a similar move by a rival. We’re going to do what it takes to stay competitive’ on prices, said representative. The companies aggressive price-chopping means the company doesn’t want to give up market share gains, even at the cost of losses on the bottom line (CNet News.com, May 30, 2002)”
In this example, companies compete on price to gain market share. During Q1 of 2002, this semiconductor company increased processor shipments (compared to Q4 of 2001) worth $8 million but processor revenue declined by 3% (sold more chips for less money). Companies engaged in price wars rarely, if ever, benefit from such competition. Reducing prices slightly might increase the overall market potential but decreasing prices beyond a certain limit has a diminishing impact. Eventually the size of the “pie” does not increase anymore and firms fight harder to get a bigger “pie” by slashing prices and profits. Why do firms behave this way? In this situation and in some others, firms are caught in what is known in Game Theory as the “Prisoner’s Dilemma” where the rational response may not be the optimal.
3.1.1 Prisoner’s Dilemma
Two burglars, Alice and Bob, are arrested near the scene of a burglary and interrogated separately. Each suspect can either confess with a hope of a lighter sentence or may refuse to talk (does not confess). The police do not have sufficient information to convict the suspects, unless at least one of them confesses. Each must choose without knowing what the other will do. In other words, each has to choose whether or not to confess and implicate the other. If neither confesses, then both will serve one year on a charge of carrying a concealed weapon (Table 1-2). If both confess and implicate each other, both will go to prison for 10 years. However, if one burglar confesses and implicates the other but the other burglar does not confess, then the one who cooperates with the police will go free, while the other burglar will go
to prison for 20 years on the maximum charge. The “strategy space” in this case is simple: confess or don't confess (each chooses one of the two strategies). The payoffs (penalties) are the sentences served. In effect, Alice chooses a column and Bob chooses a row.
Table 1-2.Prisoner’s Dilemma
Alice Alice Confess Does not Bob Confess 10, 10 0, 20 Bob Does not 20, 0 1, 1
The two numbers in each cell show the outcomes for the two prisoners when the corresponding pair of strategies are chosen. The number to the left shows the payoff to the person who chooses the rows (Bob) while the number to the right tells the payoff to the person who chooses the columns (Alice). Thus (reading down the first column) if they both confess, each gets 10 years, but if Alice confesses and Bob does not, Bob gets 20 and Alice goes free. Therefore, what strategies are "rational" in this game if both of them want to minimize their sentences? Alice might reason: "Two things can happen: Bob can confess or Bob can keep quiet. If Bob confesses, I get 20 years (if I don't confess) and 10 years if I do confess (cooperate), so in that case it is better to confess. On the other hand, if Bob doesn't confess and I don't either, I get a year but in that case, if I confess I can go free. Either way, it is better if I confess. Therefore, I will confess."
But Bob can and presumably will reason in the same way. So they both reason rationally to confess and go to prison for 10 years each. But, if they had acted "irrationally" and did not confess, they each could have gotten off with a year (http://william-king.www.drexel.edu/top/eco/game/ game.html).
Prisoner’s Dilemma4 is an example of a non-cooperative static game
where the players choose strategies simultaneously and are thereafter committed to their chosen strategies. The main issue of such games is the existence and uniqueness of Nash equilibrium (NE). NE is the point where no player has incentive to change her strategy since each player has chosen a strategy that maximizes his or her own payoff given the strategies of the other players. It may be prudent to point out that the fundamental distinction between cooperative and non-cooperative games is that cooperative games allow binding agreements while non-cooperative games do not. Study of cooperative games focuses on the outcome of the game in terms of the value
created through cooperation of players, but does not specify the actions that each player will take. The study of non-cooperative games is more concerned with the specific actions of the players. Hence the former allows us to model outcomes of more complex business processes.
3.1.2 Dilemma in Prisoner’s Dilemma
A key concept not captured in “Prisoner’s Dilemma” is the repetition of interactions. In business, most players know they will be in the “game” for awhile. Hence, they may choose to cooperate, especially if they deem that cooperation today may increase the chances of cooperation, or even collaboration, in the future. With repeated actions, companies build a reputation, which influences the actions of others. For example, a restaurant might make a higher profit today by selling slightly less fresh food (prepared yesterday), but will it be worth the possible consequence of losing customers in the future? Thus, rationally speaking, companies aim to act strategically with competitors and partners. In practice the behemoths continually try to squeeze their suppliers (blinded by “cost” reduction) and could lose critical partners.
Intel uses its much envied supplier ranking and rating program - which tracks a supplier’s total cost, availability, service, supports responsiveness and quality – to keep its top suppliers on a course for better quality. ‘We reward suppliers who have the best rankings and ratings with more business,’ says Keith Erickson, Director of Purchasing.
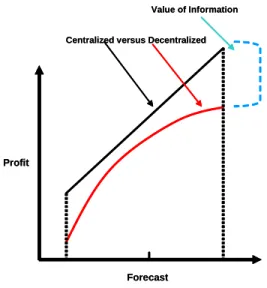
As an added incentive, Intel occasionally plugs high-quality suppliers in magazine and newspaper advertisements. The company even lets its top performing suppliers publicize their relationship with Intel. That’s a major marketing coup, considering that Intel supplies 80% of chips used in PCs today and is one of the most recognized brand names in the world. Given that each party in a supply chain acts entirely on self interest, individual choices collectively do not lead to an “optimal” outcome for the supply chain. Thus, supply chain profit of a “decentralized” supply chain composed of multiple, independently managed companies, is less than the total supply chain profit of the “centralized” version of the same chain where the partner interactions (suppliers, manufacturers, retailers) are managed by a single decision-maker (information symmetry) to optimize total supply chain profits. Sharing of information in centralized supply chains reduces inefficiencies that are obvious in decentralized supply chains due to “double marginalization” stemming from self-centered decision making.
3.1.3 Optimal Profit is Higher in Centralized Supply Chains with Information Sharing (Symmetry)
Forecast
Centralized versus Decentralized
Profit
Value of Information
Forecast
Centralized versus Decentralized
Profit
Value of Information
Figure 1-4.Optimal Profit versus Forecast (personal communication; Ozalp Ozer, Stanford University)
One strategy for reducing inefficiencies in decentralized supply chain (and consequent loss of profit) is “vertical integration” where a company owns every part of its supply chain. An example of vertical integration is Ford Motor Company. Earlier in the 20th century, in addition to automobile
factories, Henry Ford owned a steel mill, glass factory, rubber plantation and iron mines. Ford’s focus was on (mass production) making the same car, the Model T, cheaper. This approach initially worked well. The price of a Ford Model T fell from $825 in 1908 to $290 in 1924. By 1914, Ford had a 48% share of the US market. By 1920, Ford was manufacturing half the cars made worldwide. Vertical integration allows a company to obtain materials at a low cost and control the entire supply chain.
In today’s economy, customer demand and preferences change rapidly. Companies that focus on core competencies are more likely to be nimble in order to stay ahead of competition and succeed. Hence, we see a trend towards “virtual integration” where supply chains are composed of independently managed but tightly partnered companies. Information sharing and vendor managed inventory (VMI) are strategies successfully used by some companies (such as Dell Corporation) for higher degree of
virtual integration. However, most companies still find it difficult or face internal reluctance to usher changes in their supply chain practices. Similar issues apply to independently managed intra-company divisions, such as marketing, production, and sales.
Game Theory makes some assumptions in its study of the impact of interactions of multiple players and the resulting dynamics in a market environment. Two key assumptions are:
– Each player in the market acts on self-interest, but they pursue well-defined exogenous objectives, that is, they are rational;
– In choosing a strategy, a player considers the potential reaction of other players and takes into account his or her knowledge of other decision makers’ behavior, that is, he or she reasons strategically.
These assumptions rule out games of pure chance, such as lotteries and slot machines, where strategies do not matter and games without strategic interaction between players, such as Solitaire. Credibility is a central issue in games.
Coca-Cola is developing a vanilla-flavored version of its best-selling flagship cola, a report says, extending the company’s palette of flavorings from Cherry Coke and Diet Coke with lemon. But don’t expect to see a vanilla-flavored Pepsi anytime soon. ‘It’ s not something we’re looking at,’ said spokesman Larry Jabbonsky of Pepsi. ‘We think it’s a bit vanilla.’ (USA Today, 1 April 2002).
PepsiCo is launching Pepsi Vanilla and its diet version in stores across the country this weekend. Coke came out with Vanilla Coke in May 2002 and it was a resounding success, selling 90 million cases. ‘We’re a little surprised that Pepsi decided to enter the vanilla segment,’ said Mart Martin of Coca-Cola. ‘When we came out with Vanilla Coke, Pepsi originally said the idea sounded ‘a bit vanilla.’ (CNN/Money August 8, 2003).
3.2
Game Theory in Quantity and Price Competition
Business decisions include what to produce/procure, sell, how much, and at what price. Study of competitive interactions around these issues can be addressed using game theoretic models that focus on price and quantity decisions (several excellent papers including that of Albeniz and Simchi-Levi, 2003).
Quantity competition (Cournot Game) is especially important for commodities where there is an inverse relationship between quantity and market price. Price competition (Bertrand Game), on the other hand, occurs in every market, as competing companies try to maintain or increase market share.
OPEC decided to slash its crude oil production by 1.5 million barrels a day (6%). The issue came to a head this autumn with weakening world economy, together with the uncertainty caused by the Sep 11 attacks on the US, dragged down prices some 30%. The cut is expected to lift OPEC’s benchmark price to $22 a barrel, the group’s minimum target price (CBS News, December 28, 2001).
Burger King will put its Whopper on sale for 99 cents. The move is likely to intensify and prolong the burger price wars that have been roiling the US fast-food industry in recent months. Burger King Officials had said earlier they had little choice given a $1 menu at McDonald’s that included a Whopper-like hamburger called the Big ’N Tasty.” (Chicago Sun-Times, January 3, 2003).
Tesco announced plans to slash £80 million from prices of more than 1,000 products, with some prices falling by more than 30%. The cuts came as rival Asda also said it was slashing selected prices. The cuts echo memories of the supermarket price wars in 1999 as stores fought to capture more customers and increased market share (Sunday Telegraph, January 5, 2003).
Cournot Game
A market with two competing firms, selling homogeneous goods, where the two firms choose production quantities simultaneously, is known as a Cournot Game. It is a static game where the player’s action sets are continuous (each player can produce any non-negative quantity). This is a tacit collusion to raise prices to a jointly optimal level and thus is a “cartel.” A cartel is defined as a combination of producers of any product joined together to control its production, sale and price, so as to obtain a monopoly and restrict competition in any particular industry or commodity (www.legal-database.com). Cartels can be quite unstable. At each stage, the players have a huge incentive to cheat.
On Tuesday, 23 September 2003, an agreement was submitted to the US District Court in Philadelphia for an out-of-court settlement for a suit filed by industrial purchasers in 1999. According to this agreement, International Paper, Weyerhaeuser and Georgia-Pacific will pay US$68
million to avoid litigation related to class-action lawsuits that accused them of conspiring to fix prices for container-board (packaging material).
The oil market is notoriously difficult to balance - demonstrated by the rollercoaster of prices over the last few years. Member states of OPEC do not have identical interests and find it difficult to reach consensus on strategy. Countries with relatively small oil reserves are often seen as ‘hawks’ pushing for higher prices. Meanwhile, producers with massive reserves and small populations fear that high prices will accelerate technological change and the development of new deposits, reducing the value of their oil in the ground (BBC News, February 12, 2003).
Bertrand Game
Models situations where firms choose prices rather than quantities. Assume two firms produce identical goods which are perfect substitutes from the consumers’ perspective (consumers will buy from the producer who charges the lowest price). If the firms charge the same price, they will split the market evenly. There are no fixed costs of production and the marginal costs are constant. As in the Cournot Game, the firms act simultaneously. Therefore, when the costs and the products are identical, there exists a unique equilibrium in which all output is sold at the price equal to the marginal cost. Thus, the Bertrand Game suggests that when firms compete on price, and the costs are symmetric, we obtain a perfectly competitive market even in a duopoly situation. However, in real life, customers do not choose based on price alone. For example, Wendy’s fast food chain decided to stay out of the Burger King and McDonald’s price war (for a while) by aiming to gain market share by offering high quality food.
Stackelberg Game
In most business situations, firms choose their actions sequentially rather than simultaneously. In price wars, one firm responds after it observes another firm’s actions. For our discussion, consider that firm 1 moves first and firm 2 responds. We call firm 1 the Stackelberg “leader,” and the “follower” is firm 2.
3.3
Game Theory in Inventory Optimization
In time-dependent multi-period games, the players’ payoff in each period depends on the actions in the previous, as well as, current periods. The payoff structure may not change from period to period (so called stationary payoffs). This resembles multi-period inventory models in which time periods are connected through the transfer of inventories and backlogs. Due
to this similarity, time-dependent games have applications in supply chain management, for example, Stochastic Games. (For detailed mathematical review, see Cachon and Netessine, 2003).
Stochastic Games may help in analyzing:
– two-echelon game with the wholesaler and retailer making stocking decisions;
– price and service competition;
– game with the retailer exerting sales effort and wholesaler stocking inventory and van;
– two-period game with capacity choice in 1st period and production decision under capacity constraint in 2nd period.
These games involve a sequence of decisions that are separated in time, but many supply chain models rely on continuous-time processes. Such applications of Differential Games are especially valuable in the area of dynamic pricing and in marketing-production games with manufacturer and distributor.
Biform Games have been successfully adopted in supply chain
management (Anupindi et al., 2001). Consider a game where multiple retailers stock at their own locations, as well as, at several centralized warehouses. In the first (non-cooperative) stage, retailers make stocking decisions. In the second (cooperative) stage, retailers observe demand and decide how much inventory to trans-ship (cross-dock) among locations to better match supply and demand and how to appropriate the resulting additional profits. Variations on this theme are:
– allow retailers to hold back residual inventory. This model has three stages: inventory procurement, decision about how much inventory to share with others and, finally, the trans-shipment stage;
– option of pooling their capacity and investments to maximize the total value. In the first stage, firms choose investment into effort that affects market size. In the second stage, firms bargain over division of market and profits.
3.4
Game Theory in Contracts (Revenue Sharing)
This model is motivated by revenue sharing contracts implemented in practice. Blockbuster purchases movies from studios (suppliers) and rents them to customers. The supplier’s wholesale price impacts how many videos Blockbuster orders and hence, how many units are available for rent. Before 1998, purchase price of a video tape from the studio was around $65. Given that video rental fees are $3-$4 per tape, Blockbuster could purchase only a
limited number of videos and suffered lost demand during the initial release period (peak demand <10 weeks). About 20% of customers could not find the desired tape to rent. The studio’s high wholesale price impacted on the quantity purchased by Blockbuster and in turn, revenues and profitability of both firms. Thus, Blockbuster and the studios crafted a revenue sharing agreement such that Blockbuster pays only $8 per tape initially but then gives a portion (30 to 45%) of rental revenues to the studio (supplier). Since this agreement reduced Blockbuster’s initial investment, it could order more tapes to meet peak demand and generate more revenues even with contracted revenue sharing with the studio (supplier). Blockbuster increased its overall market share from 25% to 31% and improved its cash flow by 61% (CNet News.com, October 18, 2000).
3.5
Games with Incomplete Information (Game Theory
and Information Asymmetry)
Ubiquitous knowledge about players and decisions or payoffs is rarely a reality in real world supply chains. It is common that one firm may have a better demand forecast than another or a firm may possess superior information regarding its own costs and operating procedures. If a firm knows that another firm may have better information, it may choose actions that take this into account. Game Theory provides tools to study cases with information asymmetry with increasing analytical complexity.
Signaling Game
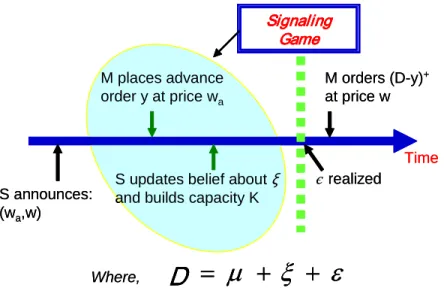
In its simplest form, a Signaling Game has two players, one of which has better information than the other. The player with the better information makes the first move. For example, a supplier must build capacity for a key component for a manufacturer’s product. The manufacturer has a better demand forecast than the supplier. In an ideal world, the manufacturer may truthfully share his or her demand forecast with the supplier so that the supplier could build the appropriate capacity. But the manufacturer benefits from a larger capacity at the supplier in case of higher demand. Hence, the manufacturer has an incentive to inflate his or her forecast. However, the supplier will bear the cost of building capacity if it believes the manufacturer’s (inflated) forecast. The manufacturer hopes the supplier believes the (inflated) forecast and builds capacity. Fortunately, the supplier is aware of the manufacturer’s “game” to inflate (distort) forecast. What move (signal) from the manufacturer may induce the supplier to believe the forecast is credible? Consider the example below (from Ozalp Ozer of Stanford University).
S announces: (wa,w)
Time
є realized
S updates belief about ξ
and builds capacity K M places advance order y at price wa M orders (D-y)+ at price w Signaling Game
ε
ξ
μ
+
+
=
D
Where, S announces: (wa,w) Time є realizedS updates belief about ξ
and builds capacity K M places advance order y at price wa M orders (D-y)+ at price w Signaling Game
ε
ξ
μ
+
+
=
D
=
μ
+
ξ
+
ε
D
Where,Figure 1-5. Signaling Game
In its simplest form, in this example, Demand (D) is represented as a sum of three forecasts (Figure 1-5). A market forecast mu (μ) is common information and published by commercial analysts. The manufacturer has sources and/or experience to derive private forecast information xi (ξ ) which is unknown to the supplier in a decentralized system (information asymmetry). However, the supplier can categorize the manufacturer into certain “types” based on prior actions or credibility of the manufacturer. Thus, the supplier updates its “belief” about the “type” of the manufacturer’s forecast information and may select some value of ξ that is spread over a distribution (function). This introduces a random variable. The general market uncertainty is given by epsilon (ε) and neither the manufacturer nor the supplier can control its value, although using appropriate tools, a closer to reality approximation of ε is possible. This introduces another random variable which is also spread over a distribution (function).
The Signaling Game, shown here, commences with a price announcement by the supplier: w (regular) and wa (advance purchase) price.
The manufacturer creates a demand (D) forecast and based on the strength of forecast, reacts to the supplier’s price package by placing an advanced order (y) to be purchased at wa. The volume of y sends a “signal” to the supplier.
The “signal” is used to update the supplier’s “belief” about the credibility of manufacturer’s forecast (D). Based on this, the supplier can determine how much capacity to build (K) to optimize his or her profits (inventory risk). Down the timeline, the market uncertainty is realized and using this value of ε the manufacturer may update its forecast. The volume of the D minus y is
the remaining volume the manufacturer orders from the supplier at a price w. While optimization based on Signaling Games may increase profits for manufacturer and supplier, it will still remain vulnerable to the value chosen for the variables ξ and ε. But, this may be further reduced using near real-time data (from automatic identification technologies, as we shall discuss in a later section), which offers greater adaptability to demand.
If signaling favors optimization of the supplier’s capacity planning, then what is the manufacturer’s incentive to signal? Does the manufacturer incur a cost to signal? Is the manufacturer’s expected profit in the signaling equilibrium lower than what it would be if the manufacturer’s type were known to the supplier to update his or her “belief” with certainty?
An ideal action for a high demand manufacturer is one that sends the signal of his or her high demand forecast at no cost. If a costless signal does not exist, then the goal is to seek the lowest cost to signal. Whether or not a costless signal exists depends upon what commitments the manufacturer can impose on the supplier. Suppose the manufacturer dictates (contractually) to the supplier a particular capacity level and the supplier accepts the terms. By accepting the contract, the supplier has essentially no choice but to build that level of capacity (severe penalty for non-compliance). This is referred to as “forced compliance” and in this case many costless signals exist for the manufacturer. However, if the supplier could potentially deviate without penalty, referred to as voluntary compliance, then the manufacturer’s signaling task becomes more complex. One solution for a high demand manufacturer is to give a sufficiently large advance payment to the supplier. Since the high demand manufacturer’s profit is higher than the low demand manufacturer’s profit, only a high demand manufacturer could offer such an advance payment. This is referred to as signaling by “burning money” (who can afford to burn money?). A better signal is a contract that is costless to a high demand manufacturer, but expensive to a low demand manufacturer. An example of such a signal is a minimum commitment. The latter is costly only if realized demand is lower than the commitment and the manufacturer is forced by contract to purchase excess inventory. That scenario is less likely for a high demand manufacturer but a minimum commitment may be costly for a low demand manufacturer. Should a manufacturer agree to a minimum commitment if it possesses perfect information? Likely, because these contracts could be used solely for the purpose of signaling information.
Screening Game
In this game the player who lacks information makes the first move. For example, a supplier offers a menu of contracts with the intention of getting the manufacturer to reveal his or her type via the contract selected (in
economics this is referred to as mechanism design). The supplier is in charge of designing a mechanism to extrapolate the manufacturer’s information.
The space of potential contract menus may be large. How many contracts should be offered and what form should they take? Furthermore, for any given menu, the supplier needs to infer for each manufacturer type which contract that manufacturer will choose. The revelation principle begins with the presumption that a set of optimal mechanisms exists. Associated with each of these mechanisms is a Nash Equilibrium (NE) that specifies which contract each manufacturer type chooses and the supplier’s action given the chosen contract. (NE is the point where no player has incentive to change her strategy since each player has chosen a strategy that maximizes her own payoff given the strategies of the other players.) However, it is possible that some manufacturer type chooses a contract that is not designated for that type. For example, a high demand manufacturer chooses an option that the supplier had designed for the low demand manufacturer. Therefore, even though this game does not seem desirable, it is possible that this mechanism is still optimal in the sense that the supplier may not be able to do better on average because the supplier ultimately only cares about optimizing expected profit (not the means by which that profit is achieved). Auction design in the context of supplier procurement contracts and inventory contract design are two of the potential applications of the revelation principle in supply chain management.
Even though an optimal mechanism may exist for the supplier, this does not mean that the supplier earns as much profit as he or she would if he or she knew the manufacturer’s type. The gap between what a manufacturer earns with the menu of contracts and what the same manufacturer would earn if the supplier knew her type is called an information rent. The separation of manufacturer types goes hand in hand with a positive information rent, that is, a manufacturer’s private information allows the manufacturer to keep some rent that the manufacturer would not be able to keep if the supplier knew his or her type. Hence, even though there may not be any cost involved in information revelation with a Signaling Game, the same is not true with a Screening Game.
Bayesian Games
With a Signaling or Screening Game, actions occur sequentially, such that information may be revealed through observation of actions. There also exist games with private information that do not involve signaling or screening. Consider that a single supplier has a finite amount of capacity. There are multiple retailers and each knows his or her demand, but not the demand of other retailers. The supplier announces an allocation rule, the retailers submit their orders. Then, the supplier produces and allocates units.
If the retailer’s total order is less than the supplier’s capacity, then each retailer receives his or her entire order. If the retailer’s total order exceeds the supplier’s capacity, the supplier’s allocation rule is implemented to allocate the capacity. To what extent does the supplier’s allocation rule influence the supplier’s profit, retailer’s profit and the supply chain profit? In this setting the firms (retailers) that have the private information choose their actions simultaneously (no information exchange among retailers). If the supplier’s capacity is fixed before the game starts, the supplier is unable to use any information from retailers (demand) to adapt capacity planning. However, it is possible that correlation exists in the retailers demand information, that is, if a retailer observes his or her demand type to be high, then he or she might assess that other retailers may have high demand types as well (if there is a positive correlation). Thus, each player uses Bayes’ rule to update his or her belief regarding the types of the other players in a Bayesian Game. Bayesian Equilibrium is a set of strategies for each type that is optimal given the updated beliefs with that type and the actions of all other types. If a player deceptively inflates demand (high type) and other players use this information to update their “beliefs” then this effect may contribute to the observed Bullwhip Effect.
3.6
Temporary Conclusion
God definitely plays dice! Combined GT/OR may offer approaches to use (data) dynamic information for continuous optimization in terms of location and real-time availability (improve from visibility to transparency, among players) as a step toward an adaptive value network.
4.
AGENTS
Linearization of real world conditions to fit mathematical models, such as Game Theory, may stifle real-time adaptability of value networks. As an example (see preceding section), a Bayesian Game potentially could contribute to the Bullwhip Effect representing wide fluctuations in supply chain. The discrete, dynamic and distributed nature of data and applications require that supply chain solutions do not merely respond to requests for information but anticipate, adapt and (support users to) predict. In that vein, ‘intelligent’ autonomous Agents are an essential tool for adaptive value networks to emerge.
The idea of Agent originated with John McCarthy in the 1950’s at MIT. The term “Agent” was coined by Oliver Selfridge, a colleague of McCarthy’s at MIT. Recent trends, beginning 1977, in Agent systems are
based on research in distributed artificial intelligence. Research from MIT, DARPA, Carnegie-Mellon University and University of Michigan at Ann Arbor has made significant contributions.
We define an autonomous Agent as a software entity that functions continuously in an environment, often inhabited by other Agents. Continuity and autonomy empower Agents to (plan) execute processes in response to changes in the environment without requiring constant human guidance, intervention or top-down control from a system operator. Thus, Agents offer the ability to rapidly adapt. An Agent that functions continuously in an environment over a period of time also learns from experience (patterns). In addition, Agents that inhabit an environment with other Agents in a Multi-Agent System (MAS) are able to communicate, cooperate and are mobile between environments. Agents work best for clearly discernible tasks or processes, such as, to monitor data from, for example, automatic identification technologies (radio frequency identification or RFID), ultrawideband (UWB) transponders, global positioning system (GPS), WiFi and sensors. Data Agents can share this data with high level Information Agents and offer real-time information to Process Agents (Inventory Agent, Purchasing Agent). The emergence of Multi-Agent Systems (MAS) may be slow to take-off unless the Semantic Web sufficiently permeates the environment for ubiquitous deployment of Agents.
Design of Agent-Based Modeling (ABM) draws clues from natural behavior of biological communities. Although it still remains a paradox, it is increasingly undeniable that simple individual behaviors of bugs like ants and wasps, collectively, may offer intelligent models of complicated overall behavior. In fact, this may have been known for centuries. One ancient observer, King Solomon, knew from his father, David, of the elaborate court organizations of oriental kings and preparations needed for military campaigns. He marveled that insects could accomplish both these tasks without any central control. Thinking of the complex systems needed to maintain the palace commissary, he wrote, “Go to the ant, consider her ways and be wise. Having no guide, overseer or ruler, she prepares her bread in summer and gathers her food at harvest time.” He knew the complexity of a military organization and was impressed that “locusts have no king, yet all of them go forth by companies.” Nearly 3000 years later, a participant in the NCMS Virtual Enterprise Workshop (1994) commented, “we used to think that bugs were the problem. Now we suspect they may be the solution!” (Parunak 1997)
Adaptability in biological systems is a fundamental characteristic of nature, and thus, models based on and inspired by such superior systems can contribute significantly to reduce key inefficiencies (and stem the loss of profit) between centralized and decentralized supply chains. Most software
is based on equations that link rates and flows (consumption, production). Variables (cost, rebates, transportation time, and out-of-stock) evaluate or integrate sets of ordinary differential equations (ODE) or partial differential equations (PDE) relating these variables. Operations research provides the framework to optimize for the “best” result. What if the “best” result is not necessarily the optimal “best” for that situation? Shortest lead time could plan a route through an area with a high probability of flash flood due to a brewing storm or threat of sniper attack on a portion of the highway. Planning software (today) fails to, or is incapable of, modeling such random events that may have profound implications for business, at that time. Thus, the “best” solution may not be adaptive to supply chain events at hand.
Even excluding random events or decisions that require integration with other models (weather, road construction), what is the half-life of ‘best’ solution in a fickle economy or high “clockspeed” industry? Compared to ABMs, a significant shortcoming of such Equation-based (ODE, PDE) models (EBM) is that EBM based software processes assume that these parameters are linear in nature and relevant data is available (for optimization). In the real world, events are non-linear, actions are discrete, information about data is distributed (CRM, PLM, SCM data silos) and data is corrupted with “noise” (according to a study by Ananth Raman of Harvard Business School and Nicole DeHoratius of the University of Chicago, for a global retailer, in some cases, 65% of SKUs (bar coded) were found to be inaccurately represented between system data, back-store and availability on store shelf, see Dehoratius, 2002).
Virtually all computer-based modeling, up to this point has used system dynamics, an EBM approach. But the struggle to adapt and respond in real-time will eventually and collectively fuel a paradigm shift that will make it imperative to model business software based both with Agents and equations. The question is no longer whether to select one or the other approach, but to establish a business-wise mix of both and develop criteria for selecting composition of software-based on one or the other approach that can offer valuable combinatorial solutions. The “balance” is subject to dynamic change (seek analogy with Screening Games). For traditionalists in supply chain management, the situation is analogous to a “push-pull” strategy where the dynamic push-pull boundary shifts with changing demand (pull).
ABM and EBM, both simulate the system by constructing a model and executing it on a computer. The differences are in the form of the model and how it is executed. In ABM, the model consists of a set of Agents that encapsulate the behaviors of the various individuals that make up the system, and execution consists of emulating these behaviors, which is essentially dynamic. In Equation-Based Modeling (EBM), the model is a set of
equations (pre-determined, static) and execution consists of evaluating them. Thus “simulation” is a generic term that applies to both methods, which are distinguished as Agent-based emulation and equation-based evaluation.
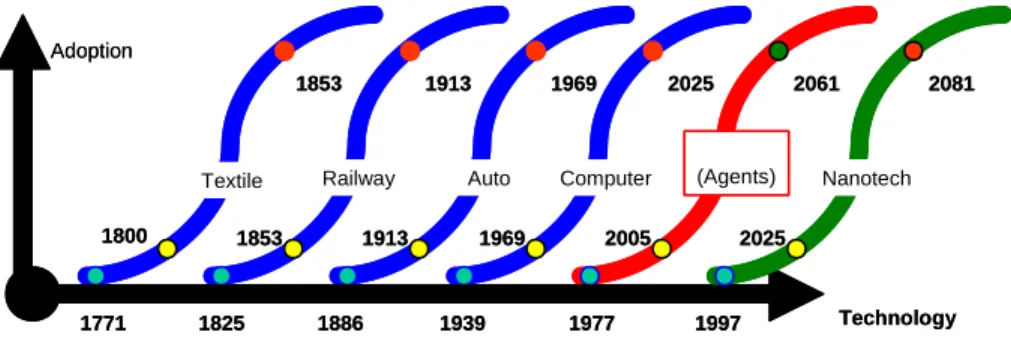
Thus, the need for supply chains to be adaptive should rapidly trigger demand for Agent integration with existing EBM systems. But the demand for Agents software is slow to materialize. One reason may be gleaned from the observation by Norman Poire, an economist (Figure 1-6, blue lines,
http://www.smalltimes.com/document_display.cfm?document_id=2141). As shown in figure 1-6, it takes about a quarter of a century for a technology to gain acceptance. Then it fuels a period of rapid growth lasting an additional half a century. Almost after a century since “invention” or introduction, the innovation may become a commodity and grows in line with fluctuations in macroeconomic forces. We propose that Agents, in principle linked to some of the fundamentals from distributed artificial intelligence (DAI), may follow a similar trajectory which suggests increasing adoption beginning about 2005 (Figure 1-6, red line). These Agents are the types that are capable of machine learning and utilize learning algorithms, such as (ant-based) swarm intelligence, genetic algorithms, and neural networks (single and multilayer perceptions, Hopfield networks, Kohonen networks, radial basis function networks).
1771 1825 1886 1939 1977 1997
1800 1853 1913 1969 2005 2025
Technology
1853 1913 1969 2025 2061 2081
Textile Railway Auto Computer (Agents) Nanotech Adoption
1771 1825 1886 1939 1977 1997
1800 1853 1913 1969 2005 2025
Technology
1853 1913 1969 2025 2061 2081
Textile Railway Auto Computer (Agents) Nanotech Adoption
Figure 1-6. How Conceptual Advances Lead to the Wealth of Nations
Continuity and autonomy of biology offer behavior patterns that are flexible, adaptive and responsive to change. Thus, the mobile, networked, autonomous, self-learning, adaptive Agent may have different principles compared to those that were developed for monolithic systems. Examination of naturally occurring Agent-based systems suggests design principles for Agents. While some circumstances may warrant deliberate exceptions, in general, Agents are aligned with the concepts listed below from Parunak (1997) and Parunak et al., (1998):
1. Agents should correspond to “things” in the problem domain rather than to abstract functions;
2. Agents should be small in mass, time (able to forget), and scope (avoid global knowledge action);
3. Multi-Agent Systems should be decentralized (no single point of control/failure);
4. Agents should be neither homogeneous nor incompatible but diverse; 5. Agent communities should include a dissipative mechanism (entropy
leak);
6. Agents should have ways of caching and sharing what they learn about their environment;
7. Agents should plan and execute concurrently rather than sequentially.
4.1
Agents versus Equations: Conceptual and Practical
Considerations
The difference in representational focus between ABM and EBM has consequences for how models are modularized. EBM represents the system as a set of equations that relate observables to one another. The basic unit of the model, the equation, typically relates observables whose values are affected by the actions of multiple individuals. ABM represents the internal behavior of each individual. An Agent’s behavior may depend on observables generated by other (Agents) individuals, but does not directly
access the representation of those individual behaviors, thus, maintains
boundaries among individuals. This fundamental difference in model structure gives ABM a key advantage in commercial applications such as an adaptable value network where partners may interact over an e-marketplace.
First, in an ABM, each firm has its own set of Agents. An Agent’s internal behaviors are not required to be visible to the rest of the system, so firms can maintain proprietary information about their internal operations. Groups of firms can conduct joint modeling exercises (Public MarketPlaces) while keeping their individual Agents on their own computers, maintaining whatever controls are needed. Construction of EBM requires disclosure of the relationships that each firm maintains on observables so that the equations can be formulated and evaluated. Distributed execution of EBM is not impossible, but does not naturally respect commercially important boundaries (why the early wave of e-MarketPlaces failed to survive).
Second, in many cases, simulation of a system is part of a larger project whose desired outcome is a control scheme that more or less automatically regulates the behavior of the entire system. Agent systems may correspond 1-to-1 with the individuals (firms or divisions) in the system being modeled, and the behaviors are analogs of real behaviors. These characteristics make
Agents a natural locus for the application of adaptive techniques that can modify their behaviors as the Agents execute, so as to control the emergent behavior of the system. Migration from simulation model to adaptive control model is more straightforward in ABM than in EBM. One can imagine a member of adaptable business network using its simulation Agent as the basis for an automated control Agent that handles routine interactions with trading partners. It is unlikely that such a firm would submit aspects of its operation to an external “equation manager” that maintains specified relationships among observables from several firms.
EBM most naturally represents the process being analyzed as a set of flow rates and levels. ABM most naturally represents the process as a set of behaviors, which may include features difficult to represent as rates and levels, such as step-by-step processes and conditional decisions. ODEs are well-suited to represent purely physical processes. However, business processes are dominated by non-linear, discrete decision-making.
Both ABMs and EBMs can be validated at the system level by comparing model output with real system behavior. In addition, ABM’s can be validated at the individual level, since the behaviors encoded for each Agent can be compared with local observations on the actual behavior of the domain individuals. ABMs support direct experimentation. Managers playing ‘what-if’ games with the model can think directly in terms of business processes, rather than translate them into equations relating observables. A purpose of what-if experiments is to identify improved business practices that can be implemented. If the model is expressed and modified in terms of behaviors, implementation of its recommendations is a matter of transcribing the modified behaviors of Agents into task descriptions for the underlying physical entities in the real world.
In many domains, ABM gives more realistic results than EBM, for manageable levels of representational detail. The qualification about the level of detail is important. Since PDEs are computationally complete, in principle, one can construct a set of PDEs that completely mimics the behavior of any ABM (thus produce the same results). However, the PDE model may be much too complex for reasonable manipulation and comprehension (for example what we observe in repetitive Stochastic Games with incomplete information). EBMs (like system dynamics) based on simpler formalisms than PDEs may yield less realistic results regardless of the level of detail in the representation. For example, the dynamics of traffic networks achieved more realistic results from traffic models that emulate the behaviors of individual drivers and vehicles, compared with the previous generation of models that simulate traffic as flow of a fluid through a network. The latter example bears strong similarities to the flow-and-stock approach to supply chain simulation.
The disadvantages of EBM in this and other examples result largely from the use of averages of critical system variables over time and space. EBM assumes homogeneity among individuals but individuals in real systems are often highly heterogeneous. When the dynamics are non-linear, local variations from the averages can lead to significant deviations in overall system behavior (outcome). Refer back to the section on Game Theory and in light of ABM vs. EBM, re-consider the example of the Signaling Game: the choice of values (of ξ and ε from the distribution) can significantly impact capacity planning (inventory risk) and profit optimization (price risk). In such business applications, driven by “if-then” decisions, non-linearity is the rule. Because ABM’s are inherently local and can adapt to changes, it is beneficial to let each Agent monitor the value of system variables locally (for example, real-time data for ε, in the Signaling Game), without averaging over time and space.
Ant-based algorithms based on naturally occurring systems, enables the Agent to forget (ant pheromones evaporate and obsolete paths leading to depleted food sources disappear rather than misleading members of the colony). The mechanism of forgetting is an important supplement to the emphasis in conventional artificial intelligence (AI) systems on mechanisms for learning. In a discrete-event system, forgetting can be as complex as learning since both represent discrete state transitions. In a time-based system, forgetting can take place “automatically” through the attenuation of a state variable that is not explicitly reinforced. The Agents ability to “forget” is a boon to real-world adaptable business networks. EBM based demand forecasting generally uses a weighted-average of past consumption data. If there was a marked variation (for example, spike in sales, 20 weeks ago) the planning algorithm continues to consider that value because equation-based modeling cannot “forget” facts, although the weight will decrease successively in each planning cycle unless manual intervention or program insertion specifies a “forget” rule. The forecasting engine, therefore, may continue to reflect the effect in its subsequent forecast for weeks or months. Consider the cumulative error from such events, if aggregated over geographies prior to generating a global forecast that may guide procurement or production. Such events produce the Bullwhip Effect. Agents can improve forecasting and with real-time data, accuracy may be further enhanced. As a result, for example, the manufacturer may adjust production to manage inventory better and reduce waste. Reduced inventory decreases working capital charges which improves return on assets because manufacturing the cash cycle gets shorter.
In a traditional system, forecast determines production planning and subsequently, execution of the plan. Some manufacturers develop a schedule each night that optimizes manufacturing the next day, a process not much
different from grocery chains that order perishables the day before it is displayed in stores. Engineers in industries as diverse as auto, semiconductors, aerospace, and agricultural equipment will agree that a daily schedule is obsolete less than an hour after the day begins. But Agents seek to avoid the “plan then execute” mode of operation and instead responds dynamically to changes in the environment. In concurrent planning and execution, the actual time at which a job will execute may not be known until the job starts. The resource does not schedule a newly-arrived job at a fixed point in time but estimates probabilistically the job’s impact on its utilization over time, based on information from the customer about acceptable delivery times. The width of the window within which the job can be executed is incrementally reduced over time, as needed, to add other jobs (may be rated by priority, at that time) to the resource’s list of tasks. If the resource is heavily loaded, the jobs organize themselves into a linear sequence but if it is lightly loaded, the actual order in which jobs are executed is decided at the moment the resource becomes available, depending on the circumstances that exist at that time. Figure 1-7 shows simplified view of agent in system architecture.
A
A
A
A
A
A
A
A
A
A
ERP “Personal Assistant” Agents Agents as Intelligent Interface Managers Agent-to-Agent CommunicationAgents “behind the scenes” Inter-application Communication Semantic (SL) Tags
A
A
A
A
A
A
A
A
A
A
A
A
A
A
A
A
A
A
A
A
ERP “Personal Assistant” Agents Agents as Intelligent Interface Managers Agent-to-Agent CommunicationAgents “behind the scenes”
Inter-application Communication Semantic (SL) Tags
4.2
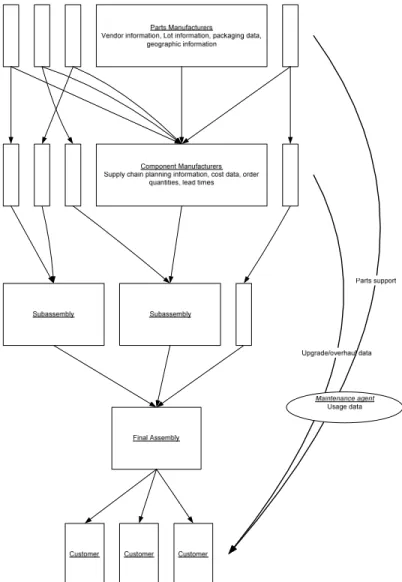
Agents in Maintenance (US Air Force Case Study)
This example of a multi-Agent framework (and this case study) was developed by Shehory, Sycara and Sukthankar in 1999 (Agent aided aircraft maintenance) at the Carnegie-Mellon University, Pittsburgh (Shehory et al., 1999). It provides information retrieval and analysis in support of decision making for aircraft maintenance and repair for the US Air Force (USAF). Although the solution was developed for a specific type of aircraft, the Agents and interactions were designed to apply to a range of similar maintenance scenarios.
Aircraft maintenance in the USAF is performed at different levels. Basic and intermediate levels are usually performed at the base where the aircraft is deployed, whereas periodic, comprehensive maintenance is performed at special depots. Initially, mechanics inspect the aircraft for discrepancies (and may also receive such information from pilots). For each discrepancy, the mechanic consults the technical manuals for a standard repair procedure. In case such a repair procedure is found and the resources (parts) are available, the mechanic proceeds with the repair. In cases where parts are not available or they are too expensive or require too much time and additional machinery for replacement or in cases where a procedure is not provided in the technical manual, a mechanic needs to consult an expert engineer. The engineer, in turn, may consult external sources of information. These include manuals, historical maintenance data and may even include consultation with experts.
Inventory of parts is based on traditional data input from goods received. Locating spares, therefore, could be a time consuming and arduous undertaking that can be automated to a significant extent by use of automatic identification technologies (UWB, RFID) and to link inventory object related data with service/maintenance processes to offer transparency of the spares supply chain.
Until recently, no automation was introduced to the consultation processes, either, of this information-rich environment. Hard-copy repair manuals are used by mechanics and engineers. Search for relevant information may be time consuming and incomplete. Historical data (records of previous similar repairs) is scarcely used, since it is stored in paper format with no search mechanisms and usually only kept for short periods (distributed along remotely located service centers). Expert engineers may be located remotely and their advice is available by voice or fax messages, usually delayed for hours or days. All of these factors contribute to a slow, inefficient maintenance that compromises readiness.
The inspection, consultation and repair process consists of the following steps:
1. Aircraft arrives at a maintenance center, either at its home base or depot (depending on the type of maintenance required). In both cases, the maintenance procedures must be completed within a limited time period. This period varies. Basic and intermediate maintenance must be completed within hours or a few days, whereas depot maintenance may be scheduled for several weeks (depends on aircraft).
2. Mechanics inspect the aircraft and locate discrepancies. For each discrepancy a mechanic performs the following:
a) browse the technical manual for repair procedures;
b) in case an appropriate procedure is located, mechanic needs to verify whether it can be completed given limitations on repair time and parts availability. Mechanic may also need to consider the price of repair. For example, the technical manual may require replacing a whole wing if a crack in the wing is greater than some given threshold. This may take too long and become too expensive thereby causing delay or compromise operational activity or readiness;
c) if the procedure found can be performed, the mechanic performs it. If not, mechanic proceeds to fill out form 202a, standard USAF form for reporting aircraft discrepancies and requesting advice. The mechanic may attach supporting information. The mechanic may consult Illustrated Part Breakdown (IPB) technical manuals and possibly other experienced mechanics. Form 202a is sent for advice and authorization for non-standard repair.
3. An engineer, upon receipt of a Form 202a, proceeds to:
a) use experience, historical repair information and manuals to design appropriate repair;
b) fill in a Form 202b, standard US Air Force form for discrepancy repair instructions. To this form the engineer may attach graphical illustration to clarify required repair procedure;
c) file 202a and 202b for future use as historical repair information.
4. When a standard repair procedure is found or on receipt of Form 202b from engineer, the mechanic performs the repair as instructed. The current inspection, consultation and repair processes, as described above, have several problems. The multi-Agent system (MAS) implementation reported here attempts to address these problems. The majority of the information, both historical repair information and technical manuals, is found in hard-copy format as well as hand-written pieces. Mechanics and engineers spend precious time on:
a) Browsing manuals and searching for historical repair information; b) Drawing graphical discrepancy and repair illustrations;
c) Mechanics are idle, waiting for Form 202b to arrive from engineers in reply to their Form 202a;