HAL Id: hal-02378506
https://hal.archives-ouvertes.fr/hal-02378506
Submitted on 25 Nov 2019HAL is a multi-disciplinary open access archive for the deposit and dissemination of sci-entific research documents, whether they are pub-lished or not. The documents may come from teaching and research institutions in France or abroad, or from public or private research centers.
L’archive ouverte pluridisciplinaire HAL, est destinée au dépôt et à la diffusion de documents scientifiques de niveau recherche, publiés ou non, émanant des établissements d’enseignement et de recherche français ou étrangers, des laboratoires publics ou privés.
Fine scale geographic residence and annual primary
production drive body condition of wild immature green
turtles (Chelonia mydas) in Martinique Island (Lesser
Antilles)
Marc Bonola, Marc Girondot, Jean-Patrice Robin, Jordan Martin, Flora
Siegwalt, Lorène Jeantet, Pierre Lelong, Clément Grand, Philippine
Chambault, Denis Etienne, et al.
To cite this version:
Marc Bonola, Marc Girondot, Jean-Patrice Robin, Jordan Martin, Flora Siegwalt, et al.. Fine scale geographic residence and annual primary production drive body condition of wild immature green turtles (Chelonia mydas) in Martinique Island (Lesser Antilles). Biology Open, Royal Society, 2019, 8 (12), pp.bio048058. �10.1242/bio.048058�. �hal-02378506�
© 2019. Published by The Company of Biologists Ltd.
This is an Open Access article distributed under the terms of the Creative Commons Attribution License (http://creativecommons.org/licenses/by/4.0), which permits unrestricted use, distribution and reproduction
in any medium provided that the original work is properly attributed.
Fine scale geographic residence and annual primary production drive body
condition of wild immature green turtles (Chelonia mydas) in Martinique Island
(Lesser Antilles)
Marc Bonola1, Marc Girondot2, Jean-Patrice Robin1, Jordan Martin1, Flora Siegwalt1, Lorène
Jeantet1, Pierre Lelong1, Clément Grand1, Philippine Chambault3, Denis Etienne4, Julie
Gresser4, Gaëlle Hielard5, Alexandre Arqué5, Sidney Régis1, Nicolas Lecerf1, Cédric Frouin1,
Fabien Lefebvre1, Emmanuel Sutter4, Fabien Vedie4, Cyrille Barnerias4, Laurent Thieulle1,
Robinson Bordes1, Christelle Guimera1, Nathalie Aubert1, Myriam Bouaziz1, Adrien Pinson6,
Frédéric Flora1, Matthieu Duru1, Abdelwahab Benhalilou7, Céline Murgale7, Thomas Maillet7,
Lucas Andreani7, Guilhem Campistron7, Maxym Sikora8, Fabian Rateau8, Francis George8,
Joffrey Eggenspieler8, Thierry Woignier9, Jean-Pierre Allenou10, Laurent Louis-Jean11,
Bénédicte Chanteur11, Christelle Béranger11, Jessica Crillon12, Aude Brador12, Caroline Habold1,
Yvon Le Maho1, Damien Chevallier1*
1 Université de Strasbourg, CNRS, IPHC UMR 7178, F‐67000 Strasbourg, France
2 Laboratoire Écologie, Systématique, Évolution, Université Paris-Sud, AgroParisTech, CNRS, Université
Paris Saclay, 91405 Orsay, France.
3UMR MARBEC, IFREMER, CNRS, IRD, University of Montpellier, Avenue Jean Monnet, 34200 Sète,
France.
4 DEAL Martinique, Pointe de Jaham, BP 7212, 97274 Schoelcher Cedex, France.
5 Office de l’Eau Martinique, 7 Avenue Condorcet, BP 32, 97201 Fort-de-France, Martinique, France. 6 Surfrider Foundation Europe Martinique, France.
7 Association POEMM, 73 lot papayers, Anse a l'âne, 97229 Les Trois Ilets, Martinique, France. 8 ONF International, 78 route de Moutte, 97207 Fort-de-France, France.
9 Aix Marseille University, University Avignon, CNRS, IRD, IMBE, Marseille, 13397, France. 10 IFREMER Délégation de Martinique, 79 Route de Pointe-Fort 97231 Le Robert, France. 11 PNR Martinique, avenue des caneficiers, 97200 Fort-de-France, France.
12 Parc Marin de Martinique, Agence Française pour la Biodiversité, avenue des caneficiers, 97200
Fort-de-France, France.
* Corresponding author
Biology Open • Accepted manuscript
by guest on November 25, 2019 http://bio.biologists.org/
Abstract
The change of animal biometrics (body mass and body size) can reveal important information about their living environment as well as determine the survival potential and reproductive success of individuals and thus the persistence of populations. However, weighing individuals like marine turtles in the field presents important logistical difficulties. In this context, estimating body mass based on body size is a crucial issue. Furthermore, the determinants of the variability of the parameters for this relationship can provide information about the quality of the environment and the manner in which individuals exploit the available resources. This is of particular importance in young individuals which growth quality might be a determinant of adult fitness.
Our study aimed to validate the use of different body measurements to estimate body mass, which can be difficult to obtain in the field, and explore the determinants of the relationship between body mass and size in juvenile green turtles. Juvenile green turtles were caught, measured, and weighed for six years (2011-2012; 2015-2018) at six bays in the west of Martinique Island (Lesser Antilles). Using different datasets from this global database, we were able to show that the body mass of individuals can be predicted from body measurements with an error of less than 2%. We built several dataset including different morphological and time-location information to test the accuracy of the mass prediction. We show a year and north-south pattern for the relationship between body mass and body measurements. The year effect for the relationship of body mass and size is strongly correlated with net primary production but not with sea surface temperature or cyclonic events. We also found that if the bay locations and year effects were removed from the analysis, the mass prediction degraded slightly but was still less than 3% on average. Further investigations of the feeding habitats in Martinique are still needed to better understand these effects and to link them with geographic and oceanographic conditions.
Keywords:
Green turtles, Juveniles, Body mass, Body condition, BiometryBiology Open • Accepted manuscript
by guest on November 25, 2019 http://bio.biologists.org/
1. Introduction
Animal physiological state is potentially related to evolutionary fitness. Health can be an indicator of past foraging success, fighting ability, and ability to cope with environmental pressures, any of which may ultimately impact reproductive success (Jakob et al., 1996). In the animal kingdom, the search for condition indices related to individual health and fitness has been a longstanding quest (Fulton, 1904; Le Cren, 1951; Stevenson and Woods, 2006). Indeed, body size is a structural characteristic that has a remarkable influence on fitness during life (Churchill et al., 2014; Damuth and MacFadden, 1990; Peters, 1983; Schmidt-Nielsen, 1984), especially on energy expenditure, reproduction behaviour, locomotion, and community structuration in relation to habitat (Cardillo et al., 2005; Fariña et al., 1998; Lindenfors et al., 2002; Nee et al., 1991; Schmidt-Nielsen, 1984; Tuomi, 1980; Van Valkenburgh, 1990). The evolution of body size can thus reveal important information about the in situ environment specific to each species and be decisive in terms of the survival potential and reproduction success of a population (Clutton-Brock, 1991; Gaillard et al., 2000).
The comparison of the growth rates of different species of marine turtles living at the same site reveals that immature green turtles (Chelonia mydas) grow slower than hawksbills (Eretmochelys imbricata) and loggerheads (Caretta caretta) of a similar size (Bjorndal and Bolten, 1988). Food consumption at the scale of a population or individuals, energy fluxes through trophic levels, and ultimately better understanding ecosystem functioning can be assessed using body mass growth analyses (Bjorndal and Bolten, 1988; Chaloupka and Musick, 1997; Price et al., 2004; Trites et al., 1997).
The relationship between body size and body mass has been established in many studies on different species raised in laboratory conditions or zoos or living in semi-free-ranging or natural environments (Smith and Jungers, 1997). Thus, precise estimations of body mass in relation to body size are, for example, available in insects (Rogers et al., 1977; Schoener, 1980), spiders (Brady and Noske, 2006; Sage, 1982), birds (Boos et al., 2000; Viblanc et al., 2012), marine mammals (Trites and Pauly, 1998), and fishes (Froese and Palmares, 2000; Kohler et al., 1995; Martin-Smith, 1996).
Biology Open • Accepted manuscript
by guest on November 25, 2019 http://bio.biologists.org/
Despite the fact that a precise estimation of body mass can be used to determine growth rate in marine turtles, only a few studies investigating the relationship between body size and body mass have been conducted to date. Studies of this relationship have been restricted to subadults and adults individuals in green turtle (Bjorndal and Bolten, 1988; Hays et al., 2002), hawksbill turtle (Santos et al., 2010), and leatherback (Dermochelys coriacea) (Georges and Fossette, 2006). Determining the relationship between body mass and body measurements, and more generally, studying their ecology and demographic evolution, is difficult for juvenile turtles due to their permanent life at sea at this stage (Bass and Witzell, 2000; Pelletier et al., 2003). Indeed, although capture-mark-recapture (CMR) is facilitated in adult females during the laying season (Casale et al., 2007), it is more complicated in immature individuals, because it requires to catch the animals directly at sea (Limpus and Chaloupka, 1997). Nevertheless, the Lesser Antilles Islands concentrate immature marine turtles and thus present the unique opportunity to study individuals at this early stage in life (Chambault et al., 2018). Indeed, in the seagrass meadow that develop on the coastal fringe of these islands, a significant number of individuals with particularly high site fidelity feed all year round. This fidelity to ecosystems rich in high-energy food resources facilitates CMR as well as the continuous observation of immature individuals. A previous study of immature green turtles showed that body mass can be predicted with high accuracy based on carapace length (Bjorndal and Bolten, 1988). Our study aimed to validate the use of different body measurements to estimate body mass, which can be difficult to obtain in the field, and explore the determinants of the relationship between body mass and size in juvenile green turtles. We established several predictive equations to estimate the body mass of immature green turtles according to different morphological measurements and study the ecological determinants of this relationship. The determinants of the relationship between body mass and size are then explored using several oceanographic and geographic proxies.
Biology Open • Accepted manuscript
by guest on November 25, 2019 http://bio.biologists.org/
2. Material and methods
2.1 Ethics statementThis study meets the legal requirements of the countries in which this work was carried out and follows all institutional guidelines. The protocol was approved by the “Conseil National de la Protection de la Nature” (CNPN, http://www.conservation-nature.fr/acteurs2.php?id=11), and the French Ministry for Ecology, Sustainable Development, and Energy (permit Number: 2013154-0037), which acts as an ethics committee in Martinique. After the evaluation of the project by the CNPN, fieldwork was conducted in strict accordance with the recommendations of the Police Prefecture of Martinique in order to minimise the disturbance to the animals (Authorisation n°201505-0002).
2.2 Animal capture
Turtles were captured in October 2011-2012 and 2015-2018 at Grande Anse d’Arlet, Anse du Bourg, Anse Dufour, Anse Noire, Le Carbet, and Le Prêcheur, all located in Martinique Island in the eastern Caribbean Sea (Fig. 1). The surface of these bays was estimated from satellite pictures using the surface from the shoreline to the straight line linking the two edges of the bays. Catches were performed between 8 am and 5 pm at a depth ranging from 2 m to 15 m. When turtles were static, i.e., resting or feeding (head down) at the bottom, they were caught by a free diver who discreetly dived close to the head of the turtle to avoid detection. Once close enough and above the animal, the free diver seized the nuchal and pygal areas of the shell. He then positioned the turtle against his chest, keeping its anterior flippers against his breastplate, and rose to the surface. A second free diver held the fore flippers and helped lift the turtle into a boat for body measurements and tagging.
2.3 Data collection
We recorded the date, hour, tag number, and place of capture for each turtle. The presence of a passive integrated transponder (PIT) was also recorded; in its absence, a PIT (ID-100, TROVAN®) was injected into the right triceps. The number was checked using a manual reader (GR250, TROVAN®). The health status of each animal was also recorded, particularly in the presence of a visible external tumour. Each animal was measured (see below) with a flexible measuring tape (±0.1 cm). Only two trained operators (MB & DC) measured the animals. Measurement differences were less than 1% for these two operators.
Biology Open • Accepted manuscript
by guest on November 25, 2019 http://bio.biologists.org/
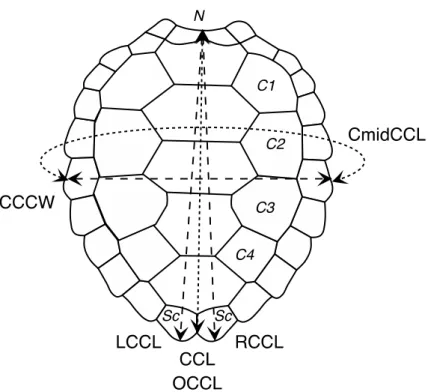
We measured curved carapace length (CCL, measured between nuchal and supracaudal scutes) and central curved carapace width (CCCW, measured between left and right costal scutes 2 and 3) (Bolten, 1999). Bjorndal and Bolten (1989) over-the-curve carapace length (OCCL) is equivalent to our CCL measurement (Fig. 2). In addition to these standard measurements, we also recorded the left (LCCL) and right curved carapace length (RCCL) from the mid-point of the nuchal scute to the left or right supracaudal scute. A comparison of CCL, RCCL, and LCCL allows measurement errors to be detected. However, because the marginal points of supracaudal scutes are susceptible to breakage and differential wear, CCL remains the most accurate measurement (Bjorndal and Bolten, 1989). For this reason, in our predictive models, we chose to use only CCL and so discarded LCCL and RCCL measurements. Circumference at mid-CCL (CmidCCL) was also recorded in approximately one-third of captures (Fig. 2). Finally, the body mass (BM) of individuals was recorded using an electronic crane scale (maximum mass 600 kg ± 0.1 kg, Kern, HUS600K Model) before their release at sea in the same location. About 10% of individuals were measured and weighed more than once during field work. The electronic crane scale was suspended from a beam. The turtles are put in a hammock (tared upstream). The heaviest turtles (close to 100 kg) were transported by three people until hammock.
Bjorndal and Bolten (1988) estimated BM juvenile green turtles in the Bahamas based on straight-line measurements. Bjorndal and Bolten (1989) also gave equations to convert over-the-curve into straight-line measurements for both the carapace length and width of juvenile green turtles. We used these equations to compare their estimates of BM with our own.
2.4 Statistical analyses
Statistical analyses were carried out using R software version 3.6.1 (R Core Team 2019). For this study, no wounded (fin cut) nor sick individuals (presence of fibropapilloma tumours) were integrated in the analysis.
To test the effect of some morphological and time-location parameters on the accuracy of the mass prediction, four different datasets were built:
(A) a dataset with BM, CCCW, CCL, CmidCCL, Year, Location, and Identity of animal; (B) a dataset with BM, CCCW, CCL, Year, Location, and Identity of animal;
(C) a dataset with BM, CCCW, CCL, and Identity of animal; (D) a dataset with BM and CCL.
Biology Open • Accepted manuscript
by guest on November 25, 2019 http://bio.biologists.org/
Dataset B allowed us to test the precision of the BM estimation without CmidCCL as it can be difficult to measure and was only recorded in one-third of captures. Dataset C was a minimal dataset in case of location and year would not be available. Finally, dataset D was used to compare our data with other published analyses for this species (Bjorndal and Bolten, 1988; Bjorndal and Bolten, 1989; Hays et al., 2002). For this former analysis, when an individual was measured and weighed on several occasions, only the first measure was used. Data were then analysed using a linear model without random individual effect so as to have similar conditions as previous studies. Only the individuals with a complete set of information within a dataset were retained for analyses. All measurements were log-transformed to limit the effect of heteroskedasticity. Year was always treated as a categorical variable.
About 10% of individuals were measured and weighed more than once during field work. A mixed model with individual as the random effect and Gaussian distribution for measurements was then chosen. Restricted maximum likelihood was used as a fit criterion to ensure unbiased variance. Model selection was performed using the conditional Akaike information criterion (cAIC). This measure of the quality of fit penalised by the number of parameters corrected (Burnham and Anderson, 2002) was specially developed for mixed
models(Greven and Kneib, 2010; Säfken et al., 2018). A backward model selection using cAIC
was used and then stopped when the most complex model was selected. Factors were removed one at a time. A parameter involved in an interaction was never removed from the analysis. Model selection was stopped when the most complex model was selected based on cAIC.
Quasi-variances (and corresponding quasi-standard errors) for estimated model coefficients relating to the levels of a categorical explanatory variable (years and locations) were estimated using the method of Firth and de Mezezes (2004) that is specifically adapted for generalised linear mixed models.
The equation of the percentage of errors for one individual is thus:
%𝑒𝑟𝑟𝑜𝑟 =|𝐵𝑀𝑐𝑎𝑙 − 𝐵𝑀𝑟𝑒𝑎𝑙|
𝐵𝑀𝑟𝑒𝑎𝑙 × 100
With BMcal being BM estimated using the selected model and BMreal being the BM determined by direct weighing.
Biology Open • Accepted manuscript
by guest on November 25, 2019 http://bio.biologists.org/
2.5 Physical ecosystem characteristics
To link year effect with physical oceanography, ocean net primary production (NPP), sea surface temperatures (SST), and wind speed (WS) were obtained from public databases for the location closest to the capture bays. NPP is commonly modelled as a function of chlorophyll concentration and is based on the original description of the vertically generalised production model (VGPM) (Behrenfeld and Falkowski, 1997), MODIS surface chlorophyll concentrations (Chlsat), MODIS 4-micron sea surface temperature data (SST4), and MODIS cloud-corrected incident daily photosynthetically active radiation (PAR). Euphotic depths were calculated from Chlsat following Morel and Berthon (1989). NPP was compiled from the Ocean Productivity website (http://www.science.oregonstate.edu). SST and WS were obtained from
the European Centre for Medium-Range Weather Forecasts database
(https://www.ecmwf.int). WS was calculated from the two orthogonal wind speed vectors u
and v using 𝑊𝑆 = √𝑢2+ 𝑣2.
3. Results
3.1 Body mass and body size of individuals
Overall, 323 different green turtles were captured for a total of 412 captures and recaptures (Table 1). A total of 258 individuals were captured only once, 48 twice, 12 three times, 3 four times, and 2 five times.
Standard body measurements ranged from 26.0 cm to 93.8 cm for CCL and from 22.5 cm to 84.3 cm for CCCW. The lightest turtle weighed 2.2 kg and the heaviest 98.8 kg. Circumference at mid-carapace length (CmidCCL) ranged from 46 cm to 159 cm.
3.2 Model for BM estimation with dataset A
A total of 181 captures are considered in dataset A as the circumference was only measured in 2016, 2017, and 2018. The selected model to explain BM included CCL, CCCW, CmidCCL, the interactions between CCL, CCCW, and CmidCCL as well as identity of animal, year, and location
(Table 2). Its probability to be the best modelamong those tested was 0.45 according to the
Akaike weight (Table 2). Let a turtle being measured and it weighted 50 kg. Based on its measurements, it would be predicted to weigh between 49.15 and 50.85 kg with maximum and minimum being 45.3 and 54.6 kg. With this model, the average error for BM prediction
Biology Open • Accepted manuscript
by guest on November 25, 2019 http://bio.biologists.org/
was 1.70% (range=0 % – 9.22%) (Table 3). Using this dataset, a significant effect for the location of the bay where the turtles were caught was observed. When the six bay locations were ordered from south to north, a clear pattern emerged: turtles were lighter relative to their size in the northern bays (w-value=0.94; not shown for dataset A; see results for dataset B and Fig. 3 for a similar effect). The w-value is the posterior probability that a model with a slope different from 0 is better than a model with a slope fixed to 0 based on the Bayesian information criterion (Girondot and Guillon, 2018).
3.3 Model for BM estimation with dataset B
A total of 350 captures from 2011 to 2018 (six years and six locations) constituted dataset B. The selected model included CCL, CCW, as well as identity of animal, year, and location. Its probability to be the best model among those tested was 0.51 according to the Akaike weight (Table 2). The second model without location effect had a support of 0.28. With the selected model, the average error for BM prediction was 2.47% (range 0% – 22.05%) (Table 3). Let a turtle being measured and it weighted 50 kg. Based on its measurements, it would be predicted to weigh between 48.7 kg and 51.2 kg with maximum and minimum being 38.97 and 61.0 kg. Using this dataset, we observed the same significant effect that the location of the bay where the turtles were caught in dataset A. When the bay locations were ordered from south to north, a clear pattern emerged: turtles were lighter relative to their size in the northern bays (linear model weighted by the inverse of quasi-standard error at each location, w-value=0.997; Fig. 3). An effect of year was also noticed, and turtles caught in 2011 and 2012 were significantly lighter relative to their size than those caught after 2014 (Fig. 4). This effect can also be seen in the pattern linking BM, CCL, and CCW according to the year of capture (Fig. 5).
3.4 Model for BM estimation with dataset C
In this dataset, we considered the same turtles as in dataset B, although the selected model only included CCL, CCCW, and identity of animal. Its probability to be the best model among those tested was close to 1 according to the Akaike weight (Table 2). With this model, the average error for BM prediction was 2.39% (range 0% – 19.64%) (Table 3). Let a turtle being measured and it weighted 50 kg. Based on its measurements, it would be predicted to weigh between 48.8 kg and 51.1 kg with maximum and minimum being 40.18 and 59.82 kg. Aside from the detection of significant year and location effects (see results for dataset A and B), the prediction of BM with or without these effects was similar.
Biology Open • Accepted manuscript
by guest on November 25, 2019 http://bio.biologists.org/
3.5 Model for BM estimation with dataset D
The selected model for dataset D included only CCL and CCCW (Table 2). With this model, the
average error for BM prediction was 7.09% (range 0% – 72.44%) (Table 3). Let a turtle being
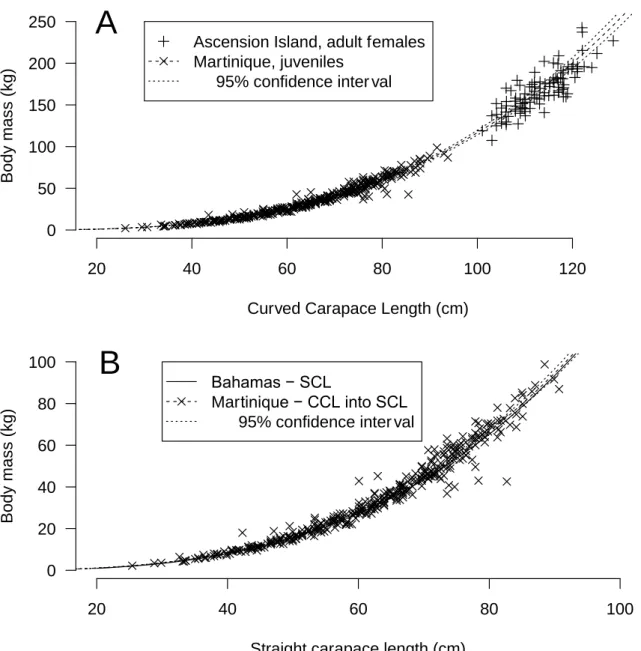
measured and it weighted 50 kg. Based on its measurements, it would be predicted to weigh between 46.4 kg and 53.5 kg with maximum and minimum being 13.7 and 86.2 kg. The confidence interval for the relationship between BM and CCL for young juveniles in Martinique was compatible with the one observed for adults in Ascension Island (Hays et al., 2002) (Fig. 6A). Similarly, the fitted relationship between BM and SCL for juvenile green turtles in the Bahamas (Bjorndal and Bolten, 1988; Bjorndal and Bolten, 1989) was within the confidence interval for the relationship between BM and CCL for young juveniles in Martinique (Fig. 6B). However, let us recall that a significant effect of year and location was observed in our datasets. Thus, even if the relationships were similar, they could be better with these factors included in the analysis.
3.6 Physical ecosystem characteristics
Monthly NPP and SST as well as 12 h WS are shown in Figure 7. Correlations between effect for log BM vs. log CCL and CCW (see section 3.3) was r = 0.97 (p = 0.002) for averaged NPP (Fig. 8), r = 0.11 (p = 0.83) for averaged SST and, r = 0.68 (p = 0.2) for year-maximum wind speed (p = 0.20) . A very significant positive effect of net primary production (NPP) was then noticed with heavier turtles observed for years with higher net primary production in the region.
4. Discussion
Our study aimed to validate the use of different body measurements to estimate body mass, which can be difficult to obtain in the field, and explore the determinants of the relationship between BM and size in juvenile green turtles.
We show that using a combination of CCL, CCCW, and circumference measurements (CmidCCL) and including a location and year effect, we were able to predict the body mass of individuals (range 0% – 9.22%) with an average error of 1.70% (dataset A; Table 3). If year, location, or CmidCCL were omitted from the model, the average prediction degraded by a factor 2, while the upper range of error increased by a factor 2 (datasets B and C; Table 3). Finally, if only CCL was included in the model, the prediction of BM was considerably degraded
Biology Open • Accepted manuscript
by guest on November 25, 2019 http://bio.biologists.org/
and could reach a maximum error of 72% (dataset D; Table 3). This inexpensive (only a flexible tape measure is necessary) and non-invasive method to estimate BM based on body measurements is applicable in the field by both specialists and non-specialists. However, it is important that only trained and limited number of operators take the measurements to limit errors as already shown by Frazier (1988).
Straight line (SL) measures are considered preferable to over-the-curve (OC) measures for sea turtle research (Pritchard et al., 1983). In a study of juvenile green turtles, SL carapace length (SLCL) had significantly better precision (repeatability) than OCCL (Bjorndal and Bolten, 1989). Limpus (1985) recorded SL measures to ±0.1 cm, but OC measures to ±0.5 cm. However, SL can only be measured with large callipers, while OC measurements are much convenient in the field, especially when measurements are taken in a boat. For this reason, OC measurements, which are widely used for this species (e.g. Almeida et al., 2011; Bellini et al., 2012; Bourjea et al., 2007; Limpus, 1993), were preferred over SL in our study. Furthermore, in green turtles, Bjorndal and Bolten (1989) gave equations to convert OC into SL measurements for both carapace length and width.
In their review Wabnitz and Pauly (2008) found similar relationships between body mass and body measurements in this species on a set of data including adult and juvenile individuals with a worldwide distribution. In fact, the most similar study of juvenile green turtles to be compared with the present one has been done by Bjorndal and Bolten, (1988) on a Bahamian’s population. They showed a relationship between BM and carapace length of green juveniles
with BM = 1.07 10-4 CL 3.04, with CL being the SLCL described in Bjorndal and Bolten (1989).
Using the relationship OCCL=-0.414+1.039 SLCL in Bjorndal and Bolten (1989), we were able to compare directly our data with those of Bjorndal and Bolten (1988) and show a very similar relationship between BM and carapace length (Fig. 6B). This relationship can also be extended to adult size (Fig. 6A).
We also demonstrated a year effect with individuals caught in the years 2011 and 2012 being significantly lighter than expected relative to their size. However, no difference was observed for individuals caught in the years 2015 to 2018 (Fig. 4 and 5). We investigated for annual differences in physical oceanographic conditions (Fig. 7) close to the capture sites (Fig. 1). A very significant relationship for this pattern in terms of the net primary production (Fig. 8) was detected but not for sea surface temperature or occurrence of cyclones: Turtles are heavier relative to their linear dimensions for years with high net primary production. Whereas it
Biology Open • Accepted manuscript
by guest on November 25, 2019 http://bio.biologists.org/
seems logical for an herbivorous animal that the higher is the net primary production, the heavier are the animals, this effect was never demonstrated before. This most likely exists only in juveniles as for adults there will be massive changes in body mass depending on where an individual is in it breeding cycle (e.g. just about to breed or has just completed breeding). So for an adult the body mass probably varies by several 10s of kg over the breeding cycle (Hays and Scott, 2013). Also, we demonstrated a south-north effect with individuals caught in the north being lighter than expected relative to their size (Fig. 3A). This very local pattern (<10 km) is surprising as no spatial effect or spatio-temporal interaction was observed in West Atlantic hawksbills growth rates inhabiting the same region (Bjorndal et al., 2016). It should be noted that individuals are very faithful, being captured in the same bay from year to year. This pattern does not appear to be linked to the density of individuals recorded in the different bays (Fig. 3B). Thus, it would be expected that marine productivity could vary between the bays with a north-south or annual pattern, but this remains to be investigated. Other hypotheses may also explain these differences: for example, human pressure influencing the quality of bays in terms of resources, differences in currents, and the global impact of cyclones in the south versus the north.
Nevertheless, these results highlight that the environmental and nutritional quality of specific local habitats should be further explored in all bays frequented by green turtles in order to develop rational management and conservation plans at the territorial scale of Martinique Island.
Biology Open • Accepted manuscript
by guest on November 25, 2019 http://bio.biologists.org/
Acknowledgments
This study was carried out within the framework of the Plan National d’Action Tortues Marines de Martinique (PATTM) and co-financed by the FEDER Martinique (European Union), DEAL Martinique, ODE Martinique, CNRS, ERDF fund, and Fondation de France. The authors also recognise the support of the ANTIDOT project (Pépinière Interdisciplinaire Guyane, Mission pour l’Interdisciplinarité, CNRS). The authors would like to thank the DEAL Martinique, ODE Martinique, ONCFS Martinique, ONEMA Martinique, SMPE Martinique, ONF Martinique, PNR Martinique, Surfrider Foundation, CREOCEAN, Carbet des Sciences, Aliotis plongée, Plongée-Passion, Collège Cassien Sainte-Claire, and Collège Petit Manoir for their technical support and field assistance. We are also grateful to the numerous volunteers and free divers for their participation in the field operations. The authors acknowledge the support of the Virtual Data initiative run by LABEX P2IO and supported by Université Paris-Sud for providing computing resources on its cloud infrastructure. We thank Heinz Tuechler (tuechler@gmx.at) for introducing us to quasi-variance methodology in an r-help discussion (r-help@r-project.org). Finally, we thank Dr Victoria Grace (www.english-publications.com) for her careful reading of the manuscript and correction of the English.
Biology Open • Accepted manuscript
by guest on November 25, 2019 http://bio.biologists.org/
Bibliography
Almeida, A. d. P., Moreira, L. M. P., Bruno, S. C., Thomé, J. C. A., Martins, A. S., Bolten, A. B. and Bjorndal, K. A. (2011). Green turtle nesting on Trindade Island, Brazil:
abundance, trends and biometrics. Endanger Species Res 14, 193-201.
Bass, A. L. and Witzell, W. N. (2000). Demographic composition of immature green
turtles (Chelonia mydas) from the east central Florida coast: evidence from mtDNA markers.
Herpetologica 56, 357-367.
Behrenfeld, M. J. and Falkowski, P. G. (1997). Photosynthetic rates derived from
satellite-based chlorophyll concentration. Limnol. Oceanogr. 42, 1-20.
Bellini, C., Santos, A. J. B., Grossman, A., Marcovaldi, M. A. and Barata, C. R. (2012).
Green turtle (Chelonia mydas) nesting on Atol das Rocas, North-Eastern Brazil, 1990-2008.
Journal of the Marine Biological Association of the UK 93, 1117-1132.
Bjorndal, K. A. and Bolten, A. B. (1988). Growth rates of immature green turtles,
Chelonia mydas, on feeding grounds in the Southern Bahamas. Copeia 1988, 555-564.
Bjorndal, K. A. and Bolten, A. B. (1989). Comparison of straight-line and
over-the-curve measurements for growth rates of green turtles, Chelonia mydas. Bulletin of Marine
Science 45, 189-192.
Bjorndal, K. A., Chaloupka, M., Saba, V. S., Diez, C. E., Dam, R. P. v., Krueger, B. H., Horrocks, J. A., Santos, A. J. B., Bellini, C. u., Marcovaldi, M. A. G. et al. (2016). Somatic
growth dynamics of West Atlantic hawksbill sea turtles: a spatio-temporal perspective.
Ecosphere 7, e01279.
Bolten, A. B. (1999). Techniques for measuring sea turtles. In Research and
Management Techniques for the Conservation of Sea Turtles, vol. Publication No. 4 eds. K. L.
Eckert K. A. Bjorndal F. A. Abreu-Grobois and M. Donnelly), pp. 110-114. Washington, DC: IUCN/SSC Marine Turtle Specialist Group.
Boos, M., Zorn, T., Koch, A., Le Maho, Y. and Robin, J.-P. (2000). Determining body
fuels of wintering mallards. Comptes Rendus de l'Académie des Sciences Série III-Sciences de
la Vie-Life Sciences 323, 183-193.
Bourjea, J., Frappier, J., Quillard, M., Ciccione, S., Roos, D., Hughes, G. and Grizel, H.
(2007). Mayotte Island: another important green turtle nesting site in the southwest Indian Ocean. Endangered Species Research 3, 273-282.
Biology Open • Accepted manuscript
by guest on November 25, 2019 http://bio.biologists.org/
Brady, C. J. and Noske, R. A. (2006). Generalised regressions provide good estimates
of insect and spider biomass in the monsoonal tropics of Australia. Aus. J. Entomol. 45, 187-191.
Burnham, K. P. and Anderson, D. R. (2002). Model selection and multimodel
inference: A practical information-theoretic approach. New York: Springer-Verlag.
Cardillo, M., Mace, G. M., Jones, K. E., Bieldy, J., Bininda-Edmonds, O. R. P., Sechrest, W., Orme, C. D. L. and Purvis, A. (2005). Multiple causes of high extinction risk in
large mammal species. Science 309, 1239-1241.
Casale, P., Freggi, D., Basso, R., Vallini, C. and Argano, R. (2007). A model of area
fidelity, nomadism, and distribution patterns of loggerhead sea turtles (Caretta caretta) in the Mediterranean Sea. Marine Biology 152, 1039-1049.
Chaloupka, M. Y. and Musick, J. A. (1997). Age, growth, and population dynamics. In
The biology of sea turtles, eds. P. L. Lutz and J. A. Musick), pp. 234-276. Boca Raton, Florida:
CRC Press.
Chambault, P., de Thoisy, B., Huguin, M., Martin, J., Bonola, M., Etienne, D.,
Gresser, J., Hiélard, G., Mailles, J., Védie, F. et al. (2018). Connecting paths between juvenile
and adult habitats in the Atlantic green turtle using genetics and satellite tracking. Ecology
and Evolution 8, 12790-12802.
Churchill, M., Clementz, M. T. and Kohno, N. (2014). Predictive equations for the
estimation of body size in seals and sea lions (Carnivora: Pinnipedia). J. Anat. 225, 232-245.
Clutton-Brock, T. H. (1991). The evolution of parental care. Princeton, US: Princeton
University Press.
Damuth, J. and MacFadden, B. J. (1990). Body size in mammalian paleobiology.
Cambridge, UK: Cambridge University Press.
Fariña, R. A., Vizcaíno, S. F. and Bargo, M. S. (1998). Body mass estimations in
Lujanian (late Pleistocene-early Holocene of South America) mammal megafauna.
Mastozoología Neotropical 5, 87-108.
Firth, D. and de Mezezes, R. X. (2004). Quasi-variances. Biometrika 91, 65-80. Frazier, J. (1988). Measurement error: the great chelonian taboo. In Proceedings of
the 16th Annual Symposium on Sea Turtle Biology and Conservation, pp. 47-49: NOAA
Technical Memorandum NMFS-SEFSC-412.
Biology Open • Accepted manuscript
by guest on November 25, 2019 http://bio.biologists.org/
Froese, R. and Palmares, M. L. D. (2000). Growth, natural mortality, length-weight
relationship, maximum length and length-at-first-maturity of the coelacanth Latimeria
chalumnae. Environ Biol Fishes 58, 45-52.
Fulton, T. W. (1904). The rate of growth of fishes. Fish Board of Scotland Annual
Report 22, 141-241.
Gaillard, J. M., Festa-Bianche, M., Delorme, D. and Jorgonsen, J. (2000). Body mass
and individual fitness in female ungulates: bigger is not always better. Proc R Soc Lond Ser
B-Biol Sci 267, 471-477.
Georges, J. Y. and Fossette, S. (2006). Estimating body mass in the leatherback turtle
Dermochelys coriacea. Marine Ecology-Progress Series 318, 255-262.
Girondot, M. and Guillon, J.-M. (2018). The w-value: An alternative to t- and X2 tests. Journal of Biostatistics & Biometrics 1, 1-4.
Greven, S. and Kneib, T. (2010). On the behaviour of marginal and conditional Akaike
Information Criteria in linear mixed models. Biometrika 97, 773-789.
Hays, G. C., Broderick, A. C., Glen, F. and Godley, B. J. (2002). Change in body mass
associated with long-term fasting in a marine reptile: the case of green turtles (Chelonia
mydas) at Ascension Island. Can J Zool 80, 1299-1302.
Hays, G. C. and Scott, R. 2013. Global patterns for upper ceilings on migration
distance in sea turtles and comparisons with fish, birds and mammals. Functional Ecology 2013, 27, 748–756. doi: 10.1111/1365-2435.12073.
Jakob, E. M., Marshall, S. D. and Uetz, G. W. (1996). Estimating fitness: a comparison
of body condition indices. Oikos 77, 61-67.
Kohler, N. E., Casey, J. G. and Turner, P. A. (1995). Length-weight relationships for 13
species of sharks from the western North-Atlantic. Fish. Bull. 93, 412-418.
Le Cren, E. D. (1951). The length-weight relationship and seasonal cycle in gonad
weight and condition on the perch (Perca Fluviatilis). J Anim Ecol 20, 201-219.
Limpus, C. and Chaloupka, M. (1997). Nonparametric regression modelling of green
sea turtle growth rates (southern Great Barrier Reef). Marine Ecology-Progress Series 149, 23-34.
Limpus, C. J. (1985). A study of the loggerhead turtle, Caretta caretta, in eastern
Australia. In Zoology Department, pp. 507: University of Queensland.
Biology Open • Accepted manuscript
by guest on November 25, 2019 http://bio.biologists.org/
Limpus, C. J. (1993). The green turtle, Chelonia mydas, in Queensland: breeding
males in the Southern Great Barrier Reef. Wildlife Research 20, 513-523.
Lindenfors, P., Tullberg, B. S. and Biuw, M. (2002). Phylogenetic analyses of sexual
selection and sexual size dimorphism in pinnipeds. Behav Ecol Sociobiol 52, 188-193.
Martin-Smith, K. M. (1996). Length/weight relationships of fishes in a diverse tropical
freshwater community, Sabah, Malaysia. Journal of Fish Biology 49, 731-734.
Morel, A. and Berthon, J.-F. (1989). Surface pigments, algal biomass profiles, and
potential production of the euphotic layer: Relationships reinvestigated in view of remote-sensing applications. Limnol. Oceanogr. 34, 1545-1562.
Nee, S., Read, A. F., Greenwood, J. J. D. and Harvey, P. H. (1991). The relationship
between abundance and body size in British birds. Nature 351, 312-313.
Pelletier, D., Roos, D. and Ciccione, S. (2003). Oceanic survival and movements of
wild and captive-reared immature green turtles (Chelonia mydas) in the Indian Ocean.
Aquatic Living Resources 16, 35-41.
Peters, R. H. (1983). The ecological implications of body size. Cambridge, UK:
Cambridge University Press.
Price, E. R., Wallace, B. P., Reina, R. D., Spotila, J. R., Paladino, F. V., Piedra, R. and Vélez, E. (2004). Size, growth, and reproductive output of adult female leatherback turtles
Dermochelys coriacea. Endangered Species Research 5, 1-8.
Pritchard, P., Bacon, P., Berry, F., Carr, A., Fletemeyer, J., Gallagher, R., Hopkins, S., Lankford, R., Marquez, R., M., L. O. et al. (1983). Manual of sea turtle research and
conservation techniques, eds. K. A. Bjorndal and G. H. Balazs), pp. 126. Washington, D.C.: Center for Environmental Education.
Rohatgi, A. 2019. WebPlotDigitizer, version 4.2, San Francisco, California, USA.
https://automeris.io/WebPlotDigitizer
Rogers, L. E., Buschbom, R. L. and Watson, C. R. (1977). Length-weight relationships
of shrub-steppe invertebrates. Annals of the Entomological Society of America 70, 51-53.
Säfken, B., Rügamer, D., Kneib, T. and Greven, S. (2018). Conditional model selection
in mixed-effects models with cAIC4. arXiv 1803.05664v2, 1-31.
Sage, R. D. (1982). Wet and dry-weight estimates of insects and spiders based on
length. The American Midland Naturalist 108, 407-411.
Biology Open • Accepted manuscript
by guest on November 25, 2019 http://bio.biologists.org/
Santos, A. J. B., Freire, E. M. X., Bellini, C. and Corso, G. (2010). Body mass and the
energy budget of gravid hawksbill turtles (Eretmochelys imbricata) during the nesting season. Journal of Herpetology 44, 352-359.
Schmidt-Nielsen, K. (1984). Scaling: why is animal size so important? Cambridge, UK:
Cambridge University Press.
Schoener, T. W. (1980). Length-weight regressions in tropical and temperate
forest-understory insects. Annals of the Entomological Society of America 73, 106-109.
Smith, R. J. and Jungers, W. L. (1997). Body mass in comparative primatology.
Journal of Human Evolution 32, 523-559.
Stevenson, R. D. and Woods, W. A., Jr. (2006). Condition indices for conservation:
new uses for evolving tools. Integr Comp Biol 46, 1169-90.
Trites, A. W., Christensen, V. and Pauly, D. (1997). Competition between fisheries
and marine mammals for prey and primary production in the Pacific Ocean. J. Northw. Atl.
Fish. Sei. 22, 173-187.
Trites, A. W. and Pauly, D. (1998). Estimating mean body masses of marine mammals
from maximum body lengths. Canadian Journal of Zoology 76, 886-896.
Tuomi, J. (1980). Mammalian reproductive strategies: a generalized relation of litter
size to body size. Oecologia 45, 39-44.
Van Valkenburgh, B. (1990). Skeletal and dental predictors of body mass in
carnivores. In Body size in mammalian paleobiology, eds. J. Damuth and B. J. MacFadden), pp. 181-205. Cambridge, UK: Cambridge University Press.
Viblanc, V. A., Bize, P., Criscuolo, F., Le Vaillant, M., Saraux, C., Pardonnet, S., Gineste, B., Kauffman, M., Prud’homme, O., Handrich, Y. et al. (2012). Body girth as an
alternative to body mass for establishing condition indexes in field studies: a validation in the king penguin. Physiol. Biochem. Zool. 85, 533-542.
Wabnitz C, Pauly D. 2008. Length-weight relationships and additional growth
parameters for sea turtles, in: Palomares, M.L.D., Pauly, D. (eds.), Fisheries Centre Research Reports, vol. 16. Fisheries Centre, University of British Columbia, pp. 92-101. https://open.library.ubc.ca/cIRcle/collections/facultyresearchandpublications/52383/items/ 1.0074762
Biology Open • Accepted manuscript
by guest on November 25, 2019 http://bio.biologists.org/
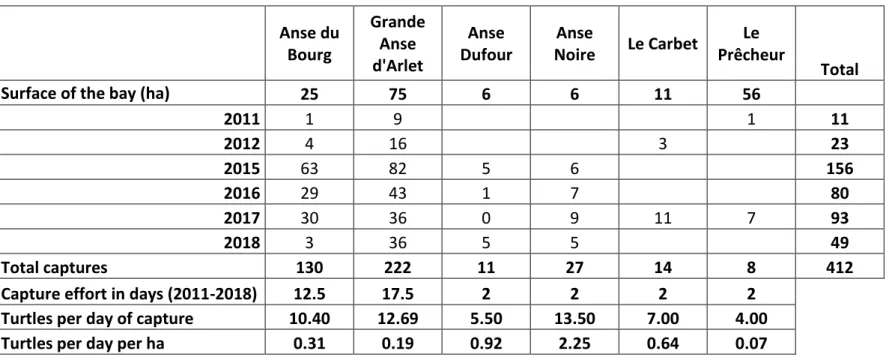
Table 1: Number of captures according to bay (anse in French; see Fig. 1) and year of capture. Anse du Bourg Grande Anse d'Arlet Anse Dufour Anse Noire Le Carbet Le Prêcheur Total Surface of the bay (ha) 25 75 6 6 11 56
2011 1 9 1 11 2012 4 16 3 23 2015 63 82 5 6 156 2016 29 43 1 7 80 2017 30 36 0 9 11 7 93 2018 3 36 5 5 49 Total captures 130 222 11 27 14 8 412 Capture effort in days (2011-2018) 12.5 17.5 2 2 2 2
Turtles per day of capture 10.40 12.69 5.50 13.50 7.00 4.00 Turtles per day per ha 0.31 0.19 0.92 2.25 0.64 0.07
Biology Open • Accepted manuscript
by guest on November 25, 2019 http://bio.biologists.org/
Dataset A: L W C Y(3) B(6); n=181
cAIC ∆ cAIC Akaike weight
L W C L:W L:C W:C Y B -530.85 4.46 0.07 L W C L:W L:C W:C Y -528.64 6.66 0.02 L W C L:W L:C W:C B -532.56 2.75 0.16 L W C L:C W:C Y B -535.31 0.00 0.63 L W C L:W W:C Y B -531.76 3.19 0.11 L W C L:W L:C Y B -527.79 8.51 0.00 Second round L W C L:C W:C Y B -535.31 0.00 0.45 L W C L:C W:C Y -532.71 2.59 0.12 L W C L:C W:C B -534.10 1.21 0.24 L W C L:C Y B -531.83 3.47 0.07 L W C W:C Y B -532.39 2.91 0.10 Dataset B: L W Y(6) B(6); n=350
cAIC ∆ cAIC Akaike weight
L W L:W Y B -820.20 0.24 0.32 L W L:W Y -819.30 2.23 0.20 L W L:W B -818.21 2.23 0.11 L W Y B -820.44 0.00 0.36 Second round L W Y B -820.44 0.00 0.51 L W Y -819.26 1.18 0.28 L W B -818.59 1.84 0.20 W Y B -769.04 51.39 0.00 L Y B -788.57 31.87 0.00 Dataset C: L W; n=350
cAIC ∆ cAIC Akaike weight
L W L:W -823.00 0.37 0.45 L W -824.01 0.00 0.54 Second round L W -824.01 0.00 1.00 L -803.52 20.49 0.00 W -756.43 67.58 0.00
Table 2: Backward model selection for datasets A, B, and C using the conditional Akaike information criterion (cAIC). L, W, and C are respectively curved carapace length (CCL), central curved carapace width (CCCW), and circumference at mid-length (CmidCCL). Y and B are respectively years and bay locations; both are treated as categorical factors with the number of levels indicated in parentheses. n represents the number of captures available for each dataset. Selected models are indicated in bold.
Biology Open • Accepted manuscript
by guest on November 25, 2019 http://bio.biologists.org/
Table 3: Fitted fixed effects for conditional Akaike information criterion-selected models and prediction errors for datasets A to D. All measures were log-transformed.
Prediction error for dataset A: Average=1.70%; SD=1.62%; Range=0% – 9.22%
BM = 7.222766 2.536911 CCL + 4.879715 CCCW 0.049499 CmidCCL + 0.941970 CmidCCL CCL -0.878909 CmidCCL CCCW + Year + Location
Year: 2016=0; 2017=0.011144; 2018=-0.023099
Location: Anse du Bourg=0; Anse Dufour=0.052495; Anse Noire=-0.046397; Grande Anse d'Arlet=-0.005426; Le Carbet=-0.047715; Le Prêcheur=-0.074231
Prediction error for dataset B: Average=2.47%; SD=2.63%; Range=0% – 22.05% BM = -8.5862637 - 1.9013936 CCL + 0.9998518 CCCW + Year + Location
Year: 2011=0; 2012=-0.0306340; 2015=0.0756729; 2016=0.0656553; 2017=0.0702490; 2018=-0.0439200
Location: Anse du Bourg=0; Anse Dufour=-0.0134045; Anse Noire=-0.0407597; Grande Anse d'Arlet=0.0001182; Le Carbet=-0.0311695; Le Prêcheur=-0.0469281
Prediction error for dataset C: Average=2.39%; SD=2.59%; Range=0% – 19.64% BM = -8.6667 + 1.9351 CCL + 0.9994 CCCW
Prediction error for dataset D: Average=7.09%; SD=7.60%; Range=0% – 72.44% BM = 0.00014 + 2.98316 CCL
Biology Open • Accepted manuscript
by guest on November 25, 2019 http://bio.biologists.org/
Figure 1: Localisation of Martinique Island in the Caribbean Sea (top panel) as well as the bays where the turtles were caught (dots). The black and white circles indicate the position where the net primary production, wind speed, and sea surface temperatures were measured (see Fig. 6).
61.3
°
W
61.2
°
W
61.1
°
W
61
°
W
60.9
°
W
60.8
°
W
14.4
°
N
14.5
°
N
14.6
°
N
14.7
°
N
14.8
°
N
14.9
°
N
E N W S0
5
10 km
● Anse du Bourg ●Grande Anse d'Arlet
● Anse Dufour ● Anse Noire ● Le Carbet ● Le P rê ch eur
●
n n ●Biology Open • Accepted manuscript
by guest on November 25, 2019 http://bio.biologists.org/
Figure 2: Schematic illustration of measurements. Scutes: Sc Supracaudal, N Nuchal, C Costal. Measurements: CCL curved carapace length; equivalent of OCCL in (Bjorndal and Bolten, 1989), RCCL right curved carapace length, LCCL left curved carapace length, CCCW central curved carapace width, CmidCCL Circumference at mid curved carapace length.
Biology Open • Accepted manuscript
by guest on November 25, 2019 http://bio.biologists.org/
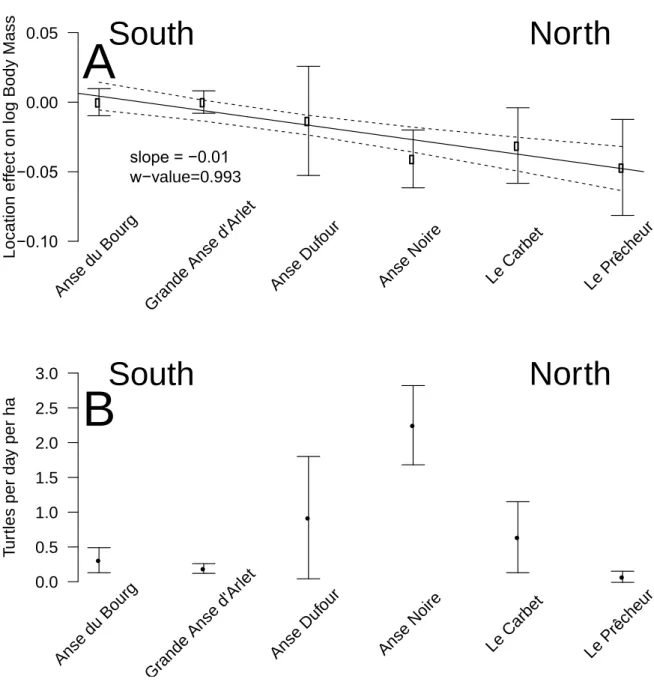
Figure 3: (A) Bay location effect on log body mass. A negative value indicates that body mass is lower than expected based on the size of the individual. Anse du Bourg was used as a reference and was thus equal to 0. Bay locations are ordered from south to north (left to right). Bars are the quasi-standard errors (Firth and de Mezezes, 2004). The significant South-North trend (1 for Southernmost, 6 for Northernmost location, slope=-0.01, w-value=0.993 being the posterior probability that the slope is different from 0) based on the linear model is shown along with its 95% confidence interval. If the distances between sites is used as a regressors the conclusion is unchanged (slope=-0.002, se=0.001, w-value=5.513). (B) Density of turtles corrected for pressure of capture. Bars represent standard errors. −0.10 −0.05 0.00 0.05 L o c a ti o n e ff e c t o n l o g B o d y M a s s Ans e du Bou rg Gra nde Ans e d' Arle t Ans e D ufou r Ans e N oire Le C arbe t Le P rêch eur
South
North
slope = −0.01 w−value=0.993A
0.0 0.5 1.0 1.5 2.0 2.5 3.0 T u rt le s p e r d a y p e r h a ● ● ● ● ● ● Ans e du Bou rg Gra nde Ans e d' Arle t Ans e D ufou r Ans e N oire Le C arbe t Le P rêch eurSouth
North
B
Biology Open • Accepted manuscript
by guest on November 25, 2019 http://bio.biologists.org/
Figure 4: Year effect on log body mass for turtles captured in Martinique Island. Bars are the quasi-standard errors (Firth and de Mezezes, 2004). A negative value indicates that BM was lower than expected based on the size of the individual. Year 2011 was used as a reference and was thus equal to 0.
Biology Open • Accepted manuscript
by guest on November 25, 2019 http://bio.biologists.org/
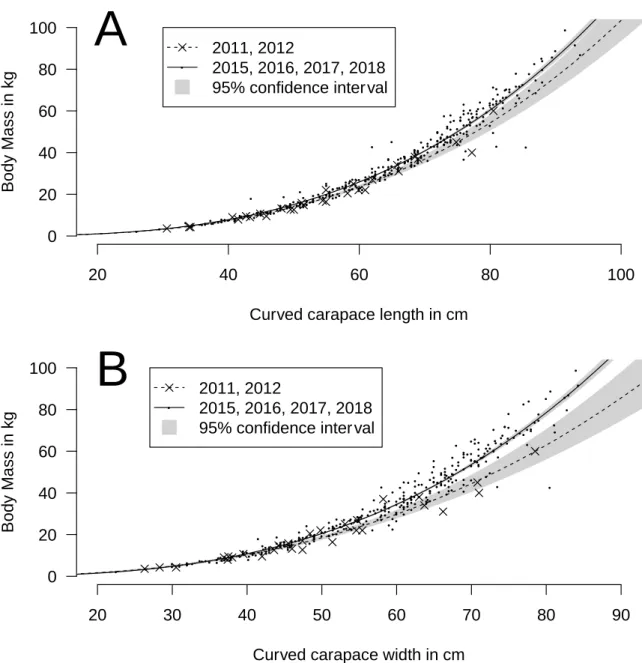
Figure 5: Relationship between body mass and (A) curved carapace length (CCL) and (B) curved carapace width (CCW) for turtles caught in 2011 and 2012 (crosses) or from 2015 (points). Crosses are located mostly at the bottom of the distributions, indicating that turtles are lighter than expected relative to their size in 2011 and 2012 (see also Fig. 4). Fitted model of log body mass against log CCL and log CCW as well as the 95% confidence interval (shaded area) are shown for both time periods.
20 40 60 80 100 0 20 40 60 80 100
Curved carapace length in cm
B o d y M a s s i n k g ● ● ● ● ● ● ● ● ● ● ● ● ● ● ● ● ● ● ● ● ● ● ● ● ● ● ● ● ● ● ● ● ● ● ● ● ● ● ● ● ● ● ● ● ● ● ● ● ● ● ● ● ● ● ● ● ● ● ● ● ● ● ● ● ● ● ● ● ● ● ● ● ● ● ● ● ● ● ● ● ● ● ● ● ● ● ● ● ● ● ● ● ● ● ● ● ● ● ● ● ● ● ● ● ● ● ● ● ● ● ● ● ● ● ● ● ● ● ● ● ● ● ● ● ● ● ● ● ● ● ● ● ● ● ● ● ● ● ● ● ● ● ● ● ● ● ● ● ● ● ● ● ● ● ● ● ● ● ● ● ● ● ● ● ● ● ●●● ● ●● ● ● ● ● ● ● ● ● ● ● ● ● ● ● ● ● ● ● ● ● ● ● ● ● ● ● ● ● ● ● ● ● ● ● ● ● ● ● ● ● ● ● ● ● ● ● ● ● ● ● ● ● ● ● ● ● ● ● ● ● ● ● ● ● ● ● ● ● ● ● ● ● ● ● ● ● ● ● ● ● ● ● ● ● ● ● ● ● ● ● ● ● ● ● ● ● ● ● ● ● ● ● ● ● ● ● ● ● ● ● ● ● ● ● ● ● ● ● ● ● ● ● ● ● ● ● ● ● ● ● ● ● ● ● ● ● ● ● ● ● ● ● ● ● ● ● ● ● ● ● 2011, 2012 2015, 2016, 2017, 2018 95% confidence inter val
A
20 30 40 50 60 70 80 90 0 20 40 60 80 100Curved carapace width in cm
B o d y M a s s i n k g ● ● ● ● ● ● ● ● ● ● ● ● ● ● ● ● ● ● ● ● ● ● ● ● ● ● ● ● ● ● ● ● ● ● ● ● ● ● ● ● ● ● ● ● ● ● ● ● ● ● ● ● ● ● ● ● ● ● ● ● ● ● ● ● ● ● ● ● ● ● ● ● ● ● ● ● ● ● ● ● ● ● ● ● ● ● ● ● ● ● ● ● ● ● ● ● ● ● ● ● ● ● ● ● ● ● ● ● ● ● ● ● ● ● ● ● ● ● ● ● ● ● ● ● ● ● ● ● ● ● ● ● ● ● ● ● ● ● ● ● ● ● ● ● ● ● ● ● ● ● ● ● ● ● ● ● ● ● ● ● ● ● ● ● ● ● ● ● ● ● ● ● ● ● ● ● ● ● ● ● ● ● ● ● ● ● ● ● ● ● ● ● ● ● ● ● ● ● ● ● ● ● ● ● ● ● ● ● ● ● ● ● ● ● ● ● ● ● ● ● ● ● ● ● ● ● ● ● ● ● ● ● ● ● ● ● ● ● ● ● ● ● ● ● ● ● ● ● ● ● ● ● ● ● ● ● ● ● ● ● ● ● ● ● ● ● ● ● ● ● ● ● ● ● ● ● ● ● ● ● ● ● ● ● ● ● ● ● ● ● ● ● ● ● ● ● ● ● ● ● ● ● ● ● ●● ● ● ● ● ● ● ● ● ● ● ● ● ● ● ● ● 2011, 2012 2015, 2016, 2017, 2018 95% confidence inter val
B
Biology Open • Accepted manuscript
by guest on November 25, 2019 http://bio.biologists.org/
Figure 6: Comparison of the relationship between body mass and carapace length for (A) Ascension Island (adults) and (B) Bahamas (juveniles) against Martinique young juvenile green turtles. In B, the two models are very similar, so the curves are superimposed. Data from Ascension and Bahamas were digitized from original publications using WebPlotDigitizer (Rohatgi, 2019).
20 40 60 80 100 120 0 50 100 150 200 250
Curved Carapace Length (cm)
B o d y m a s s ( k g )
Ascension Island, adult females Martinique, juveniles
95% confidence inter val
A
20 40 60 80 100 0 20 40 60 80 100Straight carapace length (cm)
B o d y m a s s ( k g ) Bahamas − SCL
Martinique − CCL into SCL 95% confidence inter val
B
Biology Open • Accepted manuscript
by guest on November 25, 2019 http://bio.biologists.org/
Figure 7: (A) Average monthly ocean net primary production in mg C.m-2.day-1, (B) average
monthly sea surface temperature in °C, and (C) 12 h wind speed in m.s-1 to the west of
Martinique Island (61.25 W, 14.55 N) (see location indicated by black and white circles in Fig. 1). 0 500 1000 1500 2000 Years N e t P ri m a ry P ro d u c ti o n ( m g C .m -2.d a y -1) 2 0 0 3 2 0 0 4 2 0 0 5 2 0 0 6 2 0 0 7 2 0 0 8 2 0 0 9 2 0 1 0 2 0 1 1 2 0 1 2 2 0 1 3 2 0 1 4 2 0 1 5 2 0 1 6 2 0 1 7
A
26 27 28 29 30 Years M o n th ly m e a n S S T ( °C ) 2 0 0 3 2 0 0 4 2 0 0 5 2 0 0 6 2 0 0 7 2 0 0 8 2 0 0 9 2 0 1 0 2 0 1 1 2 0 1 2 2 0 1 3 2 0 1 4 2 0 1 5 2 0 1 6 2 0 1 7B
0 5 10 15 20 Years W in d s p e e d ( m .s -1) 2 0 0 3 2 0 0 4 2 0 0 5 2 0 0 6 2 0 0 7 2 0 0 8 2 0 0 9 2 0 1 0 2 0 1 1 2 0 1 2 2 0 1 3 2 0 1 4 2 0 1 5 2 0 1 6 2 0 1 7C
Ivan Dean IrmaMatthew Tomas
Name of cyclones
Biology Open • Accepted manuscript
by guest on November 25, 2019 http://bio.biologists.org/
Figure 8: Relationship between relative year effect on log body mass vs. log CCL and CCW and year-averaged net primary production (NPP) at the west of Martinique Island (61.25 W, 14.55 N) (see location indicated by black and white circles in Fig. 1). Bars are the quasi-standard errors (Firth and de Mezezes, 2004).
Biology Open • Accepted manuscript
by guest on November 25, 2019 http://bio.biologists.org/