HAL Id: hal-03030612
https://hal.archives-ouvertes.fr/hal-03030612
Submitted on 30 Nov 2020HAL is a multi-disciplinary open access archive for the deposit and dissemination of sci-entific research documents, whether they are pub-lished or not. The documents may come from teaching and research institutions in France or abroad, or from public or private research centers.
L’archive ouverte pluridisciplinaire HAL, est destinée au dépôt et à la diffusion de documents scientifiques de niveau recherche, publiés ou non, émanant des établissements d’enseignement et de recherche français ou étrangers, des laboratoires publics ou privés.
Prioritizing the provision of urban ecosystem services in
deprived areas, a question of environmental justice
Wissal Selmi, Slaheddine Selmi, Jacques Teller, Christiane Weber, Emmanuel
Riviere, David Nowak
To cite this version:
Wissal Selmi, Slaheddine Selmi, Jacques Teller, Christiane Weber, Emmanuel Riviere, et al.. Priori-tizing the provision of urban ecosystem services in deprived areas, a question of environmental justice. AMBIO: A Journal of the Human Environment, Springer Verlag, 2020, �10.1007/s13280-020-01438-1�. �hal-03030612�
1 Preprint, the final version, of the article that has been transferred to the journal's production team.
To cite this article: Selmi, W., Selmi, S., Teller, J. Weber, C., Rivière, N., Nowak, D. Prioritizing the provision of urban ecosystem services in deprived areas, a question of environmental justice. Ambio (2020). https://doi.org/10.1007/s13280-020-01438-1
Prioritizing the provision of urban ecosystem services in deprived areas, a question of environmental justice
Abstract
The distribution of urban ecosystem services (UES) is often uneven across socioeconomic groups, leading to environmental justice issues. Understanding the distribution of UES across a landscape can help managers ensure an equitable distribution of services. While many past studies have focused on the distribution of green spaces in relation to socioeconomic variables, this research analyzes the distribution of UES provided by these green spaces. This research quantified air pollution removal, atmospheric carbon reduction, and surface runoff mitigation provided by urban trees in Strasbourg city (France). The provision of these three UES was studied at the census block scale by creating an index of UES delivery, which was contrasted with a constructed social deprivation index. Our results show that there is no significant association between the delivery of UES and social deprivation. Some deprived populations benefit from high UES delivery. Results also suggest that mapping associations between UES delivery and social deprivation should be integrated with future development plans to enhance the equitable distribution of UES. This study provides insights into the French context where studies about the distribution of UES at a small-area level remain lacking.
2 1
1. Introduction 2
Numerous studies have stressed the importance of quantifying urban ecosystem services 3
(UES) at different scales and integrating them into decision-making processes (Ernstson et al. 4
2010; Kremer et al. 2016; Yang et al. 2018). However, while the concept of UES represents a 5
bridge between social and ecological systems within a city, little is known about the relationship 6
between social systems and ecosystem services delivery at the local level (Amini Parsa et al. 7
2019). This issue is increasingly addressed within the environmental justice (EJ) framework, 8
given the recognition of urban green spaces (UGS) and their UES as local solutions to both 9
local (e.g. air pollution, intense precipitation events) and global environmental burdens (e.g. 10
climate change) (Zhao and Sander. 2015; Amini Parsa et al. 2019; Escobedo et al. 2019) and 11
the growing conviction that uneven exposure to environmental burdens and benefits among 12
social groups affects city sustainability (Baró et al. 2019). The concept of EJ was mainly 13
developed in the USA in the 1970s, with a focus on the relationship between socioeconomic 14
groups and the distribution of environmental burdens and benefits, assuming that disadvantaged 15
communities are most exposed to environmental risks (Greenberg and Cidon. 1997; Agyeman 16
et al. 2002; Kruize et al. 2007; Brown et al. 2012; Raddatz and Mennis. 2013; Boyce et al. 17
2016). The application of EJ framework to UES focuses on their immediate distribution at the 18
local scale (e.g. city-scale, block group, neighborhood) where ecosystem services delivery and 19
benefits are realized (Baró et al. 2019) and hence can support policies of sustainability to 20
maintain their long-term production in a fair and just manner (de Groot et al. 2010; Boone and 21
Fragkias. 2013). 22
An important scientific corpus has been constructed around environmental justice linked 23
to UGS (Grove et al. 2006; Heynen et al. 2006; Pham et al. 2012). For example, the distribution 24
of green cover in Edinburgh, Glasgow, Leicester, Oxford and Sheffield (UK) and San Juan 25
3 (Puerto Rico) has been found to be linked with urban characteristics like housing type, detached 26
housing and age of construction (Tratalos et al. 2007; Martinuzzi et al. 2018). In Terre Haute 27
(IN, USA), positive correlations were found between leaf area, population density, and median 28
income (Jensen et al. 2005). However, knowledge about the distribution of UES from an EJ 29
perspective remains limited (Wilkerson et al. 2018; Baró et al. 2019). For instance, few studies 30
have investigated the link between income level and temperature reduction (Jenerette et al. 31
2011), and the variation of amenities according to economic status and ethnic origin (Landry 32
and Chakraborty. 2009). Dobbs et al. (2014) found that UES provision in Melbourne (Australia) 33
was positively related to the degree of human development, assessed as the ratio between 34
education level and income. In Bogota (Colombia), Escobedo et al. (2015) found that the 35
wealthiest population had the greatest access to particulate matter removal by trees. In Europe, 36
EJ applied to UES is an emerging subject that has been investigated only in few urban areas, 37
notably Berlin (Lakes et al. 2014), Barcelona (Baró et al. 2016; Baró et al. 2019) and Porto 38
(Graça et al. 2017). 39
In France, investigations of UES within the EJ framework are rather scarce. Cohen et 40
al. (2012) assessed indirectly UES distribution in Paris through perception and species 41
indicators. In 2013, the national program of ecosystem functions and services assessment 42
(“L’évaluation française des écosystèmes et des services écosystémiques”: EFESE) was 43
launched. It addressed the disparity in the distribution of green spaces in French cities by 44
referring to some indicators like accessibility and attendance (EFESE 2018). However, the 45
distribution of UES across a socioeconomic gradient has not been considered. 46
In line with such evidence, it is essential to investigate more case studies to draw a more 47
complete and general picture about the interactions between socioeconomic factors and 48
ecosystem services depending on local contexts. Providing empirical research about how 49
socioeconomic factors influence ecosystem services can enrich research in this field. It may 50
4 also facilitate orienting urban planning toward increased sustainability and equity. Hence, our 51
paper contributes to the literature of environmental justice related to UES by providing a case 52
study combining biophysical indicators that directly measure urban ecosystem services and 53
socioeconomic indicators in a context of French cities. 54
Therefore, the main goal of this study is to conduct a quantitative assessment of UES 55
from a distributive justice perspective in Strasbourg city (France) and analyze if there are social-56
spatial inequalities related to their provision. Distributive justice of ES is defined as the equal 57
access to ES among different social groups (Sievers-Glotzbach 2013; Schüle et al. 2019). 58
We focused on ecosystem services provided by trees located in public green spaces and 59
along streets as these areas are managed via public funding. We aimed to analyze the 60
distribution of UES delivery across a deprivation gradient defined by both social and material 61
disadvantages of local communities (Havard et al. 2008). Our study had three specific 62
objectives: 1) identify and assess socioeconomic variables that define deprivation, 2) quantify 63
three UES (air purification, runoff mitigation, atmospheric carbon reduction) and combine them 64
into one UES delivery index, and 3) investigate the relationship between social deprivation and 65
UES delivery to highlight potential environmental inequalities within the city. 66 67 2. Methods 68 2.1.Study area 69
This study was conducted in Strasbourg city, in Northeastern France (48°35’N and 70
7°45’W). The city covers an area of 7830 ha and supports about 275 700 inhabitants with a 71
population density of 35 inhabitants per ha (INSEE, 2016). The city is covered by 400 ha of 72
parks and about 1600 ha of protected alluvial forests that are major carbon sinks in the city. The 73
historic core of the city is surrounded by the green belt which is 650 m wide and supports 370 74
ha of gardens, vacant areas, and green spaces. Strasbourg occupies the 7th place in terms of
5 number of m2 of tree cover per inhabitant (32 m² /inhabitant) while the first place is occupied
76
by Montpellier city (43 m2 of tree cover / inhabitant; about 5700 ha; 268 456 inhabitants,).
77
Strasbourg is projected to develop more than 1000 ha of green and vacant spaces 78
between 2017 and 2030. This development would lead to the release of carbon stored in soils 79
and vegetation and weaken strategies for mitigating climate change. Increasing cumulative 80
rainfall along with substantial impervious surfaces and a dense hydrographic network makes 81
the city vulnerable to flooding (ADEUS 2018). Air pollution is also an environmental burden 82
in Strasbourg, as NO2 exposure is increasing and PM10 exceeds prescribed daily limits (Atmo
83
Grand-Est 2018). 84
The city contains 14 neighborhoods subdivided into 116 census blocks called IRIS 85
(Fig.1a). To ensure relevant analysis of social and ecological mismatches in Strasbourg, IRISs 86
with a limited population (less than 250 inhabitants) were excluded. According to Havard et al. 87
(2008), the excluded blocks with very low population numbers do not present sufficient 88
socioeconomic information. In total, 94 IRISs were included in our study sample. The average 89
population per IRIS was 2619 inhabitants with a mean IRIS area of 59 ha (44 inhabitants per 90
ha). 91
2.2.Quantification of social deprivation 92
Studies of UES from an EJ perspective are often based on literature reviews to select 93
socioeconomic variables to define social deprivation (e.g. McPhearson et al. 2013; Dobbs et al. 94
2014; Baró et al. 2019). In this work, we instead built a composite deprivation index based on 95
quantitative data and statistical analyses. 96
Data on socioeconomic variables that are often used to reflect social deprivation within 97
UES environmental justice frameworks (e.g. Pham et al. 2012; Cohen et al. 2012; McPhearson 98
et al. 2013; Graça et al. 2018) were obtained from the 2013 national census (INSEE 2016). 99
6 From these original data, eight socioeconomic variables providing inter-related 100
indicators of social deprivation were determined: (1) Median household income (in euros), (2) 101
Density of household with standard of living below poverty line (= number of household with 102
standard of living below poverty line / IRIS area in ha), (3) Density of rent-controlled housing 103
(HLM) (= number of HLM / IRIS area in ha), (4) proportion of immigrants in the population 104
(= number of immigrants / total number of IRIS inhabitants), (5) ratio of house owners to 105
tenants (= number of owner-occupied primary residences / number of non-owner occupied 106
primary residences), (6) ratio of unemployed to active people (= number of unemployed people 107
aged 15 and older / number of employed people aged 15 and older), (7) ratio of blue collar to 108
white collar (number of blue collar workers aged 15 and older / number of white collar workers 109
aged 15 and older), and (8) ratio of households without car to households with cars (= number 110
of households without a car / number of households with a car). 111
112
2.3. Quantification of UGS and UES 113
Three UES provided by public urban trees were selected: atmospheric carbon reduction, 114
surface runoff mitigation, and air pollution removal. The three UES are considered as the most 115
important in terms of distributional EJ (Amini Parsa et al. 2019; Baró et al. 2019). While 116
production and benefits of surface runoff mitigation and air pollution removal are mostly local 117
effects, atmospheric carbon reduction affects global climate regulation (Fisher et al. 2009). 118
Numerous other local urban ecosystem services that impact human well-being are affected by 119
local leaf area and biomass, such as building energy use and thermal comfort (Graça et al. 120
2018). Although it affects global climate regulation, it is of interest to study the carbon storage 121
and sequestration by trees in urban areas since they are more vulnerable to climate change and 122
where adaptation strategies should be developed (Amini Parsa et al. 2019). Producing 123
7 information about the distribution of this UES may contribute to enhanced climate justice even 124
at the local scale (Srang-iam 2011). 125
126
The three UES were assessed using i-Tree Eco model that provides information about 127
forest structure and benefits (Nowak et al. 2008; www.itreetools.org). i-Tree Eco guidelines (i-128
Tree Eco User’s Manual 2013) were followed to define the sample size and field survey 129
protocol to collect municipal urban forest data. The sampling design and data collection were 130
carried out by delimiting and stratifying public UGS within land-use classes, assessing tree 131
cover within public UGS, generating field samples, and collecting field data 132
The city and its public green spaces were stratified into 8 land-use classes based on 133
1:10000 land-cover database of the Alsace region provided for 2008 by the ‘‘Cooperation for 134
Geographic Information System in Alsace’’ (CIGAL). Using the 2010 map of public green 135
spaces provided the City Council of Strasbourg (EMS), 228 circular 11 m-radius plots (0.04 ha) 136
were selected. Study plots were distributed randomly within public green spaces using random 137
plot generation functionality of Arcgis (by generating x and y coordinates) and following the 138
model documentation (see Selmi et al. 2016). 139
The field survey was conducted during the leaf-on season of 2013. At each plot, general 140
information (date, plot address, GPS coordinates, land use, tree and shrub cover, ground cover 141
and plantable space) were recorded, as well as individual tree data (species, diameter at breast 142
height (DBH), total tree height, crown width, height to base of live crown, crown light exposure, 143
crown dieback percent, percent crown missing). 144
Local hourly pollution data were obtained from the regional Air Quality Agency (Atmo-145
Est). These data were measured at six monitoring stations located within the study area over a 146
one-year period (from July 2012 to June 2013). Concentrations of carbon monoxide (CO), 147
nitrogen dioxide (NO2), sulfur dioxide (SO2), ground-level ozone (O3), particulate matter of
8 less than 2.5 μm (PM2.5) and particulate matter between 2.5 μm and 10 μm (PM10 coarse) were
149
calculated as averages values from the six monitoring stations. Weather data (wind speed, 150
precipitation, temperature, etc.) were retrieved from “Météo France” (two stations within the 151
study area) and one station of the National Oceanic and Atmospheric Administration (NOAA) 152
located at Strasbourg city. 153
The collected field and environmental data were combined in i-Tree Eco v5 to assess 154
basic structural information (e.g., tree density, species composition) and three UES: air 155
purification (dry deposition indicator), atmospheric carbon reduction (carbon storage and 156
sequestration indicators) and surface runoff mitigation (avoided runoff indicator). The average 157
rates of all UES per tree cover (i.e., g m-2 or m3 m-2) were calculated for each land-use class.
158
Following UES environmental justice literature (Dobbs et al. 2014; McPhearson et al. 2013; 159
Baró et al. 2019), the aggregated index was calculated to quantify UES at each IRIS following 160
the formula: 161
UESi (g) (IRIS scale) = ∑ (tree cover per land-use class j (m2) × Average of UES i per
162
tree cover per land-use class j (g m-2 or m3 m-2)). The IRIS value was then divided by the area
163
of the corresponding IRIS to obtain a relative measure of that UES metric (UES m-2).
164
165
2.4.Statistical analysis 166
Separate Principal Component Analyses (PCA) were conducted on the three sets of 167
variables (socioeconomic, UGS, and UES) to summarize the original variables into a few 168
components. Only components with eigenvalues exceeding 1 were retained (Vyas and 169
Kumaranayake 2006). PCA provided three composite indices of social deprivation, UGS 170
parameters and, UES delivery (see results). 171
9 A classification was further conducted according to social deprivation and UES delivery 173
indices to identify vulnerable areas (i.e. areas with high deprivation and low UES delivery). 174
The three classes (high, moderate and low) were identified based on the mean of UES and 175
deprivation indices ± ½ standard deviation (Faburel et Guymard 2008). The combination of 176
deprivation and UES classifications provided nine categories that were mapped using 177
Geographic Information using Esri's ArcGIS for Desktop 10.5. 178
Since study units were locations, spatial autocorrelation, and hence statistical non-179
independence among observations (Legendre and Legendre 1998; Rangel et al. 2006) could 180
occur. Spatial autocorrelation among indices of deprivation, UGS parameters, and UES 181
delivery was checked for using Moran's correlograms (Legendre and Legendre 1998). The 182
studied IRISs were organized into 10 equifrequent classes of geographic distance, with a lag 183
ranging from 0.527 to 2.897 km and sample size of 872 pairs of IRISs per class. For each 184
distance class, a Moran’s I autocorrelation coefficient was calculated and tested for significance 185
using 999 permutations. A correlogram was then obtained by plotting the Moran’s I values 186
against the upper boundaries of the corresponding distance classes, and the significance of the 187
whole correlogram was assessed by applying the Bonferroni correction for multiple tests 188
(Legendre and Legendre 1998). These spatial autocorrelation analyses were carried out using 189
SAM software 4.0 (Rangel et al. 2006). 190
The significance of social deprivation as a predictor of green space cover and UES 191
delivery was investigated using simple linear regressions. These regressions were performed 192
using Ordinary Least Square (OLS) models assuming independence among model residuals. 193
Spatial models were also run that considered model residuals as correlated and their covariance 194
as a function of the geographic distance between pairs of sites; Generalized Least Square (GLS) 195
models (Cressie 1993; Rangel et al. 2006). The competing non-spatial and spatial models were 196
then compared according to their AICc (Akaike Information Criteria corrected for small sample 197
10 size) and R2. The best model was the one having the lowest AICc and highest R2 values (Rangel
198
et al. 2006). These regression analyses were performed using SAM software 4.0 (Rangel et al. 199
2006). 200
3. Results 201
3.1. General results about social deprivation and UES delivery 202
The first component extracted from a PCA on the original socioeconomic variables has 203
an eigenvalue of 5.26 and explains 66% of the variance of the original data set, corresponding 204
to an increasing axis of social deprivation (Table 1). However, the second component has an 205
eigenvalue less than 1 (0.79) and is not retained. 206
Twenty-eight IRISs are characterized as having the best living condition, where only 207
12% of households live below the poverty line, 88% of the population has a job and only 4% 208
of houses are rent-controlled. Conversely, the high deprivation class contains 33 IRISs that are 209
characterized by a high average of households who live below the poverty line (38%) and a 210
high percentage of immigrants (47%). 211
Descriptive statistics of UGS and UES parameters for the 94 IRIS are shown in Table 212
1. Average green spaces cover and tree cover across all IRIS are 14.7% and 5.7 % respectively. 213
Average species number and tree density are 114 species and 23 trees ha-1 respectively. The
214
conducted PCA reduces UGS variables into one component accounting for 75% of the variance 215
(eigenvalue = 3.02), while the second component has an eigenvalue of 0.73. The first 216
component is positively correlated with all original variables, thus providing a composite index 217
of UGS characteristics (Table 1). 218
UES provided by public urban trees in Strasbourg city during 2013 are estimated to 219
128000 t and 4000 kg C year-1 of stored and sequestered carbon respectively, 88 t year-1 of
220
removed air pollutants including 1.2 t year−1 of CO, 13.8 t year−1 of NO2, 55.9 t year−1 of O3;
221
11.8 t year−1 of PM10, 4.5 t year−1 of PM2.5 and 1.0 t year−1 of SO2 (Note: PM10 estimates exclude
11 PM2.5 particles) and 24 160 m³ year-1 of avoided runoff. A PCA summarizes the investigated
223
UES into a single composite index (first component) that explains 99% of the total variance 224
and has an eigenvalue of 8.92. In contrast, the second component has an eigenvalue of 0.07. 225
The composite index derived from this PCA is positively correlated with all original variables 226
(Table 1), indicating that high scores correspond to areas with increased delivery of UES. 227
12 Table 1. List of assessed socioeconomic, green space and ecosystem service variables among IRISs, with descriptive statistics and correlations (Pearson 228
correlation coefficient) with the indices derived from the Principal Component Analyses (sample size = 94 IRIS). 229
Variables Range Mean SD Correlation test
Constructed index
r P
Socio-economic variables
Median household income (euros) 10 847–38,290 19 228 5495 -0.799 < 0.0001
Deprivation index Density of household with standard of living below poverty
line (number ha-1) 0–0.04 0.01 0.01 0.941 < 0.0001
Density of rent-controlled housing (HLM) (number ha-1) 0–89.61 10.89 16.01 0.730 < 0.0001 Proportion of immigrants in the population 0.05–0.40 0.20 0.08 0.808 < 0.0001 Ratio of house owners to tenants 0–3.99 0.53 0.59 -0.575 < 0.0001 Ratio of unemployed to active people 0.06–0.95 0.27 0.18 0.916 < 0.0001 Ratio of blue collar to white collar 0.05–60.68 4.389.19 0.765 < 0.0001 Ratio of households without car to households with cars 1.25–7.14 2.490.99 0.893 < 0.0001 UGS variables
Cover of green areas (%) 0 –68.30 16.80 15.30 0.917 < 0.0001
Urban
vegetation index
Number of species 17–671 114 108 0.602 < 0.0001
Tree density (trees ha-1) 0.25–182.29 23.22 27.77 0.941 < 0.0001
Tree cover (%) 0–44 5.70 7.50 0.962 < 0.0001 UES variables Atmospheric carbon reduction Carbon storage (kg ha-1) 0.32–36 058 7160 8195 0.994 < 0.0001 Ecosystem services delivery index
Carbon sequestration (kg ha-1year-1) 0.01–1126 203 230 0.976 < 0.0001 Surface runoff
mitigation Avoided runoff (m³ ha-1) 0–9.76 1.54 1.85 0.994 < 0.0001
Air purification CO removal (g ha-1) 0–447 79 91 0. 999 < 0.0001 NO2 removal (g ha-1) 0–5146 912 1047 0. 999 < 0.0001 O3 removal (g ha-1) 0–20774 3682 4226 0. 999 < 0.0001 PM10 removal (g ha-1) 0 –4374 775 890 0. 999 < 0.0001 PM2.5 removal (g ha-1) 0–1676 297 341 0. 999 < 0.0001 SO2 removal (g ha-1) 0–385 68 78 0. 999 < 0.0001 230
13 Twenty-four IRISs have a high level of UES delivery; 90% of tree cover and 82% of 231
green spaces are concentrated in these 24 IRISs. IRISs with high UES delivery produce about 232
88% of the total amount of UES in Strasbourg followed by IRISs with moderate delivery (10%) 233
and low delivery (2%). Relative UES delivery (normalized per area) is important in high 234
delivery areas except for air pollution removal, which is slightly higher in low delivery areas. 235
This difference is due to the variations of tree cover. For instance, in high delivery class 236
sequestered carbon is about 696 kg ha-1 and removed pollution is about 6 g m-2 (of tree cover).
237
In contrast, trees sequestered about 42 kg ha-1 of carbon and removed about 7.5 g m-2 of air
238
pollutants in low delivery class. However, the total amount of pollutant reduction is fifty times 239
greater in the high delivery class than the low class. This is due to the greater area and greater 240
percentage of tree cover (25 % of high delivery class is covered by trees while cover percentage 241
within low delivery class not exceed 2 %). Low-delivery areas are typically located in the 242
historic center and the Midwestern area of the city, which is dominated by industrial areas with 243
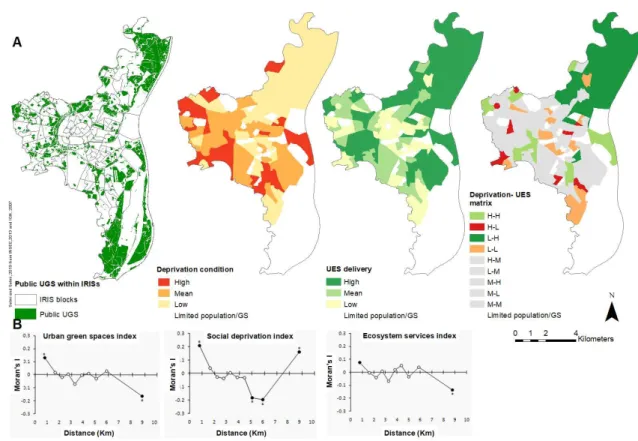
low tree cover (Fig. 1a). 244
14 246
Figure 1. (A) Ecosystem services delivery, deprivation and combined (deprivation-UES) distribution maps 247
within Strasbourg. H-M through L-M were mapped with the same symbol as we want to highlight 248
extreme combinations. (B) Moran's I correlograms of the three indices in the 94 studied IRISs. Significant 249
Moran's I values at the 0.05 level are highlighted in bold. Asterisk-marked symbols represent Moran's I 250
values significant at the Bonferroni corrected level of 0.05/10 = 0.005 251
3.2.Deprivation and UES delivery matrix 252
Comparisons of deprivation condition with UES delivery (Fig. 1a, Table 2) show that 9 253
IRISs are vulnerable (high deprivation and low UES delivery: H-L) where 97% of its housing 254
is apartment-type and only 1% of the area is covered by trees. Eleven IRISs are in deprived 255
condition and moderate UES delivery (H-M). These two classes (H-L and H-M) are located in 256
central districts and the extreme western fringe of the city (Fig. 1A). Conversely, 8 IRISs have 257
a high quality of life with low deprivation and high UES delivery (L-H). They are located on 258
the northern side of the city where 31 % of the total area was covered by trees. Population across 259
15 the two classes is almost equally distributed with 10% and 9.8% of the total population living 260
in vulnerable areas (H-L) and in areas with great quality of life (L-H) respectively. 261
Eight IRISs are considered as highly deprived and high producers of UES (H-H) with 262
13% of the total population living in these 8 IRISs. 14 IRISs have a low deprivation condition 263
and low UES production (L-L) where 13% of total inhabitants of the city is concentrated. 264
Table 2. Distribution of IRIS across the deprivation-ES delivery matrix. Parentheses in the first 265
row represent the percentage of IRISs and the parentheses in the second row represent the 266
percentage of the population 267
Deprivation
ES Low Moderate High Total
Low 14 (32.6) (39.1) 20 (46.5) (31.6) 9 (20.9) (29.7) 43 Moderate 11 (40.7) (65.7) 5 (18.5) (13.8) 11 (40,7) (20.7) 27 High 8 (33.3) (34.7) 8 (33.3) (38.7) 8 (33.3) (26.6) 24 Total 33 33 28 94 268
3.3. Spatial autocorrelation and relationships between social deprivation, green 269
space and UES parameters 270
Moran’s I correlograms show that the social deprivation, UGS, and UES indices exhibit 271
significant spatial autocorrelation (Fig. 1B). Of particular importance is the positive spatial 272
autocorrelation in the first distance class, i.e. pairs of IRISs less than 0.527 km from each other 273
(social deprivation index: I = 0.207, P < 0.001; UGS index: I = 0.131, P < 0.001; UES index: 274
I = 0.074; P = 0.043). IRISs close to each other show more similar levels of social deprivation, 275
UGS and UES delivery than predicted by a random distribution of these variables, reflecting 276
the ‘contagious’ nature of these parameters in the studied city. 277
278
This significant spatial autocorrelation would suggest that nearby IRISs could not be 279
considered as independent sampling units when investigating the relationships of social 280
deprivation with UGS and UES parameters. This finding is supported by the results of 281
16 regression analyses, which show that models accounting for spatial covariance among 282
observations provide better fit to the data than standard models that assumed independence 283
among model errors, based on AICc and R² values (see below). These regression models show 284
negative but still non-significant associations of social deprivation with both UGS (non-spatial 285
model: AICc = 272, R² = 0.1%; SE = - 0.020 0.104; t = - 0.193, P = 0.8470; spatial model: 286
AICc = 237, R² = 33%; SE = -0.107 0.103; t = - 1.043, P = 0.3000) and UES (non-spatial 287
model: AICc = 277, R² = 0.1%; SE = - 0.034 0.104; t = - 0.327, P = 0.7450; spatial model: 288 AICc = 247, R² = 26%; SE = - 0.099 0.114; t = - 0.870, P = 0.3870). 289 290 4. Discussion 291
We examined the distribution of UES delivery and whether it is associated with social 292
deprivation condition across census blocks in Strasbourg. Developing a spatial assessment 293
approach at this level is of interest because the majority of UES are produced at the local scale, 294
except for climate regulation which is provided at a larger scale (city, region, country) (Baró et 295
al. 2019). Thus, priorities of decision-making may change by acting on low provision areas and 296
protecting high provision ones. In agreement with Escobedo et al. (2011) and de Groot et al. 297
(2010), we argue that urban green patches are most affected by planning and management 298
decisions at the census block scale. However, the implication of different scales should be 299
considered because the relevance of UES could change among social groups and scales 300
depending on needs and local context. Also, managing urban vegetation and related ecosystem 301
services should be addressed in an integrative way by considering all impacts across temporal, 302
political, economic, and spatial scales (Escobedo et al. 2011, Andersson et al. 2019). 303
Unlike other studies carried out in Australia (Dobbs et al, 2014) and USA (Landry and 304
Chakraborty 2009), our results show no significant relationship between UES delivery and 305
social deprivation. This finding is in line with those previously reported in Barcelona (Baró et 306
17 al. 2019), where no association was found between ES distribution and household income. The 307
explanation of our results may rely on two assumptions. The first one is related to the fact that 308
our analysis was conducted on public green spaces where planting and managing decisions are 309
made regardless of the socioeconomic status of the neighborhood. This is in line with findings 310
of Kuras et al. (2020) that suggest that neutral relationship between socioeconomic status and 311
biodiversity, in general, occurs in public land uses. This raises the question whether local 312
policies are not interested in establishing a participatory approach or the residents do not feel 313
concerned by planting strategies of their neighborhood. More investigations are needed to 314
understand interactions between planners, managers and citizens and how they influence 315
greening decisions. The second potential explanation could be a possible difference in the speed 316
of change of green spaces compared to the socioeconomic situation of the population 317
concerned. Indeed, the spatial distribution of green spaces is not likely to evolve at the same 318
speed as the socioeconomic parameters of the population, as has previously been highlighted in 319
a New Zealand study on the relationship between green spaces and public health (Richardson 320
et al. 2010). 321
Nevertheless, there is one issue that raises particular concern related to the urban 322
mutation in Strasbourg at the mid and long terms, namely the gentrification (Gerber 1999; 323
Blanchard 2019). Municipal investments want to make the city uniform in terms of quality of 324
life. This uniformity can make it greener, but may increase property values which can displace 325
socioeconomically disadvantaged classes and exclude them from access to amenities 326
(Anguelovski et al. 2018). In New York (USA), the restoration of Prospect Park resulted in a 327
change of the socioeconomic status around the park toward socially advantaged population, 328
while in Barcelona, it was shown that gentrification took place in old industrial and desirable 329
neighborhoods, but not in the socially deprived neighborhood (Anguelovski et al. 2018). 330
18 Studying this process in Strasbourg will provide relevant information about the impact of 331
planning strategies (including greening strategies) on creating (or not) new inequities. 332
333
The trend of negative association between ES delivery and social deprivation in 334
Strasbourg city may be visible over a more extended period, with taking into account the 335
consequences of gentrification and interactions between the city and surrounding villages. 336
Further research should investigate shifts in historical expansion of the city, population 337
demography, socioeconomic status across neighborhoods to better understand the link between 338
UES delivery and deprivation conditions over time. This research could help substantiate the 339
idea of Pickett et al. (2008), who argued that the ecological dynamic within a city is slower than 340
the social dynamics. Thus, the ecological structure of a particular neighborhood may reflect a 341
previous social structure, not the existing one. 342
Our approach not only demonstrates the absence of a relationship between ES delivery 343
and social deprivation, but also detects their spatial distribution including vulnerable areas (i.e. 344
low ES provision and high social deprivation) and advantaged areas (i.e. high ES provision and 345
low social deprivation). In our case, it is also important to notice that descriptive analyses show 346
that the number of deprived neighborhoods with high UES is not negligible, which is consistent 347
with findings in other European cities like Porto (Graça et al. 2017), Barcelona (Baró et al. 348
2019) and Paris (Cohen et al. 2012). This neutral relationship may be explained by the planning 349
trends that facilitate greening actions and thus, UES provision across time (Kuras et al. 2020). 350
In Strasbourg, major urban projects were carried out in the urban fringe between 1950 and 1970 351
that represented the core of the social housing urban fabric of the city. At that time, those 352
neighborhoods were designed toward a predefined percentage of 10 to 40% of green spaces 353
(POS 1979), which explains the observed high level of UES delivery. Consequently, other 354
mechanisms like urban policies and landscape structure seem to have an impact on UES 355
19 delivery and should be studied to identify factors that spatially influence ecosystem services 356
distribution. 357
As demonstrated by other findings (Dobbs et al. 2014; Wilkerson et al. 2018), studying 358
the link between landscape structure and UES distribution gives insights on the consequences 359
of planning strategies on ecosystem services provision. These strategies, which have to be 360
sustainable, should include actions to improve the quantity, the distribution and the connection 361
between green spaces to equitably increase ecosystem services provision and hence to ensure a 362
balance between social and ecological health within the city. 363
UGS within socially-deprived neighborhoods where high population density occurs 364
may be faced with over-use. In addition to maintaining current UES potential, management 365
planning in those neighborhoods could focus on environmental quality drivers like recreational 366
facilities, diversified vegetation features, and maintenance types. Moreover, daily experiences 367
and perceptions of users could be taken into account to help green spaces services meet resident 368
needs (Hoffimann et al. 2017). Improved residents’ awareness about nearby UGS and its 369
services could encourage support for its development and maintenance. It could also help build 370
community cohesion by recognizing local community power and expertise, which facilitates 371
the involvement of residents into the local decision-making process (Lovell and Taylor 2013). 372
High and moderate UES provisions were generally located within the green belt of the 373
city that is entirely included within the so-called “Urban Natural Park”. This park resides within 374
the deprived districts “Elsau”, “Koenigshoffen” and “Montagne verte” and surrounds the 375
central core of the city. One issue of concern is that 20% of the green belt could be built in the 376
future. Protecting this resource by reducing development can help preserve the current UES 377
flow. Enhancing the connectivity of green spaces within the green belt could also connect 378
neighborhoods of different socioeconomic levels, improve social mixing, and provide equitable 379
access to UES among different social categories. New urban projects in proposed development 380
20 areas should address the gentrification risk to ensure equal opportunities to a healthy 381
environment among various socioeconomic classes. Urban policies could go beyond 382
distributional justice to procedural justice to involve different social classes in making 383
connections among neighborhoods. 384
Spatial results of areas with high or low UES delivery could be crossed with the zoning 385
of the local urbanism plan (PLU) to better inform on the risk of environmental degradation if 386
future development occurs. For instance, few high UES provision patches were located within 387
areas assigned to future urbanization. In this case, strategies to maintain UES provision in these 388
areas could be investigated (Baró et al. 2016). Conversely, areas assigned to urbanization with 389
low UES provision could represent an opportunity to create sustainable urban projects that 390
support social mix, meet social needs, and enhance UES. According to existing literature, 391
addressing these issues is still challenging for urban renewal policies (Anguelovski and 392
Martinez Alier 2014; Chen and Yonh Hu 2015). 393
Studying UES from the EJ perspective may produce information stating an equitable 394
distribution of services provided by UGS. While approaches that can holistically quantify UES 395
are needed (Dobbs et al. 2014; Riley and Gardiner 2019), it may also be of interest to analyze 396
only the most easily measured variable, most relevant for local policies, or the most needed by 397
citizens and use it as a proxy for all UES only if a strong correlation is found between them, 398
which is our case. Although the correlation is demonstrated for the three quantified services, 399
the link between these services and others such as cultural services or temperature reduction 400
services should be explored to have a relatively global vision of the potential of vegetation to 401
produce benefits for the population. Furthermore, decision-makers could go beyond 402
characterizing the non-significant disparity in UES distribution and move into identifying 403
vulnerable neighborhoods and establishing priorities. 404
21 In sum, our study does not reveal a direct relationship between socioeconomic status 405
and the distribution of UES provision in Strasbourg city. To have a complete vision of UES 406
and meet local needs, studies could investigate the impact of socioeconomic factors on the 407
demand of UES and the relationship between supply and demand of UES (Baró et al. 2015; 408
Larondelle and Lauf 2016). Wilkerson et al. (2018) report that socially advantaged population 409
prioritizes recreational services instead of regulation services or production services. Given our 410
results, does social deprivation mean high demand for UES in Strasbourg city? How does 411
socioeconomic status influence perception and behaviors? 412
5. Research limitations 413
The estimation of UES production by i-Tree Eco was analyzed by land-use classes and 414
disaggregated into the IRIS level. This limitation could be overcome with an increased sampling 415
that would provide enough plot data to analyze results by IRIS. Multiple models run with locally 416
specific weather, and pollution data could increase local specificity of the analyses, but these 417
data are currently lacking. 418
419
This study focused on the IRIS level with varying area. Variables were converted to 420
density, proportion, and ratios for all IRISs to normalize the area. Dividing the city into equal 421
spatial units could be interesting to reduce the sensitivity of results to IRISs areas. A multi-scale 422
study could be more effective to understand different synergies between UES and to connect 423
local and regional actors. 424
Only tree cover and green spaces densities were analyzed. However, other factors could 425
influence the provision of UES such as age, diameter, green spaces area, and the total number 426
of trees (Dobbs et al. 2014). Further research is needed to understand better interactions between 427
structural variables, ES flow and socioeconomic status. Similarly, only regulation services were 428
examined in this study. These services mainly depend on tree cover as it presents the ecological 429
22 reservoir that ensures their production. However, the distribution of other categories of services 430
such as cultural services may not be associated with tree cover but rather with perception, use, 431
accessibility, etc. (Riley and Gardiner 2019). 432
In this study only public green spaces have been considered. However, private green 433
spaces, such as private gardens, cemeteries, allotment gardens and schools’ gardens, may also 434
contribute to total UES provision in the city. Although these private green spaces are not easily 435
controlled by urban managers, their connection with public spaces to benefit from their 436
ecological potential would be an interesting path to explore through the environmental justice 437
framework. In addition, it would also be interesting to verify whether there is compensation 438
between the UES produced by private spaces and the UES produced by public green spaces 439
(i.e. verify whether the neighborhoods with low public green spaces and low ES provision have 440
more access to private gardens and their associated ES). 441
442
Finally, the main challenge of this study was the combination of socioeconomic and 443
ecological indicators. Composite indicators were created and classified into low, moderate, and 444
high clusters according to mean and standard deviation values. The aim was to simplify the 445
information, but it would be interesting to study the impact of each socioeconomic indicator on 446
each UES. Extensive research is also needed to define a mapping method that is transferable 447
and easy for decision-makers to use. 448
449
6. Conclusion 450
This study used a spatially explicit approach to visualize the distribution of UES across 451
socioeconomic conditions in Strasbourg, France. Using tools that connect UES to a social 452
context is useful to identify priority areas where enhancing UES and social justice are needed. 453
Urban policies could prioritize areas with high deprivation and low UES provision by defining 454
23 strategies that improve the quality and/or the number of green spaces, optimize UES and foster 455
the connection between population and local green spaces. Distributive environmental justice 456
studies could be followed by investigations of interactional and procedural justice that aim to 457
highlight the personal experiences of populations and their involvement in the decision-making 458
process. Comparing results with perceived access to UES according to the socioeconomic 459
condition of the population can help to identify the well-being demand in the city. A key 460
challenge of this work is to integrate outcomes of UES mapping into decision-making processes 461
that support future urban planning strategies and are consistent with social needs and 462
environmental restoration of the city. Considering environmental justice patterns associated 463
with UES in current urban policies may impact the interactions between society and semi-464
natural ecosystems within the city in the future. 465
Acknowledgements 466
This work was supported by ‘‘Institution de la Recherche et de l’Enseignement Supérieur 467
Agricoles (IRESA-Tunisia), ‘Zone Atelier Environnementale Strasbourg’ (ZAEU) and 468
‘‘Eurométropole de Strasbourg’’ (EMS). 469
References 470
ADEUS. 2018. Plan Climat Air Energie territorial de l’Eurométropole de Strasbourg. 471
Diagnostic et evolution de la situation Climat Air Energie, Strasbourg, France. 472
Agyeman, J., R. D. Bullard, and B. Evans. 2002. Exploring the Nexus: Bringing Together 473
Sustainability, Environmental Justice and Equity. Space and Polity 6: 77–90. 474
doi:10.1080/13562570220137907. 475
Amini Parsa, V., E. Salehi, A. R. Yavari, and P. M. van Bodegom. 2019. An improved method 476
for assessing mismatches between supply and demand in urban regulating ecosystem 477
services: A case study in Tabriz, Iran. Edited by Ali Kharrazi. PLOS ONE 14: e0220750. 478
doi:10.1371/journal.pone.0220750. 479
24 Andersson, E., J. Langemeyer, S. Borgström, T. McPhearson, D. Haase, J. Kronenberg, D. N. 480
Barton, M. Davis, et al. 2019. Enabling Green and Blue Infrastructure to Improve 481
Contributions to Human Well-Being and Equity in Urban Systems. BioScience 69: 566– 482
574. doi:10.1093/biosci/biz058. 483
Anguelovski, I., J. J. T. Connolly, L. Masip, and H. Pearsall. 2018. Assessing green 484
gentrification in historically disenfranchised neighborhoods: a longitudinal and spatial 485
analysis of Barcelona. Urban Geography 39: 458–491. 486
doi:10.1080/02723638.2017.1349987. 487
Anguelovski, I., and J. Martínez Alier. 2014. The ‘Environmentalism of the Poor’ revisited: 488
Territory and place in disconnected glocal struggles. Ecological Economics 102: 167–176. 489
doi:10.1016/j.ecolecon.2014.04.005. 490
Atmo GRAND-EST, 2018. Bilan de la qualité de l’air. 2018. Retrieved 10 March, 2020, from 491
http://www.atmo-grandest.eu/sites/prod/files/2019-12/BQA2018_indice2.pdf 492
Baró, F., D. Haase, E. Gómez-Baggethun, and N. Frantzeskaki. 2015. Mismatches between 493
ecosystem services supply and demand in urban areas: A quantitative assessment in five 494
European cities. Ecological Indicators 55: 146–158. doi:10.1016/j.ecolind.2015.03.013. 495
Baró, F., A. Calderón-Argelich, J. Langemeyer, and J. J. T. Connolly. 2019. Under one canopy? 496
Assessing the distributional environmental justice implications of street tree benefits in 497
Barcelona. Environ Sci Policy 102: 54–64. doi:10.1016/j.envsci.2019.08.016. 498
Baró, F., I. Palomo, G. Zulian, P. Vizcaino, D. Haase, and E. Gómez-Baggethun. 2016. 499
Mapping ecosystem service capacity, flow and demand for landscape and urban planning: 500
A case study in the Barcelona metropolitan region. Land Use Policy 57: 405–417. 501
doi:10.1016/j.landusepol.2016.06.006. 502
Blanchard, N. Etude du phénomène dʼembourgeoisement à lʼœuvre dans un quartier en 503
mutation à Strasbourg: 19. 504
25 Boone, C. G., and M. Fragkias, ed. 2013. Urbanization and Sustainability. Dordrecht: Springer 505
Netherlands. doi:10.1007/978-94-007-5666-3. 506
Boyce, J. K., K. Zwickl, and M. Ash. 2016. Measuring environmental inequality. Ecological 507
Economics 124: 114–123. doi:10.1016/j.ecolecon.2016.01.014. 508
Brown, A., A. Dayal, and C. Rumbaitis Del Rio. 2012. From practice to theory: emerging 509
lessons from Asia for building urban climate change resilience. Environment and 510
Urbanization 24: 531–556. doi:10.1177/0956247812456490. 511
Chen, W. Y., and F. Z. Y. Hu. 2015. Producing nature for public: Land-based urbanization and 512
provision of public green spaces in China. Applied Geography 58: 32–40. 513
doi:10.1016/j.apgeog.2015.01.007. 514
Cohen, M., R. Baudoin, M. Palibrk, N. Persyn, and C. Rhein. 2012. Urban biodiversity and 515
social inequalities in built-up cities: New evidences, next questions. The example of Paris, 516
France. Landscape and Urban Planning 106: 277–287. 517
doi:10.1016/j.landurbplan.2012.03.007. 518
Cressie, N.A.C. 1993. Statistics for spatial data. Wiley-Interscience Publications, New York. 519
de Groot, R. S., R. Alkemade, L. Braat, L. Hein, and L. Willemen. 2010. Challenges in 520
integrating the concept of ecosystem services and values in landscape planning, 521
management and decision making. Ecological Complexity 7: 260–272. 522
doi:10.1016/j.ecocom.2009.10.006. 523
Dobbs, C., D. Kendal, and C. R. Nitschke. 2014. Multiple ecosystem services and disservices 524
of the urban forest establishing their connections with landscape structure and 525
sociodemographics. Ecological Indicators 43: 44–55. doi:10.1016/j.ecolind.2014.02.007. 526
EFESE. 2018. Les écosystèmes urbains. Retrieved 5 April, 2019, from 527
https://www.ecologie.gouv.fr/levaluation-francaise-desecosystemes-et-des-services-528
ecosystemiques. 529
26 Ernstson, H., S. Barthel, E. Andersson, and S. T. Borgström. 2010. Scale-crossing brokers and 530
network governance of urban ecosystem services: The case of stockholm. Ecology and 531
Society 15. doi:10.5751/ES-03692-150428. 532
Escobedo, F. J., N. Clerici, C. L. Staudhammer, and G. T. Corzo. 2015. Socio-ecological 533
dynamics and inequality in Bogotá, Colombia’s public urban forests and their ecosystem 534
services. Urban Forestry and Urban Greening 14: 1040–1053. 535
doi:10.1016/j.ufug.2015.09.011. 536
Escobedo, F. J., V. Giannico, C. Y. Jim, G. Sanesi, and R. Lafortezza. 2019. Urban forests, 537
ecosystem services, green infrastructure and nature-based solutions: Nexus or evolving 538
metaphors? Urban Forestry & Urban Greening 37. Green Infrastructures: Nature Based 539
Solutions for Sustainable and Resilient Cities: 3–12. doi:10.1016/j.ufug.2018.02.011. 540
Escobedo, F. J., T. Kroeger, and J. E. Wagner. 2011. Urban forests and pollution mitigation: 541
Analyzing ecosystem services and disservices. Environmental Pollution 159. Selected 542
Papers from the Conference Urban Environmental Pollution: Overcoming Obstacles to 543
Sustainability and Quality of Life (UEP2010), 20-23 June 2010, Boston, USA: 2078– 544
2087. doi:10.1016/j.envpol.2011.01.010. 545
Faburel, G., and S. Gueymard. 2008. Inégalités environnementales en région Île-de-France : le 546
rôle structurant des facteurs négatifs de l’environnement et des choix politiques afférents. 547
Espace populations sociétés. Space populations societies: 159–172. 548
doi:10.4000/eps.2477. 549
Fisher, B., R. K. Turner, and P. Morling. 2009. Defining and classifying ecosystem services for 550
decision making. Ecological Economics 68: 643–653.
551
doi:10.1016/j.ecolecon.2008.09.014. 552
Gerber, P. 1999. Processus de gentrification et demande sociale citadine. Exemple du centre-553
ville de Strasbourg. Revue Géographique de l’Est 39. 554
27 Graça, M. S., J. F. Gonçalves, P. J. M. Alves, D. J. Nowak, R. Hoehn, A. Ellis, P. Farinha-555
Marques, and M. Cunha. 2017. Assessing mismatches in ecosystem services proficiency 556
across the urban fabric of Porto (Portugal): The influence of structural and socioeconomic 557
variables. Ecosystem Services 23: 82–93. doi:10.1016/j.ecoser.2016.11.015. 558
Graça, M., P. Alves, J. Gonçalves, D. J. Nowak, R. Hoehn, P. Farinha-Marques, and M. Cunha. 559
2018. Assessing how green space types affect ecosystem services delivery in Porto, 560
Portugal. Landscape and Urban Planning 170: 195–208. 561
doi:10.1016/j.landurbplan.2017.10.007. 562
Greenberg, M., and M. Cidon. 1997. Broadening the definition of environmental equity: A 563
framework for states and local governments. Population Research and Policy Review 16: 564
397–413. doi:10.1023/A:1005702430607. 565
Grove, J. M., A. R. Troy, J. P. M. O’Neil-Dunne, W. R. Burch, M. L. Cadenasso, and S. T. A. 566
Pickett. 2006. Characterization of Households and its Implications for the Vegetation of 567
Urban Ecosystems. Ecosystems 9: 578–597. doi:10.1007/s10021-006-0116-z. 568
Havard, S., S. Deguen, J. Bodin, K. Louis, O. Laurent, and D. Bard. 2008. A small-area index 569
of socioeconomic deprivation to capture health inequalities in France. Social Science & 570
Medicine 67: 2007–2016. doi:10.1016/j.socscimed.2008.09.031. 571
Heynen, N., H. A. Perkins, and P. Roy. 2006. The Political Ecology of Uneven Urban Green 572
Space: The Impact of Political Economy on Race and Ethnicity in Producing 573
Environmental Inequality in Milwaukee. Urban Affairs Review 42: 3–25. 574
doi:10.1177/1078087406290729. 575
Hoffimann, E., H. Barros, and A. Ribeiro. 2017. Socioeconomic Inequalities in Green Space 576
Quality and Accessibility—Evidence from a Southern European City. International 577
Journal of Environmental Research and Public Health 14: 916. 578
doi:10.3390/ijerph14080916. 579
28 INSEE. 2016. Recensement de la population. 2013. Retrieved 1 January, 2019, from 580
https://insee.fr/fr/accueil 581
i-Tree Eco User’s Manual. 2013. Retrieved 23 January, 2013, from 582
https://www.itreetools.org/resources/manuals/EcoManualv5.pdf :
583
http://www.itreetools.org/resources/archives. 584
Jenerette, G. D., S. L. Harlan, W. L. Stefanov, and C. A. Martin. 2011. Ecosystem services and 585
urban heat riskscape moderation: water, green spaces, and social inequality in Phoenix, 586
USA. Ecol Appl 21: 2637–2651. 587
Jensen, R., J. Gatrell, J. Boulton, and B. Harper. 2005. Using Remote Sensing and Geographic 588
Information Systems to Study Urban Quality of Life and Urban Forest Amenities. Ecology 589
and Society 9. doi:10.5751/ES-01201-090505. 590
Kremer, P., Z. Hamstead, D. Haase, T. McPhearson, N. Frantzeskaki, E. Andersson, N. 591
Kabisch, N. Larondelle, et al. 2016. Key insights for the future of urban ecosystem services 592
research. Ecology and Society 21. 593
Kruize, H., P. P. J. Driessen, P. Glasbergen, and K. van Egmond. 2007. Environmental Equity 594
and the Role of Public Policy: Experiences in the Rijnmond Region. Environmental 595
Management 40: 578–595. doi:10.1007/s00267-005-0378-9. 596
Kuras, E. R., P. S. Warren, J. A. Zinda, M. F. J. Aronson, S. Cilliers, M. A. Goddard, C. H. 597
Nilon, and R. Winkler. 2020. Urban socioeconomic inequality and biodiversity often 598
converge, but not always: A global meta-analysis. Landscape and Urban Planning 198: 599
103799. doi:10.1016/j.landurbplan.2020.103799. 600
Lakes, T., M. Brückner, and A. Krämer. 2014. Development of an environmental justice index 601
to determine socio-economic disparities of noise pollution and green space in residential 602
areas in {Berlin}. Journal of Environmental Planning and Management 57: 538–556. 603
doi:10.1080/09640568.2012.755461. 604
29 Landry, S. M., and J. Chakraborty. 2009. Street Trees and Equity: Evaluating the Spatial 605
Distribution of an Urban Amenity. Environment and Planning A: Economy and Space 41: 606
2651–2670. doi:10.1068/a41236. 607
Larondelle, N., and S. Lauf. 2016. Balancing demand and supply of multiple urban ecosystem 608
services on different spatial scales. Ecosystem Services 22: 18–31. 609
doi:10.1016/j.ecoser.2016.09.008. 610
Legendre, P., and L. Legendre. 1998. Numerical Ecology, Volume 24 - 2nd Edition. 611
Lovell, S. T., and J. R. Taylor. 2013. Supplying urban ecosystem services through 612
multifunctional green infrastructure in the United States. Landscape Ecology 28: 1447– 613
1463. doi:10.1007/s10980-013-9912-y. 614
Martinuzzi, S., O. M. Ramos‐González, T. A. Muñoz‐Erickson, D. H. Locke, A. E. Lugo, and 615
V. C. Radeloff. 2018. Vegetation cover in relation to socioeconomic factors in a tropical 616
city assessed from sub-meter resolution imagery. Ecological Applications 28: 681–693. 617
doi:10.1002/eap.1673. 618
McPhearson, T., P. Kremer, and Z. A. Hamstead. 2013. Mapping ecosystem services in New 619
York City: Applying a social–ecological approach in urban vacant land. Ecosystem 620
Services 5: 11–26. doi:10.1016/j.ecoser.2013.06.005. 621
Nowak, D.J., D.E. Crane, J.C. Stevens, R.E. Hoehn, J.T. Walton, and J. Bond. 2008. A ground-622
based method of assessing urban forest structure and ecosystem services. Arboriculture 623
and Urban Forestry 34: 347–358. 624
Pham, T.-T.-H., P. Apparicio, A.-M. Séguin, S. Landry, and M. Gagnon. 2012. Spatial 625
distribution of vegetation in Montreal: An uneven distribution or environmental inequity? 626
Landscape and Urban Planning 107: 214–224. doi:10.1016/j.landurbplan.2012.06.002. 627
Pickett, S. T. A., M. L. Cadenasso, J. M. Grove, P. M. Groffman, L. E. Band, C. G. Boone, W. 628
R. Burch, C. S. B. Grimmond, et al. 2008. Beyond Urban Legends: An Emerging 629
30 Framework of Urban Ecology, as Illustrated by the Baltimore Ecosystem Study. 630
BioScience 58: 139–150. doi:10.1641/B580208. 631
Raddatz, L., and J. Mennis. 2013. Environmental Justice in Hamburg, Germany. The 632
Professional Geographer 65: 495–511. doi:10.1080/00330124.2012.700500. 633
Rangel, T. F. L. V. B., J. A. F. Diniz-Filho, and L. M. Bini. 2006. Towards an integrated 634
computational tool for spatial analysis in macroecology and biogeography. Global 635
Ecology and Biogeography 15: 321–327. doi:10.1111/j.1466-822X.2006.00237.x. 636
Richardson, E., J. Pearce, R. Mitchell, P. Day, and S. Kingham. 2010. The association between 637
green space and cause-specific mortality in urban New Zealand: an ecological analysis of 638
green space utility. BMC Public Health 10: 240. doi:10.1186/1471-2458-10-240. 639
Riley, C. B., and M. M. Gardiner. 2020. Examining the distributional equity of urban tree 640
canopy cover and ecosystem services across United {States} cities. PLOS ONE 15: 641
e0228499. doi:10.1371/journal.pone.0228499. 642
Schüle, S. A., L. K. Hilz, S. Dreger, and G. Bolte. 2019. Social Inequalities in Environmental 643
Resources of Green and Blue Spaces: A Review of Evidence in the WHO European 644
Region. Int J Environ Res Public Health 16. doi:10.3390/ijerph16071216. 645
Selmi, W., C. Weber, E. Rivière, N. Blond, L. Mehdi, and D. Nowak. 2016. Air pollution 646
removal by trees in public green spaces in Strasbourg city, France. Urban Forestry and 647
Urban Greening 17. doi:10.1016/j.ufug.2016.04.010. 648
Sievers-Glotzbach, S. 2013. Ecosystem Services and Distributive Justice: Considering Access 649
Rights to Ecosystem Services in Theories of Distributive Justice. Ethics, Policy & 650
Environment 16: 162–176. doi:10.1080/21550085.2013.801203. 651
Srang-iam, W. Planting Trees for Sustainability? A Climate Justice Perspective on Green 652
Agriculture in Thailand: 22. 653
31 Tratalos, J., R. A. Fuller, P. H. Warren, R. G. Davies, and K. J. Gaston. 2007. Urban form, 654
biodiversity potential and ecosystem services. Landscape and Urban Planning 83: 308– 655
317. doi:10.1016/j.landurbplan.2007.05.003. 656
Vyas, S., and L. Kumaranayake. 2006. Constructing socio-economic status indices: How to use 657
principal components analysis. Health Policy and Planning 21: 459–468. 658
Wilkerson, M. L., M. G. E. Mitchell, D. Shanahan, K. A. Wilson, C. D. Ives, C. E. Lovelock, 659
and J. R. Rhodes. 2018. The role of socio-economic factors in planning and managing 660
urban ecosystem services. Ecosystem Services 31: 102–110. 661
Yang, J., Y. Guan, J. (Cecilia) Xia, C. Jin, and X. Li. 2018. Spatiotemporal variation 662
characteristics of green space ecosystem service value at urban fringes: {A} case study on 663
Ganjingzi District in Dalian, China. Science of The Total Environment 639: 1453–1461. 664
doi:10.1016/j.scitotenv.2018.05.253. 665
Zhao, C., and H. A. Sander. 2015. Quantifying and Mapping the Supply of and Demand for 666
Carbon Storage and Sequestration Service from Urban Trees. PLoS One 10. 667
doi:10.1371/journal.pone.0136392. 668