ADAM-10 and -17 regulate endometriotic cell
migration via concerted ligand and receptor
shedding feedback on kinase signaling
The MIT Faculty has made this article openly available.
Please share
how this access benefits you. Your story matters.
Citation
Miller, M. A., A. S. Meyer, M. T. Beste, Z. Lasisi, S. Reddy, K. W. Jeng,
C.-H. Chen, et al. “ADAM-10 and -17 regulate endometriotic cell
migration via concerted ligand and receptor shedding feedback on
kinase signaling.” Proceedings of the National Academy of Sciences
110, no. 22 (May 28, 2013): E2074-E2083.
As Published
http://dx.doi.org/10.1073/pnas.1222387110
Publisher
National Academy of Sciences (U.S.)
Version
Final published version
Citable link
http://hdl.handle.net/1721.1/83378
Terms of Use
Article is made available in accordance with the publisher's
policy and may be subject to US copyright law. Please refer to the
publisher's site for terms of use.
ADAM-10 and -17 regulate endometriotic cell
migration via concerted ligand and receptor
shedding feedback on kinase signaling
Miles A. Millera,1, Aaron S. Meyera,1, Michael T. Bestea,b, Zainab Lasisia, Sonika Reddya, Karen W. Jenga, Chia-Hung Chenc, Jongyoon Hand,e, Keith Isaacsonb,d,e, Linda G. Griffitha,b, and Douglas A. Lauffenburgera,b,2
aDepartment of Biological Engineering andbCenter for Gynepathology Research, Massachusetts Institute of Technology, Cambridge, MA 02139;cDepartment
of Bioengineering, National University of Singapore, Singapore 119615; anddNewton-Wellesley Hospital, Newton, MA 02462; andeHarvard Medical School,
Boston, MA 02115
Edited* by Joan S. Brugge, Harvard Medical School, Boston, MA, and approved April 24, 2013 (received for review December 26, 2012) A Disintegrin and Metalloproteinases (ADAMs) are the principal
enzymes for shedding receptor tyrosine kinase (RTK) ectodomains and ligands from the cell surface. Multiple layers of activity regulation, feedback, and catalytic promiscuity impede our understanding of
context-dependent ADAM“sheddase” function and our ability to
pre-dictably target that function in disease. This study uses combined mea-surement and computational modeling to examine how various
growth factor environments influence sheddase activity and cell
mi-gration in the invasive disease of endometriosis. Wefind that
ADAM-10 and -17 dynamically integrate numerous signaling pathways to direct cell motility. Data-driven modeling reveals that induced cell mi-gration is a quantitative function of positive feedback through EGF ligand release and negative feedback through RTK shedding. Although sheddase inhibition prevents autocrine ligand shedding and resultant EGF receptor transactivation, it also leads to an accumulation of phos-phorylated receptors (HER2, HER4, and MET) on the cell surface, which subsequently enhances Jnk/p38 signaling. Jnk/p38 inhibition reduces cell migration by blocking sheddase activity while additionally pre-venting the compensatory signaling from accumulated RTKs. In con-trast, Mek inhibition reduces ADAM-10 and -17 activities but fails to inhibit compensatory signaling from accumulated RTKs, which actually enhances cell motility in some contexts. Thus, here we present a shed-dase-based mechanism of rapidly acquired resistance to Mek inhibition through reduced RTK shedding that can be overcome with rationally directed combination inhibitor treatment. We investigate the clinical
relevance of thesefindingsusingtargetedproteomicsofperitonealfluid
from endometriosis patients andfind growth-factor–driven ADAM-10
activity and MET shedding are jointly dysregulated with disease.
cell signaling networks
|
metalloproteinase activity|
cue-signal-response analysis|
amphiregulinA
Disintegrin and Metalloproteinases (ADAMs), especially ADAM-10 and -17, are the principal mediators of proteolytic ectodomain shedding on the cell surface (1). ADAMs and the closely related matrix metalloproteinases (MMPs) work together as “shed-dases” to cleave hundreds of diverse transmembrane substrates in-cluding growth factor ligands, receptor tyrosine kinases (RTKs), adhesion molecules, and even proteases themselves from the cell surface. Unfortunately, little is known regarding how such a broad palette of proteolytic activity integrates to modulate behaviors such as cellular motility. Furthermore, extensive cross-talk and complexity among signaling networks, proteases, and their substrates make understanding sheddase regulation on a component-by-component basis challenging (2). Therapeutics have targeted sheddases and their substrates for the treatment of invasive diseases such as cancer, yet many of these inhibitors have failed in clinical trials (3). Therefore, a need exists for understanding how the balance of sheddase-medi-ated degradation integrates multiple layers of signaling networks to coordinately influence cell behavior in various disease contexts.Here we study how sheddase activity contributes to cell migration in the invasive disease of endometriosis, defined by the presence of endometrial-like tissue residing outside the uterus. Up to 10%
of adult females and 40% of infertile women have the disease, which also exhibits comorbidity with several cancers (4, 5). En-dometriosis currently has no cure: hormonal therapies merely manage the disease with significant side effects, and surgery provides only temporary relief for many, with recurrence rates as great as 40% within 5 y postoperation (6). Like cancer, endo-metriosis is associated with aberrant cell invasion into ectopic organ sites, and endometriotic tissues often exhibit dysregulated molecular pathways commonly perturbed in other invasive diseases. Mitogenic and inflammatory phospho-signaling [for example, phosphorylated extracellular-signal-related kinase 1/2 (p-Erk1/2), phosphorylated protein kinase B (p-Akt), and phosphorylated p38 mitogen-activated protein kinase (p-p38)], RTKs (including epi-dermal growth factor receptor, EGFR), and metalloproteinases have all been clinically associated with endometriosis (7, 8), and consequently represent attractive therapeutic strategies (9–11).
Many challenges in developing targeted therapeutics stem from network-level complexities such as compensatory feedback, and recent work has demonstrated how critical such mechanisms are to achieving therapeutic success, especially in cancer (12, 13). Com-putational models of systems-level biochemical networks have shown promise as tools to understand how multiple enzymatic reactions integrate to impact overall biological behavior, often with the goal of aiding the design of personalized or combination ther-apies (14, 15). Considering its complex role in disease, sheddase
Significance
Regulated cell-surface proteolysis underpins processes of cel-lular migration in both physiological and pathological contexts. However, comprehending how multiple proteolytic events co-hesively integrate to yield context-dependent cellular behavior remains a challenge. Here we present an experimental/compu-tational paradigm for analyzing networks of protease activities that interface with signaling pathways to influence cellular migration in the invasive disease of endometriosis. Wefind that induced cellular migration is a quantitative consequence of positive feedback through ligand release and negative feedback through receptor shedding, which furthermore drives rapid re-sistance to kinase inhibitor treatment. Targeted clinical pro-teomics confirms dysregulated proteolysis in endometriosis.
Author contributions: M.A.M., A.S.M., M.T.B., K.W.J., C.-H.C., J.H., K.I., L.G.G., and D.A.L. designed research; M.A.M., A.S.M., M.T.B., Z.L., S.R., K.W.J., C.-H.C., and K.I. performed research; M.A.M., C.-H.C., J.H., and K.I. contributed new reagents/analytic tools; M.A.M., A.S.M., M.T.B., Z.L., S.R., K.W.J., C.-H.C., J.H., K.I., L.G.G., and D.A.L. analyzed data; and M.A.M., A.S.M., L.G.G., and D.A.L. wrote the paper.
The authors declare no conflict of interest.
*This Direct Submission article had a prearranged editor. Freely available online through the PNAS open access option.
1M.A.M. and A.S.M. contributed equally to this work.
2To whom correspondence should be addressed. E-mail: lauffen@mit.edu.
This article contains supporting information online atwww.pnas.org/lookup/suppl/doi:10. 1073/pnas.1222387110/-/DCSupplemental.
regulation represents an ideal application of such network-level approaches. In this work, we apply the“cue–signal–response” (CSR) paradigm (14, 15) (Fig. 1A) to examine how disease-impli-cated growth-factor cues interact with experimentally monitored phospho-protein and protease networks (collectively referred to as signals), ultimately to influence cellular migration response. Com-putational modeling elucidates quantitative and predictive rela-tionships among multiple layers of experimental data and offers testable hypotheses of context-dependent behavior and signaling feedback. Wefind ADAM-10 and -17 to be critical regulators of motility that are dynamically controlled through several signaling pathways, thereby affecting cell behavior through both positive feedback from EGF ligand release and negative feedback from Hepatocyte Growth Factor Receptor (HGFR; MET), Human Epidermal Growth Factor Receptor 2 (HER2), and HER4 RTK shedding. Wefind kinase inhibition generally reduces ADAM-10 and -17 activities, reduces subsequent RTK shedding, and conse-quently allows the accumulated RTKs to enhance downstream c-Jun N-terminal kinase (Jnk) and p38 signaling. Thus, here we demonstrate an ADAM-10 and -17–based mechanism of rapidly acquired resistance to kinase inhibition through reduced RTK shedding that can be overcome with combination therapy. Targeted proteomic analysis of clinical samples from endometriosis patients indeed confirms growth-factor–driven ADAM-10 activity and consequent MET shedding are dysregulated with disease. Overall, our results have wide implications for designing combination therapies and identifying context-dependent personalized thera-peutic strategies for both kinase and protease inhibitors.
Results
Overview of CSR Study Design. We use a CSR approach to
un-derstand the signaling-regulated impacts of sheddase activity on cell migration from a multivariate, network-level perspective (Fig. 1A). First, we stimulate the immortalized 12Z cell line, a commonly studied in vitro disease model established from an endometriotic bi-opsy (16), with a panel of growth factor cues (seeSI Appendix, Table S1for references of clinical associations): EGF, transforming growth factor alpha (TGFa), neuregulin beta–1 (NRG1b), hepatocyte growth factor (HGF), insulin-like growth factor 1 (IGF1), and
platelet-derived growth factor–bb (PDGFbb). Poststimulation, we quantitatively monitor an array of downstream molecular features, or“signals” (Fig. 1 B and C). Nearly all “signals” in the CSR dataset are clinically associated with endometriosis (seeSI
Appendix, Table S1 for unabbreviated names and clinical
evi-dence). To assess intracellular signaling, 5 min poststimulation we measured levels of 11 key phospho-proteins using bead-based sandwich immunoassays (SI Appendix, Fig. S2).
We performed multiple measurements of key ADAM shed-dases, themselves, following growth-factor stimulation. To directly assess ADAM-17 activity, we immunoprecipitated the enzyme from whole-cell lysate, incubated the bound protein with a FRET substrate, and recorded cleavage rates byfluorimetry (SI Appendix,
Fig. S3A). However, this approach disrupts protein complexes
observed in the live-cell context. Therefore, we coadministered seven soluble FRET-based polypeptide substrates with growth factor treatments to assess regulation of general catalytic activity of proteases in live cells. Cleavage rates of these substrates were assessed by live-cellfluorimetry for several hours (SI Appendix, Fig.
S3B and C). However, the FRET substrates are by nature
non-specific. We therefore used Proteolytic Activity Matrix Analysis (PrAMA) as an inference algorithm to estimate the effective concentrations of catalytically active ADAM-10, -12, and -17, based on FRET substrate cleavage rates and prior knowledge of enzyme substrate specificities (17) (SI Appendix, Fig. S3 D and E). Additionally, we quantified ADAM-10 and -17 surface levels to assess protease trafficking (SI Appendix, Fig. S4 A–H) and moni-tored levels of ADAM-17–pT735, which is thought to impact ac-tivity (18) (SI Appendix, Fig. S4I).
We investigated regulation of membrane-bound substrates by quantifying their cell-surface trafficking and proteolysis. To mea-sure short-term shedding of heparin-binding EGF (HBEGF, an EGF ligand), we transgenically overexpressed it with a Myc-tagged ectodomain and a GFP-tagged C terminus (19). Immunostaining enabled quantification of intact HBEGF on the cell surface rela-tive to total levels. These measurements were averaged over three time points (30, 60, and 90 min) (SI Appendix, Fig. S5). For more highly expressed membrane-bound substrates (compared with HBEGF), we measured endogenous levels of surface-bound MET
EGFR IRS-1 Erk1/2 GSK3α/β Akt JNK p38 Src Shc HSP27 Ras PI3K MEK MKK4 pT735 P P Measurements: Western blot Bead-based immunoassay AREG AREG Her3
Met ADAM10 ADAM17
c-Jun STAT3 TYK2 Cell Migration E Sandwich ELISA F Flow cytometry A
Inferred protease activity
20‘
5’ 40’ 45’ 1 hr 1.5 hrs 22 hrs 24 hrs 38 hrs
cell surface RTK and ligand
3 hrs
supernatant protein levels surface ADAM levels
A17 p-T735
phospho-signaling
A17 IP & activity
cell migration
A
B
F TNFR HBEGF HBEGFImmunoprecipitation & activityIP
Live-cell confocal microscopy S
S
FRET protease substrate E E E E E Her2 Her4 P P P P P P P P P P P P AREG E F F F F F F A A ADAM12 A IGF1-R PDGFR IP FRET-peptide T=0 S S S growth factor
stimulation phospho-signaling sheddase substrate regulation sheddase regulation
cell migration
growth factor treatment
Cues Signals Response
30’
C
+EGF Ctrl 60 -60 Distance (um)-60 60 30 -30 30 -30 P IP F E F P A S Conceptual Model:FRET-substrate cleavage & inferred protease activity
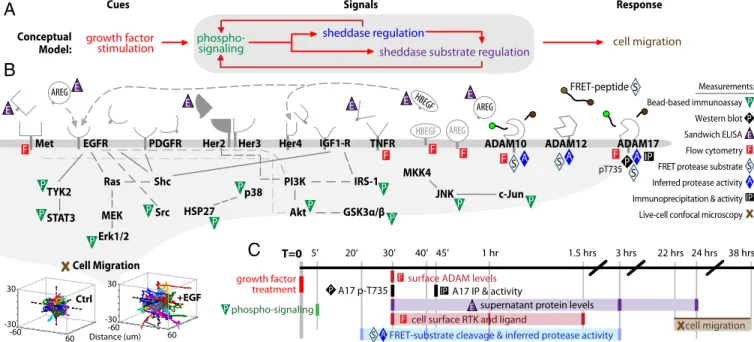
Fig. 1. CSR study design. (A) CSR overview: we stimulate endometriotic cells with a panel of growth factor cues; record multiple downstream signals comprising measurements of phospho-signaling, sheddase regulation, and sheddase substrate regulation; and use computational modeling to map these observations onto cell migration responses. (B) Overview of signals and responses included in the CSR dataset. All receptors shown were directly measured and/or stimulated. (C) Experimental timeline of CSR study. Dark colored lines denote measurement time points. At lower left, cell migration is depicted as single-cell tracks, where initial cell positions were centered for visualization.
SYST
EMS
BIOLO
GY
(also known as HGF receptor), tumor necrosis factor receptor 1 (TNFR1), and amphiregulin (AREG, an EGF ligand), averaged over three time points poststimulation (30, 60, and 90 min; SI
Appendix, Fig. S6A). We also monitored supernatant levels of
endogenous substrate at multiple times using enzyme-linked immunoassays (ELISAs), although not all analytes were detect-able at early time points (SI Appendix, Fig. S6 B–G).
Finally, we used time-lapse confocal microscopy to assess fea-tures of cell migration as responses to the growth-factor cues and previously described molecular signals. Dye-labeled 12Z cultures suspended in collagen-I gels were individually tracked for 16 h, and various descriptions of cell movement including total path length, net displacement, and the“random motility coefficient” derived from a thermodynamic-based model of the persistent random walk were calculated as metrics of single-cell motility for each condition (20) (SI Appendix, Fig. S7).
CSR Modeling Suggests Parallel Ligand and Receptor Shedding
Influence Cell Migration. To glean information from the full CSR
dataset (shown in Fig. 2A), we began by calculating correlation between pairs of measurements as they varied across the seven growth-factor treatment conditions. Significant pair-wise correla-tions were then graphically mapped in an unsupervised manner. This“correlation- network” encouragingly reflects several features of known biology (SI Appendix, Fig. S8A). For example, the greatest correlation among all phospho-signaling measurements lies
between Jnk and its known substrate c-Jun (SI Appendix, Fig. S8B). ADAM-10 catalytic activity, as inferred by PrAMA, correlated very closely with supernatant accumulation of a known substrate, MET. Among the most negatively correlated measurements, cell-surface AREG was strongly anticorrelated with supernatant accumulation of AREG. At a higher level, the correlation network suggests modularity among the data, where highly interconnected phospho-signaling events link to early (30 min to 3 h) protease activity measurements primarily through ADAM-17 phosphorylation. These early markers of protease activity then correlate with su-pernatant accumulation of ligands and receptors by 24 h, which in turn are highly correlative with features of cell migration (SI
Appendix, Fig. S8). Of all measurements in the CSR dataset, 3D
cell migration features correlated most closely with ligand and receptor shedding. We tested if ligand/receptor shedding was af-fected by whether cells were cultured on 2D tissue culture plastic or in 3D collagen-I matrices. For those species included in the CSR dataset, we found significant agreement between results from these two cell culture models (SI Appendix, Fig. S9A), fur-ther suggesting that ligand/receptor shedding measurements made in 2D cultures sufficiently reflect shedding and migration behaviors observed in 3D cultures.
We performed principal components analysis (PCA) to de-scribe measurements from the CSR dataset in terms of key axes of covariance, or principal components (PCs), as they varied across the growth factor treatments. The scores/loadings plot describes
AREG MET TNFR1HBEGF Ctrl EGF TGFa PDGFbb NRG1b HGF IGF1 p -ERK p -GSK p-JNK p -p38 p -cJun p -HSP27 p-IRS1 p -SRC p -ST A T3 p-T Y K 2 p -AK T AREG TNFR1 ME T HB-EGF HER-2 RMS C ell Speed P ersistence Total P ath L ength Net Displac ement R andom Motilit y P eptide 11 P eptide 14 P eptide 08 P eptide 22 P eptide 05 P eptide 10 P eptide 13 Phospho-signaling 5 min. PrAMA FRET-substrate cleavage phospho-protein ELISA cell surface immunostaining ADAM Protease Regulation
0-3 hr. Measurement:
Time post-stimulation: 0-3 hr. 24 hr.
ADAM Substrate Regulation Cell Migration 22-38 hr. PrAMA inferred activity A12 A ctivit y A10 A ctivit y A17 A ctivit y A17 IP+A ctivit y A17 p -T735 W
estern A17 A10 ME
T TNFR1 AREG M yc -HBEGF 30’ ME T 30’ TNFR1 3 hr . ME T 3 hr . TNFR1 3 hr . AREG
cell supernatant ELISA growth factor treatment 0 (ctrl) 1 -1
A
-1 1 phospho-signaling ADAM regulation shedding (0-3 hr) shedding (24 hr)correlation with random motility
q<0.05
C
B
PEP-10 PEP-05 PEP-13 PEP-22 FRET-substrate cleavage actual pr edic ted -2 2 -2 2 Q2=0.77 Ctrl EGF TGFa PDGF NRG HGF IGF1 scores phospho-signaling FRET-substrate cleavage PrAMA inferred activity cell surface immunostaining supernatant protein (3hr.) supernatant protein (24hr.) cell migration PEP-10 PEP-13 PEP-05 persistence random motility MET TNFR1 AREG HBEGF inferred activity: A17 A10 surface: A17 A10 surface: AREG Myc-HBEGF p-A17 A17 (IP+activity) loadings PCA Scores / Loadings PlotPC1: general motility
-0.2 0.2
-0.3
0.3 confocal microscopytime-lapse
blinded IGF1
D
PLSR scores/loadings surface AREG MET A17 activity path length persistence PC1 (general motility) -3 3 PC2 (persistenc e) 1 -2 AREG MET HBEGF HER2 A17 motility prediction VIP scores0 1
total path length
PC2: persistence
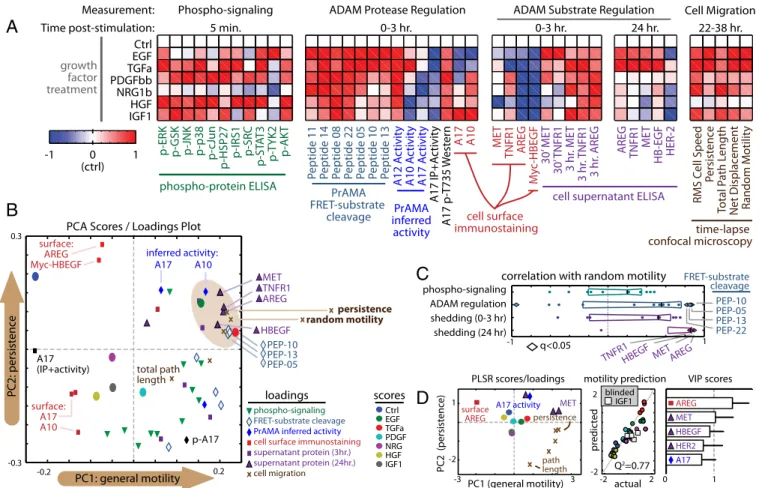
Fig. 2. CSR modeling suggests dual ligand/receptor shedding influences cell migration. (A) Heat maps depict CSR dataset, at time points described in Fig. 1C. Data were normalized by control-centering and scaling max absolute value to 1. (B) PCA presents an unsupervised description of covariation within the CSR dataset values in A. The brown ellipse denotes measurements most associated with persistent cell migration. (C) AREG and MET shedding by 24 h post-stimulation most closely correlate with random motility, among all measurements in the CSR dataset (q-value denotes multiple-hypothesis–corrected P value). Box-and-whisker bars show thefirst to third quartiles. (D) The reduced PLSR model describes features of cell migration as a function of select variables from the CSR dataset. The scores/loadings plot (Left) describes covariance among the descriptor variables and migration features. Cross-validation prediction accuracy (Q2= 77%) was determined with IGF1 measurements blinded from the optimization routine (Center). Model descriptors were ranked by importance
according to VIP score (Right). Error bars denote SE.
where each of the growth factor treatments and measurement variables fall along thefirst two PCs, which capture 40% and 25% of the total data variance, respectively (Fig. 2B; shown fully la-beled inSI Appendix, Fig. S9B). Similar to results from the cor-relation network, modularity can also be observed in the PCA scores/loadings plot. The lower right quadrant is largely populated with phospho-protein levels and short-term metrics of substrate shedding, and these are anticorrelated with surface levels of en-dogenous substrate (AREG and Myc–HBEGF) in the upper left quadrant. The upper right quadrant associates with persistent migratory behavior, and is populated with ADAM-10 and -17 activities (inferred by PrAMA), along with levels of supernatant ligands/receptors at 24 h. Direct comparison of correlations be-tween CSR dataset measurements and the random motility co-efficient echo the PCA results: supernatant ligand/receptor at 24 h represent by far the most correlative indicators of cell migration, led by AREG and MET as the top two features (Fig. 2C).
Taken together, these results suggest that growth-factor stim-ulation directly regulates the effective concentration of catalyti-cally active sheddases, which then leads to similar (although not identical) patterns of shedding across multiple endogenous and FRET-based substrates. Furthermore, these patterns of sub-strate proteolysis correlate extremely well with cell migration, suggesting that sheddases significantly influence motility.
Joint AREG and MET Shedding Predict Cell Migration.Although
in-dividual shed analytes significantly correlate with features of cel-lular motility, single-variable relationships between shedding and motility fail to accurately predict motile responses under untested conditions in a sufficiently quantitative manner, with a prediction accuracy of Q2 < 50%. Consequently, we implemented partial least squares regression (PLSR) as a statistical method to distill the effects of multiple shedding events into key axes of control (PCs, as with PCA) that quantitatively combine to describe overall migra-tion behavior. More specifically, we used an optimizamigra-tion algo-rithm to build a reduced PLSR model that optimally selects the minimal set of descriptor variables from the CSR dataset that predict migration with high accuracy. To improve model accuracy, we included additional measurements, made in the presence of a broad-spectrum metalloproteinase inhibitor (BB94) and an EGFR blocking antibody monoclonal antibody 225 (mab225), to determine the dependency of shed analyte accumulation on sheddase activity and EGFR endocytosis of autocrine ligand (data
shown inSI Appendix, Fig. S6). Among all measurements in the “expanded” CSR dataset, metrics of AREG and MET shedding were the two most important variables chosen by the algorithm (Fig. 2D; fully labeled scores/loadings inSI Appendix, Fig. S9C). Although patterns of MET and AREG shedding closely correlate with each other, PLSR model accuracy significantly improves when both are included together, suggesting subtle underlying mecha-nisms of substrate specificity. Indeed, PLSR accuracy relies upon multiple PCs for accurate prediction accuracy (SI Appendix, Fig. S9D), implying multiple axes of substrate shedding regulation.
In addition to supernatant ligand/receptor accumulation, we also measured accumulation of MMPs and tissue inhibitor of metalloproteinases (TIMPs) across the panel of growth factor treatments (SI Appendix, Fig. S10A). The aims here were to in-vestigate enzymes more associated with extracellular matrix degradation and to examine their ability to predict cell migration compared with ligand/receptor levels. In comparison with ligand/ receptor shedding, however, MMP/TIMP levels generally did not significantly correlate with or help in prediction of cell migration
(SI Appendix, Fig. S10 B and C). This indicates that, at least with
respect to growth factor stimulation, cell motility is principally regulated outside modulation of MMP/TIMP expression.
Overall, the correlation network modeling, PCA results, and PLSR models all suggest that concomitant ligand and receptor shedding, and especially AREG and MET shedding, are key determinants of endometriotic cell migration in response to vari-ous growth factor cues. Based on this model, we elected to further experimentally investigate regulation of AREG/MET proteolysis along with its resultant functional and therapeutic consequences.
Positive Signaling Feedback via AREG Shedding Drives Cell Migration.
CSR modeling results predicted a role for AREG shedding in governing cell migration, and we next sought to investigate its po-tential role in mediating positive signaling feedback through EGFR. Experiments with BB94 demonstrated that AREG supernatant accumulation is metalloproteinase-dependent, and treatment with mab225 provided evidence that soluble AREG is actively being endocytosed via EGFR in an autocrine manner (Fig. 3A). In-terestingly, we found that saturating levels of TGFa, which is known to exhibit higher binding affinity to EGFR compared with AREG (21) and likely inhibits AREG–EGFR binding, stimulates even greater AREG supernatant accumulation. This result suggested a positive feedback loop similar to those described previously (22),
Ctrl +IGF1 1 0 2 Cell Migration (24 hr.) * *
H
Ctrl 0 100 TGFα TNFα AREGA
(pg/mL/million cells) Ctrl +BB94 +mab225 EGF 0.0 2.0 0.0 1 1.5 -0.8 -0.8 0.8D
Path Length Persistence TNFα Control TNFα +mab225 +225 PC-2 (P ersist enc e) PC-1 (General Motility) Time (hrs) p-EGFR (pY1173) Ctrl TNFα TNFα+CI-1033 TNFα+225 0.8E
-1.5 2.0 -1.5 2.0 CONTROL EGF TGFα PDGF NRG HGF IGF HBEGF soluble AREG (24 hr .) (Z -S cor e) (Z-score) pY EGFR (30 min.) (% max) Distance (um) 100 1 0G
B
CtrlC
0 3 Cell M igration (24 hr .) Ctrl EGF]
F
Ctrl +Gef. 1 Supernatant 60 -60 -30 30 Distance (um) 60 -60 -30 30 TNFα +mab225 TNFα 60 0 1200 Ctrl 60 0 AREGFig. 3. EGFR transactivation through AREG shedding sensitizes 12Z to EGFR inhibition. (A) AREG levels reveal induced shedding and autocrine uptake via EGFR (24 h posttreatment; ELISA; seeSI Appendix, Fig. S6Gfor details). (B–D) TNFa stimulates EGFR pY1173 (B; bead immunoassay) and motility (C and D) in an EGFR-ligand–dependent manner. In D, cellular motility was described using PCA of time-lapse microscopy measurements 22–38 h poststimulation (shown as single-cell tracks in C, where initial cell positions were centered for visualization). Scores (circles) and loadings (squares) are plotted. (E) 12Z nuclei positions demonstrate EGF-stimulated migration into collagen-I gels as a function of distance from the plate bottom, shown quantified in F. Treatment with gefitinib blocks the effect of EGF added 1 h later. (G) Supernatant AREG (left axis; ELISA) and p-EGFR levels (right axis; bead immunoassay) correlate with the gefinitib efficacy in reducing cell migration. (H) Anti-AREG decoy Ab treatment inhibits basal and IGF1-stimulated cell migration in the endpoint assay. (*P < 0.05; single-tailed Student t test.) All error bars denote SE.
SYST
EMS
BIOLO
GY
here with EGFR signaling promoting AREG shedding, which in turn enhances further EGFR signaling. Stimuli beside EGF ligands also stimulated AREG shedding, including the inflammatory cy-tokine TNFa (Fig. 3A), which transactivates EGFR in an EGF-ligand–dependent manner (Fig. 3B). Furthermore, TNFa stimula-tion enhanced the effect of mab225 treatment in reducing cellular migration (Fig. 3C and D).
With evidence of AREG-mediated EGFR transactivation, we examined whether growth factor stimulation sensitized cell mo-tility to EGFR kinase inhibition. For this and all subsequent cell migration experiments, we used a migration endpoint assay (SI
Appendix, Fig. S11). Briefly, cells were seeded under collagen-I
gels and exposed to bath application of growth factors after 1 h treatment with inhibitors. We quantified cellular migration into gels 24 h later (Fig. 3E). Although EGFR kinase inhibition using gefitinib (an EGFR inhibitor) and lapatinib (a dual EGFR/HER2 inhibitor) was ineffective at reducing cellular motility under basal conditions, nearly every tested growth factor sensitized cells to kinase inhibition (Fig. 3F and G;SI Appendix, Fig. S11). We compared AREG shedding to gefitinib sensitivity across the growth-factor treatments and found significant correlation (Fig. 3G). AREG shedding is particularly enhanced with IGF1 treatment, and IGF1 sensitized cells most to gefitinib compared with other non-ErbB family (that is, non-EGFR/HER2/HER3/HER4 targeting) growth factors. Examination of phosphorylated EGFR (p-EGFR) in IGF1-treated cells confirmed EGFR transactivation (Fig. 3G). Treatment with an anti-AREG decoy antibody effectively reduced both basal and IGF1-induced cellular motility, confirming a specific role for AREG among other potential EGF ligands (Fig. 3H). In sum, these data provide further evidence for the role of AREG-mediated positive signaling feedback in endometriosis cell migration.
EGFR Autocrine Signaling Regulates ADAM-10 and -17 Catalytic
Activities.We next examined how AREG shedding itself is
regu-lated by ADAM proteases, particularly in the context of EGFR signaling feedback. Direct examination of ADAM-10 and -17 cat-alytic activity in live cells using PrAMA revealed that the positive feedback via EGFR activity occurs at least in part through direct regulation of ADAM-10 and -17 catalytic activity (Fig. 4A). EGF and TGFa treatment led to an increase in FRET substrate pro-teolysis, while mab225 treatment led to a decrease (SI Appendix,
Fig. S12A). These effects were also seen with endogenous sheddase
substrates (besides AREG). For example, mab225 treatment led to an increase in surface TNFR1 and a decrease in its supernatant accumulation (SI Appendix, Fig. S12 B and C). However, the exact mechanisms of protease regulation remain unknown. Although EGF stimulation led to decreased ADAM-17 dimerization (SI Appendix,
Fig. S4J and K) and increased ADAM-17 pT735 (Fig. 2A), mab225
treatment did not elicit changes in ADAM-17 dimerization (SI
Ap-pendix, Fig. S12 D and E), ADAM-17 activity as measured after
immunoprecipitation (SI Appendix, Fig. S12F), ADAM-17–pT735
(SI Appendix, Fig. S12G), or ADAM-17 surface levels (SI Appendix,
Fig. S12H). Nonetheless, PrAMA results combined with decreased
endogenous substrate shedding suggest decreasing ADAM-10 and -17 catalytic activities in response to mab225 treatment. Given these complex results, we decided to perform additional computational modeling to formulate testable hypotheses as to how proteases may regulate substrate shedding in response to various signaling cues.
AREG Shedding Is Controlled by ADAM-10 and -17 in a
Context-Dependent Manner.We constructed reduced PLSR models to
de-scribe endogenous substrate shedding as a function of phospho-proteins, protease surface levels, and protease activity (including PrAMA and the immunoprecipitation and FRET-based activity, or IP+activity, assay). PLSR results decomposed substrate pro-teolysis along two PCs, with PC-1 describing overall shedding and PC-2 distinguishing ligands vs. receptors (SI Appendix, Fig. S13 A andB). Interestingly, the PLSR results suggested a concerted role for both ADAM-10 and -17, where each protease exhibits more or less influence depending on the growth-factor context (SI
Appen-dix, Fig. S13 C and D). Indeed, knockdown of either ADAM-10
or -17 reduces shedding of all of the substrates tested (SI Appendix,
Fig. S13E). One particular hypothesis from the PLSR modeling is
that EGF and TGFa stimulation drive ADAM-10 activity more than ADAM-17 activity. These results were primary determined by observations that (i) EGF and TGFa lead to decreased activity measured in the ADAM-17 IP+activity assay, (ii) EGF and TGFa stimulate down-regulation of ADAM-17 surface levels, and (iii) PrAMA infers that EGF and TGFa stimulate significantly more ADAM-10 activity than ADAM-17 activity (Fig. 2A). Conse-quently, although AREG is predominantly thought of as an ADAM-17 substrate (23), PLSR results suggest that EGF-stim-ulated AREG shedding may actually be occurring via ADAM-10. Using recombinant ADAM-10 prodomain as a specific inhibitor, we found ADAM-10 inhibition to cause increased AREG surface levels under EGF-stimulated, but not basal, treatment conditions (Fig. 4B). Furthermore, ADAM-10 inhibition only decreased su-pernatant AREG accumulation after EGF stimulation (Fig. 4C). siRNA knockdown of ADAM-10 showed a greater inhibitory ef-fect on AREG supernatant accumulation in EGF-stimulated cells (Fig. 4D). In contrast, ADAM-17 knockdown equally reduced AREG shedding under basal and EGF-stimulated conditions (Fig. 4D). Direct examination of specific ADAM activities in the siRNA-treated cells using PrAMA suggests that ADAM-10 does not impact ADAM-17 activity, further supporting a specific role for ADAM-10 in shedding AREG (Fig. 4E). Finally, Western blots show metalloproteinase-dependent, EGF-stimulated cleavage of pro-AREG in cell lysates (SI Appendix, Fig. S14 A–C), and di-gestion of immunoprecipitated pro-AREG with recombinant ADAM-10 and -17 demonstrated that both enzymes are capable of acting upon AREG and generating cleavage products similar to those seen in the EGF-stimulated lysate (SI Appendix, Fig. S14 D–F). Overall, these results provide evidence for EGF-stimulated
* * * * * * * *
E
A10 A17 siA10 siA17 * * *F
P rot ease A ctivit y Relative to siCtrl +mab225 +EGF 0 1.5C
siCtrl siA10 siA17 siA10+ siA17 Soluble AREG (24 hr.) * * * * n.s. n.s. A10 A17 A10 A17 Ctrl EGF TGFa 0 Protease Activity (a.u.) 1.6 EGF 2.5 0 Ctrl +proA10 -proA10
[
]
Surface AREG 7 0 EGF Ctrl -proA10 +proA10 1.6 0 C e ll mig ration (24 hr .) Ctrl proA10 Ctrl +IGF1 1.6 0 C e ll mig ration (24 hr .) +mab225 0 1A
B
D
G
siA10 siA17 Soluble AREG (24 hr.)Fig. 4. Both ADAM-10 and -17 contribute to AREG shedding. (A) PrAMA indicates mab225 treatment reduces ADAM activities. Following 30 min of mab225 treatment, FRET substrates and growth factors were simultaneously added to serum-starved 12Z cultures, and protease activities were recorded by fluorimetry for 3 h poststimulation. (B) ADAM-10 inhibition only increases sur-face AREG under EGF stimulation, quantified by immunostaining following 24 h treatment with proADAM10 and EGF. (C) proADAM10 treatment significantly reduces levels of supernatant AREG in the presence of EGF (ELISA). (D) Both ADAM-10 and -17 siRNA treatment reduce supernatant AREG levels (ELISA). (E) ADAM-17 knockdown reduces basal ADAM-10 activity, but not vice versa (PrAMA). (F) ADAM-10 knockdown blocks cell migration in the endpoint assay. (G) proADAM10 treatment inhibits basal and IGF1-stimulated cell migration in the endpoint assay. All error bars denote SE. (*P< 0.05, Student t test.)
10 activity and a context-dependent dual role for ADAM-10 and -17 in regulating substrate shedding.
ADAM-10 Inhibition Reduces Cellular Migration.Consistent with the
CSR modeling results showing the importance of ADAM-10 activity (as inferred using PrAMA) for cell motility, we found that ADAM-10 knockdown substantially decreased basal motility (Fig. 4F). Additionally, a specific ADAM-10 inhibitor (proADAM10) significantly reduced basal and IGF1-stimulated cell motility (Fig. 4G). In contrast, ADAM-17 knockdown did not show an effect on basal cell motility (Fig. 4F), possibly due in part to previously reported adhesion-related protein functions (23–25). Notably, however, ADAM-17 activity (as inferred using PrAMA) did not significantly correlate with cell motility in a positive manner in the CSR dataset, and ADAM-17 IP+activity results significantly anticorrelated with features of cell migration. Taken together, these data demonstrate that ADAM-10 influences cellular mi-gration, owing at least in part to its role in mediating AREG shedding and autocrine EGFR signaling.
Negative Signaling Feedback via RTK Shedding Reduces Jnk/p38
Signaling.In addition to positive signaling feedback from AREG,
CSR modeling suggested the shedding of RTKs (principally MET) also plays a role in governing cell migration. We hypothesized that RTK shedding functions as a mechanism of negative signaling feedback by attenuating receptor phospho-signaling. Indeed, di-rect protease inhibition using BB94 led to increased full-length p-HER2 and p-HER4 (Fig. 5A), total and p-MET (Fig. 5B), and p-p38 and p-cJun (Fig. 5C). Supernatant MET, HER2, and HER4 correspondingly decreased (SI Appendix, Figs. S2 and S15A). We also found that BB94-induced p-Jnk elevation could be blocked
with MET knockdown, further suggesting that enhanced signaling was due to accumulation of MET on the cell surface (Fig. 5D). Experiments confirmed that protease-inhibition effects were re-lated to ADAM-10, the principal MET sheddase. Specific in-hibition of ADAM-10 led to an accumulation of cell-surface MET (Fig. 5E), and we found ADAM-10 knockdown led to an increase in p-p38 that could be blocked using the MET inhibitor foretinib (Fig. 5F). Overall, these results demonstrate that ADAM-10 me-diated RTK shedding functions as a negative signaling feedback mechanism, and that direct inhibition of sheddase activity leads to the accumulation of HER2, HER4, and MET, along with en-hanced signaling through p38/Jnk/cJun signaling pathways.
Indirect Sheddase Down-Regulation via Kinase Inhibition Mediates
Drug Resistance.Given evidence that sheddase activity can be
ac-tivated by multiple signaling pathways, we next interrogated the effects of various kinase inhibitors on protease activity. In general, treatment with various Mek, Jnk, p38, and PI3K inhibitors broadly reduced the accumulation of both receptor and ligand sheddase substrates in cellular supernatant (Fig. 6A). The Mek inhibitor U0126 was also found to reduce supernatant TNFR1 levels within 30 min of treatment (SI Appendix, Fig. S16A), and multiple kinase inhibitors led to increased surface TNFR1 levels after 1 h of treatment (SI Appendix, Fig. S16B). We found U0126 treatment to elicit no change in ADAM-17 dimerization (SI Appendix, Fig. S16C), phosphorylation (SI Appendix, Fig. S16D), surface levels (SI
Appendix, Fig. S16 E and F), or ADAM-10 surface levels (SI
Ap-pendix, Fig. S16G), and the ADAM-17 IP+activity assay only
D
0 4 0 10 pan-pY HER2 pan-pY HER4 * * TGFα+BB94 BB94 TGFα ControlA
B
0.6 1.8 0 7 Total MET MET pY1349 HGF+BB94 NRG +BB94 HGF Control NRG * * * * p -p38 p -Jnk Sur fac e ME T (24 hr .) * * * BB94 Ctrl p-p38 p-cJun 0 2 0 2 BB94 Ctrl Ctrl NRG TNFaC
* * siCtrl siMET 0 2 Ctrl NRG BB94 NRG+BB 0 1.8 proA10 Ctrl Ctrl +EGF siA10 METi - - + +- + - + 0 2.5 * *E
F
Fig. 5. ADAMs mediate negative signaling feedback via RTK shedding. (A) Full-length p-HER2 and p-HER4 levels increase with 1.5 h BB94 treatment (bead immunoassay). Subsequent 30 min TGFa-treatment did not alter BB94 effects. (B) The 1.5 h BB94 treatment followed by 30 min treatments with NRG1b and HGF lead to higher total, full-length MET (x-axis) and METpY-1349 (y-axis) (Western blot; seeSI Appendix, Fig. S15Bfor images). (C) BB94 increases p-cJun and p-p38 (bead immunoassay). Cells were stimulated with NRG1b and TNFa for 30 min following 1.5 h BB94 treatment. (D) BB94 increases p-Jnk levels in a MET-dependent manner. Following siRNA knockdown of MET, cells were treated with BB94 for 1.5 h and stimulated with NRG1b for 30 min (bead immunoassay). (E) The 24 h proA10 treatment increases surface MET levels, +/− cotreatment with EGF, detected by immu-nostaining. (F) ADAM-10 knockdown increases basal p-p38 levels in a MET-dependent manner, using 1.5 h treatment with the MET inhibitor foretinib (bead immunoassay). All error bars denote SE. (*P< 0.05, Student t test.)
1 Ctrl AZD PD U01 JNK8 TC S SP SB LY BB94 Ctrl +225 +EGF AREG AREG AREG HBEGF HBEGF HBEGF MET MET MET TNFR1 TNFR1 TNFR1 0 1 p < 0.05 p < 0.01
B
Ctrl AZD U01 JNK8 TCS SP BB94 0 20 NRG:C
Ctrl Ctrl U01 AZD SP TC S pan-pY HER2 (5 min.) * * * U01(MEKi) LY (PI3Ki) SP (JNKi) SB (P38i) Cell Migration 1 10 HGF NRG PDGF CONT HBEGF IGF EGF TGFα +drug -drug[
]
0.01 average per growth factor Protease Activity Supernatant Conc. (24 hr.)A
D
0 A10 A17 Context Dependent Context Independent SP SB Jnk8 TCS U01 PD AZD LY 2 5 1 0.5 0.1 1 0.5 0.1 0.25 NRG HGF Stimulat ed M igr ation (F rac tion C o ntr ol) EGF-Stimulated Migration (Fraction Control)}
MEKi JNKi P38i PI3KiE
Fig. 6. Decreased ADAM activity via kinase inhibition mediates drug re-sistance. (A) The 24 h treatments with kinase inhibitors that target Mek (blue), Jnk (magenta), p38 (red), and PI3K (cyan) lead to reduced superna-tant levels of ligands and RTKs (ELISA). Cells were also cotreated with EGF or mab225. (B) PrAMA-inferred sheddase activities decrease in response to 4 h Mek and Jnk inhibitor treatment. (C) NRG1b-induced p-HER2 increases fol-lowing a 1.5 h pretreatment with Mek and Jnk inhibitors (bead immuno-assay). (D) Mek and PI3K inhibitor efficacies depend on growth factor context, while Jnk and p38 inhibitors do not (24 h endpoint migration assay). (E) Data from D were combined with experiments using additional Jnk and Mek inhibitors, and results are plotted to highlight differences in inhibitor efficacy under EGF- vs. HGF/NRG1b-stimulated conditions. All error bars denote SE. (*P< 0.05, Student t test.)
SYST
EMS
BIOLO
GY
showed a slight decrease with U0126 treatment (SI Appendix, Fig. S16H). In contrast, live-cell measurements using PrAMA indicated a substantial reduction in ADAM-10 and -17 catalytic activities with kinase inhibition (Fig. 6B). Based on these results, we hypothesized that indirect sheddase inhibition secondary to kinase inhibition could lead to compensatory signaling from reduced RTK shedding. Indeed, we found that pretreatment with Mek or Jnk inhibitors increased full-length p-HER2 levels following NRG1b stimulation (Fig. 6C).
We next tested whether kinase inhibitors, and their indirect effects on RTK shedding, would have an impact on cellular migration in response to various growth factor stimuli (Fig. 6D). Results show two distinct patterns of inhibitor efficacy: p38 and Jnk inhibitors strongly reduced 12Z motility under all growth factor treatment conditions, while in contrast, Mek and PI3K inhibitors demonstrated context-dependent efficacy (Fig. 6D). While Mek and PI3K inhibitors ef-fectively reduced EGF and TGFa stimulated motility, they actually enhanced motile responses to NRG1b and HGF. We further tested context-dependency using alternative Mek and Jnk inhibitors, and found results to be consistent (Fig. 6E;SI Appendix, Fig. S16I). To explain these differences, we measured NRG1b-stimulated p-p38 levels after 1 h pretreatment with Jnk or Mek inhibitors. Results indicated that compared with Jnk inhibition, Mek inhibition was unsuccessful in reducing p-p38 (SI Appendix, Fig. S16J). Overall, these data suggest that compensatory signaling through unshed RTKs, primarily through p38 and Jnk signaling pathways, can lead to Mek inhibitor resistance. Moreover, this compensatory sig-naling can become amplified in the presence of ligands that stimulate ADAM substrate RTKs (such as NRG1b and HGF).
Combined MET–Mek Inhibition Blocks Motility Across Multiple
Growth Factor Contexts. Given our evidence that protease
in-hibition can enhance MET signaling and that Mek inhibitor re-sistance in part arises from reduced sheddase activity, we hypothesized that Mek insensitivity in the presence of HGF and NRG1b is mediated by enhanced MET signaling. Using foretinib as an inhibitor of MET (and several other ADAM substrate RTKs, including VEGFR-2), we found that combination Mek–MET in-hibition was more effective than either inhibitor alone, under multiple growth-factor contexts (Fig. 7 A and B). Combination Mek–MET inhibition reduced basal p-Jnk levels more than either inhibitor alone (Fig. 7C). U0126 treatment only blocked NRG1b-stimulated migration when combined with MET siRNA treatment (Fig. 7D). Individual effects from MET siRNA and U0126 were not significant in this experiment. Overall, these results confirm the importance of alternative MET signaling in the context of Mek inhibition and reduced MET shedding.
Clinical Samples Suggest Dysregulated ErbB Signaling and ADAM-10
Activity with Disease.Finally, to test for relevance of our in vitro
findings to in vivo pathophysiology in human patients, we analyzed surgically obtained peritoneal fluid (PF) from patients with and without endometriosis. PF comprises a heterogeneous mixture of leukocytes, cell debris, and soluble proteins that interact with endometriotic lesions. We analyzed clarified PF samples using a targeted proteomics approach that used roughly the same reagents used in 12Z supernatant profiling experiments, assessing total protein levels using sandwich immunoassays and comparing these to previously reported proteolytic ADAM and MMP activities from the same patient samples (26) (Fig. 8A). Due to the large number of highly correlated measurements in each patient sample, we decomposed the data into an interpretable set of PCs using PCA. The first and third PCs best capture differences between control and disease PF samples (Fig. 8B; fully labeled in SI
Ap-pendix, Fig. S17A). Interestingly, disease samples fall into two
dis-tinct clusters in PC space, with one cluster defined by relatively high levels of ADAM-10 activity and high concentrations of ADAM-10 substrates including EGF, AREG, HER2, and HER4. In agreement with our in vitrofinding that AREG is a substrate of ADAM-10 (Fig. 4), we observed significant correlation between ADAM-10 activity and concentrations of HER2 and AREG in the PF samples
(SI Appendix, Fig. S17B). In contrast to the high ADAM-10 cluster
of disease samples, the second cluster of disease samples exhibits relatively low ADAM-10 activity, higher levels of ADAM-10 inhibitors (TIMPs), and higher levels of ADAM-9 activity. Of note, ADAM-9 is not inhibited by TIMPs (27). The control samples form a nonoverlapping cluster between the two disease clusters. Although the sample size is small (n = 7 disease samples), PCA results suggest multiple disease states in endometriosis that are defined principally by dysregulation of ADAM-10 activity and corresponding changes in ADAM-10 substrate accumulation.
We then used supervised partial least squares discriminant analysis (PLS-DA) to classify patient samples as falling into one of the three patient clusters based on a minimal number of protein measurements. PLS-DA shows that combined measurement of ADAM-9 activity and three ADAM-10 substrates (HER2, AREG, and HBEGF) can sufficiently classify patients with high (>95%) accuracy (SI Appendix, Fig. S17 C and D). We also used PLS-DA to classify patient samples into just two groups, disease and control, and observed that combined measurements of MMP-2 activity along with MET and TIMP1 levels sufficiently classify samples as either disease or control with high (>95%) accuracy (SI Appendix,
Fig. S17E and F). We analyzed the simple ratio of MET to TIMP1
levels for a more interpretable result, and observed a significant increase with disease (Fig. 8C). To identify the likely cellular source of increased MET shedding in the PF samples, we analyzed various cell populations from healthy and endometriotic patients, including eutopic endometrial fibroblasts and PF mononuclear cells (PFMCs). Compared with 12Z, PFMCs shed only 10% the relative levels of MET (SI Appendix, Fig. S18A). In contrast, en-dometrial fibroblasts, which generally express significant MET (28), shed similar levels of MET as 12Z (SI Appendix, Fig. S18B). Experiments with primary endometrial fibroblasts demonstrate that EGF stimulates dual EGF ligand and MET shedding in other relevant endometrial cell populations (SI
Ap-pendix, Fig. S18 B and C). Therefore, both endometriotic lesions
and endometrialfibroblasts represent significant sources of total MET observed in the PF, particularly in those patients with ele-vated ErbB ligand present. Consequently, the ratio of MET to TIMP1 may be a good surrogate marker of ADAM-10 activity on
A
B
C ell M igration (24 hr .) 0.1 10 Same as Fig. 6E NRG HGF Ctrl U01 U01+ METi METi Stimulat ed M igr ation (F ra ction C o ntr o l) EGF-Stimulated Migration (Fraction Control) 4 0 0.1 1 Ctrl EGF NRG HGF}
1 5 * U01 siMET - + + -- - + + NRG-Stimulated Migration (48 hr.) 2.5 0 p -Jnk U01 METi - + + -- - + + 0 1.4 *C
D
Fig. 7. Combination MET and Mek inhibition overcomes sheddase-medi-ated drug resistance. (A and B) The 1 h pretreatments with Mek (U0126) and MET (foretinib) inhibitors reduce 12Z migratory response to growth factor stimulation in the endpoint migration assay. Combination treatment exhibits enhanced efficacy. (C) The 1 h combination MET/Mek inhibition using foretinib and U0126 leads to reduced p-Jnk (bead immunoassay). (D) Combination MET knockdown and Mek inhibitor (U0126) synergistically block NRG1b-stimulated cell migration in the endpoint migration assay. Neither MET knockdown nor U0126 treatment had a significant effect in-dividually. All error bars denote SE. (*P< 0.05, Student t test.)
endometrial and endometriotic tissue. Overall, these results sug-gest that joint dysregulation of ADAM-10 activity, ErbB signaling, and corresponding RTK shedding play an important role in disease progression.
Discussion
Understanding systematic regulation of ectodomain shedding has been challenging to accomplish on a component-by-component basis for multiple reasons. The web of protease–substrate inter-actions involves significant overlap and cross-talk: proteases (i) degrade potentially hundreds of often shared substrates (29), (ii) interact with and regulate each other through direct proteolysis (30), and (iii) respond to and modulate signaling pathways (18). These multiple layers of complexity compel quantitative and mul-tivariate approaches, and here we use integrative experimental/ computational methodologies to understand how ADAM shed-dases interact with signaling networks to direct overall cellular behavior.
Network-Level Insights into Sheddase Regulation of Cell Migration.
In this work, we combine quantitative experimental measurements with network-inference methods to build computational models of signaling-mediated protease regulation and motility. The CSR approach successfully identifies canonical biochemical interactions, for example between Jnk and c-Jun (SI Appendix, Fig. S8), while simultaneously providing unique insight into mechanisms of shed-dase regulation. Shedding is generally considered a function of both protease catalytic activity and substrate availability, yet the balance of protease and substrate regulation remains unclear (19). Here we directly assess proteolytic activity in a relatively “substrate-in-dependent” manner using PrAMA, and find close correlation be-tween proteolysis of both soluble FRET peptides and multiple endogenous membrane-bound ligands and receptors. Moreover, these measurements best described cell migration among all other measurements in the CSR dataset, including phospho-signaling responses proximal to the growth-factor receptors that were being stimulated. Overall, these results (i) provide evidence for significant regulation of the sheddases themselves, (ii) clearly underscore how joint ligand and RTK shedding are concomitantly controlled, and (iii) suggest a prominent role for ectodomain shedding in governing cell migration.
Although we found strong correlations among multiple substrate shedding reactions, we also identified ample evidence that broad patterns of sheddase activity are governed by more than just a single regulatory pathway. This could be seen, for example, by the marked
differences in surface-level changes among the various ligands and receptors, as they varied across the growth factor treatments (Fig. 2B). Reflecting this observation, predictive modeling of substrate shedding and motility required multiple descriptors and PCs to achieve sufficient accuracy. Furthermore, CSR modeling results emphasize that sheddase regulation is a dynamic process. For ex-ample, PCA and correlation-network results pointed to modularity within the CSR dataset, characterized by early phospho-signaling events linked to ectodomain shedding primarily through ADAM-17 phosphorylation (SI Appendix, Fig. S8). Although complex, the network-inference results nevertheless converge upon AREG and MET as key regulators of cell migration, where they are defined as central components in predictive models of motility (Fig. 2D).
Based on computational modeling results, we investigated a mechanism of shedding defined by the coordinated, context-specific action of both ADAM-10 and -17. Multiple computational and experimental results suggested that EGF and TGFa primarily stimulate ADAM-10 activity (Fig. 4A) and lead to the down-regulation of ADAM-17 surface levels within 30 min of treatment
(SI Appendix, Fig. S4). Surprisingly, these results also suggested that
EGF-induced AREG shedding may be occurring through the ac-tivity of ADAM-10, even though AREG has traditionally been considered an ADAM-17 substrate. We confirmed that ADAM-10 had the potential to cleave AREG using recombinant protease (SI
Appendix, Fig. S14 D and F), and also found that ADAM-10
in-hibition affected AREG shedding to a much greater degree under EGF treatment conditions (Fig. 4 B–E). Furthermore, siRNA knockdown of ADAM-10 and -17 confirm the dual dependency of multiple other substrates on both ADAM-10 and -17 activities, in agreement with previous work (31). Overall, these results demon-strate how sheddases dynamically interact with multiple signaling pathways to govern overlapping ectodomain shedding events, and emphasize the difficulty in selectively manipulating the proteolysis of specific substrates through kinase and protease inhibitors.
Implications of RTK Ectodomain Shedding in Modulating Drug
Response. Although sheddase involvement in ErbB ligand
shed-ding makes them compelling drug targets in ErbB-driven disease, the biological consequences of ADAM-10 and -17–mediated RTK shedding continue to be poorly understood. In HER2+ breast cancer, ADAM-10 inhibition reduces HER2 shedding, which gen-erally has been described as beneficially limiting the accumulation of the membrane-bound HER2 fragment (p95HER2) that remains after ectodomain proteolysis (32). However, it remains unclear how p95HER2activity compares to full-length HER2, especially after
li--0.2 0.3-0.4 0.4
A
B
P rincipal C omponent 3 Principal Component 1 EGF HBEGF TGFα BTC AREG EGFR HER2 HER3 HER4 IGF1R MET PDGFR InsR VEGFR2 TIE2 TNFR1 TIMP1 TIMP2 TIMP3 TIMP4 MMP1 MMP2 MMP3 MMP7 MMP8 MMP9 MMP12 MMP13 ADAM8 ADAM9 ADAM15 ADAM17 Concentration (pg/ml) Protease Activity (a.u.)1 106 0 1 ADAM9 ADAM10 ADAM8 ADAM9 ADAM10 ADAM12 ADAM17 MMP2 MMP9 MMP13 HER2 AREG HBEGF MET TIMP1 TIMP2 103 Ctrl Endo Ctrl Endo Concentration Activity High ADAM-10 Disease Low ADAM-10 Disease ME T / TIMP1 R a tio 2.5 0.1 Ctrl Endo * Soluble Receptor Growth Factor MMP TIMP ADAM PC Loadings: Ctrl Endo PC Scores: Concentration Activity
C
EGFFig. 8. Clinical PF samples suggest dysregulated ErbB-driven ADAM-10 activity. (A) PF samples from patients with and without endometriosis were profiled for protein levels (bead immunoassay) and protease activities (PrAMA). (B) PCA scores and loading plot decomposes patient samples along PCs of covariation and separates samples into three nonoverlapping clusters in an unsupervised manner (fully labeled in SI-17A). (C) The ratio of MET to TIMP1 increases with disease (*P = 0.014, Wilcoxon rank-sum).
SYST
EMS
BIOLO
GY
gand stimulation. Furthermore, soluble HER2 ectodomain has been shown to inhibit signaling (33). For other RTKs including HER4 and MET, shedding likely reduces RTK signaling at the cell surface (34, 35). TIMP1 inhibition of MET shedding in breast cancer enhances MET signaling and increases liver metastasis (36). In this work we demonstrate that cellular motility is an integrative process that depends not just on AREG shedding, but also on the combined and quantitative effect of multiple proteolytic reactions, including RTK shedding. Wefind that ADAM-10 and -17–medi-ated receptor shedding down-regulates HER2, HER4, and MET signaling (Fig. 5). Reduced sheddase activity and RTK cleavage, either through metalloproteinase inhibition (Fig. 5) or indirectly through signaling pathway inhibition (Fig. 6), leads to accumulation of intact RTKs on the cell surface. RTK accumulation potentiates the signaling response to HGF and NRG1b, and causes enhanced RTK phosphorylation (Figs. 5B and 6C) and downstream activation of Jnk and p38 (Fig. 5C–F). Consequently, Mek and PI3K inhib-itors actually enhance the motile response of endometriotic cells to NRG1b and HGF treatment by inhibiting RTK shedding while failing to block the compensatory p38 and Jnk activity that results from signaling of accumulated RTKs (Fig. 6D and E). Previous studies implicate Jnk and p38 in endometriosis (37, 38), and our results show that Jnk and p38 inhibitors effectively reduce ADAM activity while also blocking the compensatory signaling and motility regardless of the growth factor environment (Fig. 6D and E;SI
Appendix, Fig. S16J). Overall, these results have significant
impli-cations for the design of combination therapies involving the nu-merous signaling pathways that affect ADAM activity, and complement previous studies that stress the importance of Jnk/p38 pathways in cell migration (39).
The emergence of secondary resistance to targeted kinase in-hibition represents a major obstacle in developing successful therapeutics, and in this work we identify a unique sheddase-mediated mechanism of rapidly acquired inhibitor resistance that has potential applications for a variety of kinase and protease inhibitor therapies. In the context of breast cancer, secondary resistance to Mek inhibitors has been well documented and arises from up-regulation of RTKs that are known sheddase substrates, including PDGFRb, MET, and AXL (40). Furthermore, the pre-sence of growth factors that activate known ADAM substrate RTKs, for example MET, facilitates the emergence of resistant populations (12). Consistent with these results, here we present that Mek inhibitor resistance arises through multiple up-regulated RTKs, many of which have been implicated in other reports in-cluding MET and HER2. In this work we demonstrate that shed-dases play a role in the acute up-regulation of receptor levels, and this is particularly relevant in the presence of growth factors that have been previously implicated as prosurvival and promigration microenvironmental cues (12, 41, 42). In endometriosis, kinase inhibitors are in the earlier stages of testing and acquired inhibitor resistance is not yet a clear problem. Nonetheless, we demon-strate that the logic of combination therapies can be successful in our in vitro model for overcoming compensatory signaling path-ways that arise secondarily from inhibitor treatment.
Clinical Evidence of Dysregulated Sheddase Activity and Therapeutic
Implications. Analysis of clinical samples from endometriosis
patients helped demonstrate the relevance and inherent overlap of sheddase-mediated proteolysis and RTK signaling dysregulation in disease progression. Although many previous studies have exa-mined ErbB signaling and metalloproteinase levels individually (SI
Appendix, Table 1), here we present a multivariate analysis of
sys-temic interaction between ErbB ligands, RTK shedding, and met-alloproteinase dysregulation. Furthermore, we use measurements from a recently developed microfluidic device to analyze protease activity directly and relate these observations to corresponding protease substrate levels observed in the same patient sample (26). Clinical results confirm many of the observations made in vitro, for example demonstrating significant correlation between ADAM-10 activity and accumulation of known ADAM-10 substrates such as HER2, EGF, and AREG (SI Appendix, Fig. S17). This clinical correlation supports in vitro evidence that AREG shedding is sustained through a positive feedback loop involving ADAM-10 activity, EGFR signaling, and multiple cell types including endo-metriotic epithelium (12Z), endometrialfibroblasts, and PFMCs
(SI Appendix, Fig. S18). Furthermore, this positive feedback loop
drives persistent cellular migration and enhances cellular sensitivity to various kinase inhibitors in vitro. Interestingly, we find that disease PF samples comprise two distinct clusters defined in large part by the balance between ADAM-9 and ADAM-10 activities (Fig. 8B). ADAM-10 is a known ADAM-9 substrate, and ADAM-9 has been observed to down-regulate ADAM-10 activity on the cell surface (30). Common among both clusters of disease samples, however, was the observation that the ratio of MET shedding to TIMP1 concentration increased with endometriosis, thereby con-firming the relevance of MET signaling in designing therapeutic strategies that may impact ADAM-10 activity (Fig. 8C). Previous work has shown TIMP1 to inhibit the establishment of endome-triosis in a mouse model, and these effects were primarily assumed to be MMP-related (43). However, in this work we demonstrate the critical role of ADAM-10 in mediating in vitro cellular migration, and our clinical evidence associates TIMP1 with ADAM-10 activity via its relation with MET shedding.
Conclusions.We have presented an integrative paradigm for
an-alyzing how complex networks of protease activities work in concert with signaling pathways to influence overall cell response to various disease-relevant environments and therapeutic inter-ventions. In the future, we anticipate that this approach may be useful to explore other facets of sheddase regulation (such as osmotic stress), cell phenotypes (including proliferation and apoptosis), and sheddase-related diseases (such as breast can-cer). In this work, we found that ADAM-10 and -17 tune cellular signaling by concomitantly shedding ligand and receptor ecto-domains from the cell surface, and we demonstrate here how this competing signaling feedback determines context-dependent cell migration and drug response (Fig. 9).
Full appreciation of the many competing roles of sheddase activity will be essential for understanding their function in
No Motility
Blocked Signaling AREG
Akt/Erk
Jnk/P38
EGFR Driven Motility ADAMs
MET/HER2/HER4 Driven Motility
Autocrine Signaling Compensatory Signaling
HGF NRG Akt/Erk Jnk/P38 AREG ADAMs HGF NRG Akt/Erk Jnk/P38 AREG ADAMs HGF
Fig. 9. Ectodomain shedding exerts pro- and antimigratory effects depending on context. (Left) EGFR drives motility in an Erk/Akt-dependent manner. High sheddase activity leads to HER2, HER4, and MET shedding along with concomitant positive feedback via AREG release. (Center) Suppression of sheddase activity directly or indirectly via Mek inhibition confers reduced RTK shedding and enhanced response to NRG and HGF through Jnk and p38. (Right) p38, Jnk, or combination Mek/MET inhibition blocks motility.