Regular Retail Price Pass-Through
The MIT Faculty has made this article openly available. Please share
how this access benefits you. Your story matters.
Citation McShane, Blakeley B. et al. “Decision Stages and Asymmetries in
Regular Retail Price Pass-Through.” Marketing Science 35, 4 (July 2016): 619–639 © 2016 Institute for Operations Research and the Management Sciences (INFORMS)
As Published http://dx.doi.org/10.1287/mksc.2015.0947
Publisher Institute for Operations Research and the Management Sciences
(INFORMS)
Version Author's final manuscript
Citable link http://hdl.handle.net/1721.1/111087
Terms of Use Creative Commons Attribution-Noncommercial-Share Alike
Authors are encouraged to submit new papers to INFORMS journals by means of a style file template, which includes the journal title. However, use of a template does not certify that the paper has been accepted for publication in the named jour-nal. INFORMS journal templates are for the exclusive purpose of submitting to an INFORMS journal and should not be used to distribute the papers in print or online or to submit the papers to another publication.
Decision Stages and Asymmetries in Regular Retail
Price Pass-through
Blakeley B. McShane, Chaoqun Chen, Eric T. Anderson
Kellogg School of Management, Northwestern University, b-mcshane@kellogg.northwestern.edu, c-chen@kellogg.northwestern.edu, eric-anderson@kellogg.northwestern.edu
Duncan I. Simester
Sloan School of Management, Massachusetts Institute of Technology, simester@mit.edu
We study the pass-through of wholesale price changes onto regular retail prices using an unusually detailed dataset obtained from a major retailer. We model pass-through as a two-stage decision process that considers both whether and how much to change the regular retail price. We show that pass-through is strongly asymmetric with respect to wholesale price increases versus decreases. Wholesale price increases are passed through to regular retail prices 70% of the time while wholesale price decreases are passed through only 9% of the time. Pass-through is also asymmetric with respect to the magnitude of the wholesale price change, with the magnitude a↵ecting only the response to wholesale price increases but not decreases. Finally, we show that covariates such as private label versus national brand, ninety-nine cent price endings, and the time since the last wholesale price change have a much stronger impact on the first stage of the decision process (i.e., whether to change the regular retail price) than the second stage (i.e., how much to change the regular retail price).
Key words : regular, retail, price, pricing, pass-through
1.
Introduction
How retail prices adjust to wholesale price changes is of fundamental interest to both practitioners and academics. Brand managers want to understand how changes in wholesale prices a↵ect downstream retail prices, while academics have made price pass-through a cornerstone of theory in both marketing (Tyagi 1999) and economics (Bils and Klenow 2004, Eichenbaum et al. 2011, Nakamura and Steinsson 2008). Despite the importance of retail price pass-through, the empirical literature is scant. In this paper, we use a novel dataset that consists of 11,852 wholesale price change events faced by a very large national
retailer to study regular retail price pass-through. We develop a flexible statistical model that allows for a rich characterization of how managers adjust the regular retail price in response to a wholesale price change.
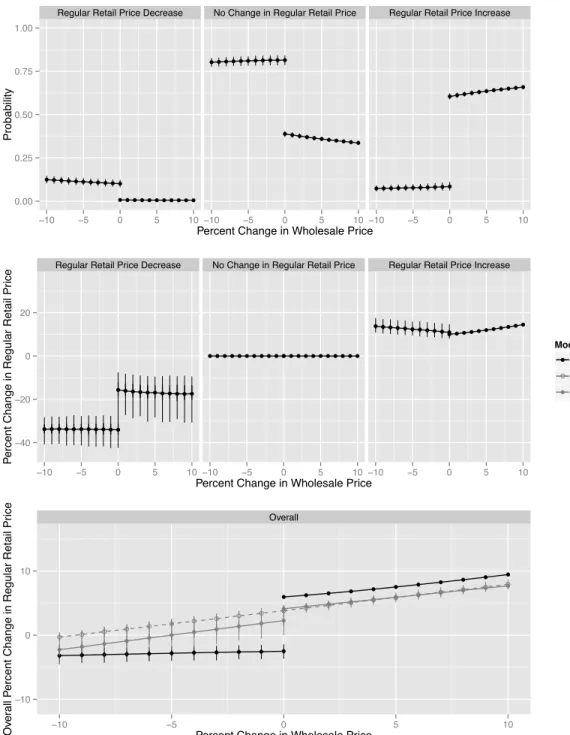
We find that, following 44% of wholesale price changes, managers make no change to the regular retail price. Further, we find that their response is strongly asymmetric with respect to wholesale price increases versus decreases. Wholesale price increases result in regular retail price increases 70% of the time while wholesale price decreases result in regular retail price decreases only 9% of the time.
The large fraction of non-responses to wholesale price changes is broadly consistent with menu cost models of price adjustments (Barro 1972, Sheshinski and Weiss 1977). These models argue that changing prices is costly and therefore managers will not respond to every wholesale price change. If a firm faces menu costs and managers believe that future wholesale price changes are more likely to be increases rather than decreases, then menu cost models can also explain the asymmetric response we observe (Laurence and Mankiw 1994). Expected future wholesale price increases would negate at least partially any windfall arising from a current wholesale price decrease. On the other hand, they would exacerbate the e↵ects of a current wholesale price increase. Thus, an extension of the menu cost model is consistent with an asymmetric response.
Empirically, the large fraction of non-responses suggests that retail pass-through is best characterized as a two-stage decision process: managers first decide whether to change the regular retail price, and then, conditional on this decision, they decide the magnitude of the price change. To our knowledge, other empirical models of pass-through have not considered this two-stage process (Besanko et al. 2005, Nijs et al. 2010, Gopinath and Itskhoki 2010).
When we consider the magnitude of pass-through, we also find tremendous asymmetry. When managers increase the regular retail price following a wholesale price increase, the increase in the regular retail price is a roughly linear function of the increase in the whole-sale price. However, when they respond to a wholewhole-sale price decrease, the regular retail price adjustment is uncorrelated with the magnitude of the wholesale price decrease.
When we examine the magnitude of the regular retail price increase in response to a wholesale price increase, we find that pass-through generally exceeds 100%. More specifi-cally, the dollar increase in the regular retail price is greater than the dollar increase in the
wholesale price in 96% of cases where managers decide to pass a wholesale price increase through to the regular retail price. Thus, pass-through that exceeds 100% is the norm rather than the exception in our data. Relatedly, we show that small regular retail price increases are rare events: when the regular retail price does increase, the change tends to exceed 5% of the prior retail price even for marginal increases in the wholesale price.
Theoretical models of pass-through suggest that the magnitude of the price adjustment should be influenced by factors such as the wholesale price (Besanko et al. 2005, Nijs et al. 2010), the shape of the demand curve (Tyagi 1999), competitive factors (Levy et al. 1998, Slade and G.R.E.Q.A.M. 1998), and category management concerns (Zenor 1994, Basuroy et al. 2001). We include covariates, such as the wholesale price, directly in our empirical model and specify a very flexible model that can accommodate a wide variety of potential managerial behaviors.
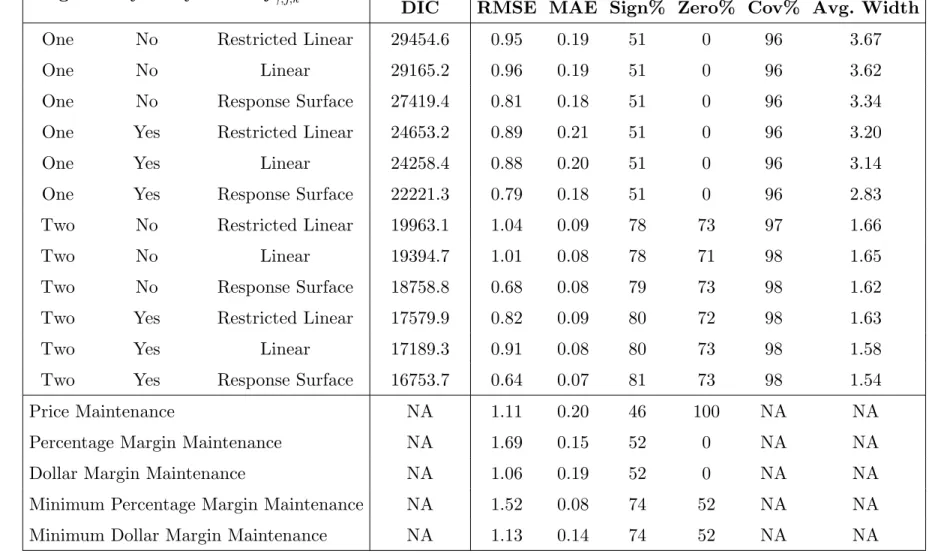
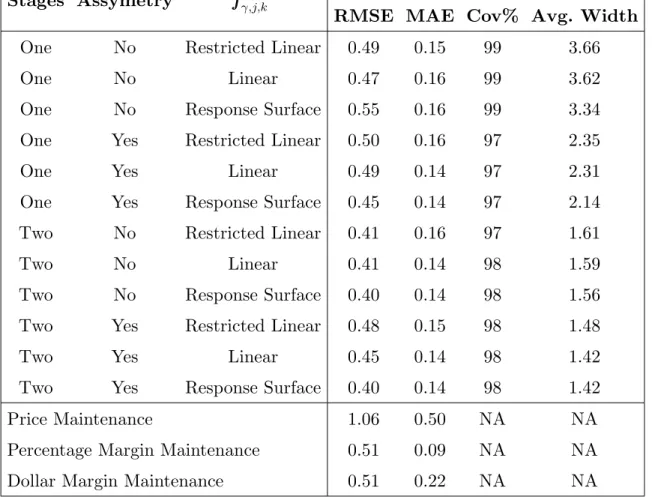
Overall, our two-stage model captures three key features of the data: (i) non-response to wholesale price changes, (ii) asymmetry in both response incidence and magnitude, and (iii) pass-through that exceeds 100%. Using out-of-sample data, we show that more restrictive (e.g., single-stage) models of pass-through perform much more poorly than our model.
We also compare our flexible model with managerial heuristics. First, we consider a price maintenance policy under which the regular retail price always remains unchanged. Second, we consider a percentage margin maintenance policy under which the regular retail price after the wholesale price change is set so as to maintain the percentage margin in place before the wholesale price change. Third, we consider a dollar margin maintenance policy. The first heuristic clearly fails to explain the managerial response to wholesale price changes while the latter two cannot explain the non-response. In sum, all three heuristics perform quite poorly on the overall dataset. However, when we restrict our attention to an important subset of the data, namely wholesale price increases that are followed by regular retail price increases, the percentage margin maintenance rule performs reasonably well and o↵ers a parsimonious explanation for why we observe pass-through rates that nearly always exceed 100%.
Two additional heuristics we consider are hybrid policies that we refer to as minimum percentage margin maintenance and minimum dollar margin maintenance. Under the min-imum percentage (dollar) margin maintenance heuristic, managers seek to maintain per-centage (dollar) margins at or above a target level. We assume that the current perper-centage
(dollar) margin is the target. When faced with a wholesale price decrease, the margin increases if regular retail prices are left unchanged and hence minimum percentage (dol-lar) margin maintenance predicts non-response (i.e., it is equivalent to price maintenance). When faced with a wholesale price increase, minimum percentage (dollar) margin mainte-nance predicts that managers should always respond and increase the retail price so as to maintain the percentage (dollar) margin (i.e., it is equivalent to percentage (dollar) margin maintenance). We note that while the minimum percentage margin maintenance heuristic does a good job at characterizing the non-response to wholesale price decreases as well as the magnitude of the response to wholesale price increases, it cannot explain why managers do not respond to 29% of the wholesale price increases in our data.
On the surface, it may appear that the heuristics that we consider are non-rational. However, the percentage margin maintenance heuristic is identical to the widely applied monopoly mark-up pricing rule. Under this rule, the price is proportional to marginal cost times a markup that is a function of demand elasticity. Faced with a wholesale price increase, the mark-up rule implies that managers should use the same percentage markup. We note that percentage margins vary widely among categories and items, which suggests that managers are not using a single, na¨ıve markup rule to price all items in the store. We also note that this rule may not be fully rational as it ignores competitive factors and other considerations such as product line e↵ects.
Our analysis explicitly focuses on regular retail prices and excludes promoted prices. We believe that there are several factors that make our focus on regular retail prices appro-priate. First, unlike promoted prices, regular retail price changes are persistent: a single regular retail price change event has implications for many subsequent periods (Kehoe and Midrigan 2015; forthcoming). Second, most revenue is earned at the regular retail price. In particular, transactions at the regular retail price account for 77% of this retailer’s total revenue. Although the proportion of revenue generated at the regular price varies across SKUs, it is generally quite high: 61% of SKUs generate over 90% of their revenue at the regular retail price while 77% of SKUs generate over 80% of their revenue at the regular retail price. Similar facts hold for the unit volume at the regular retail price. Transactions at the regular retail price account for 70% of this retailer’s unit volume with most SKUs having a large amount of volume at the regular retail price: 49% of SKUs generate over 90% of their unit volume at the regular retail price while 67% of SKUs generate over 80%
of their unit volume at the regular retail price. Consequently, potential changes to the regular retail price are very high-profile decisions and are carefully scrutinized by senior management (see Section 3.1 for details).
We believe our focus on regular retail prices (and exclusion of promoted priced) helps explain why some of our findings conflict with prior empirical results. Given that managers treat regular and promoted prices di↵erently, we would expect di↵erent results. We also believe the unparalleled breadth of our dataset helps explain these conflicts. We have a census of pricing decisions across a wide range of categories and products. Finally, we believe our extremely high-quality data also helps explain any conflict. We observe discrete wholesale price change events along with the actual managerial decision about whether and how much to respond to the wholesale price change. Thus, we measure pass-through directly from these observations. Most previous studies have had to infer pass-through from patterns in historical data, which may introduce considerable noise. As a final comment, we note our data allows us to build a multi-stage model of pass-through; the data considered in previous studies have typically limited researchers to single-stage models of pass-through whereas the multi-stage model we consider yields many new results.
Because we focus on the regular retail price, our study should not be interpreted as either a comparison of regular and promoted pass-through rates or a criticism of studies of promoted price through. Instead, we remain silent on the issue of promoted price pass-through. Additionally, we note a limitation of our study is that our data come from a single retailer, which is common among studies that analyze detailed proprietary data. Acquiring such data requires building a close relationship with a retailer, and the e↵ort required to establish these relationships makes it unrealistic to analyze data from multiple retailers. Although our data is from a single retailer discussions with managers and merchants at the firm reveals an organizational structure and pricing processes that are typical of other consumer packaged goods retailers such as supermarkets, drug stores, mass merchandisers, and convenience stores. Across all SKUs in the store, the median (mean) regular retail price is $6.04 ($9.07) while the twenty-fifth and seventy-fifth percentiles are $3.64 and $10.19 respectively. The retailer follows a Hi-Lo pricing policy with a median (mean) promotion depth of 27% (29%) while the twenty-fifth and seventy-fifth percentiles are 20% and 37% respectively. We believe our findings would generalize to other consumer packaged goods retailers that sell products in a similar price range.
The remainder of this paper is organized as follows. We discuss the extant literature in Section 2. We then discuss institutional details, describe our unique dataset, and perform some exploratory analyses in Section 3. In Sections 4-5, we describe our model for regular retail price pass-through and discuss our results respectively. Finally, in Section 6, we discuss the implications of our work.
2.
Literature Review
Our paper contributes to three broad literatures in marketing and economics: price pass-through, menu costs, and managerial rules. We discuss each of these and our contribution to them in turn.
Several empirical papers have investigated price pass-through in the consumer packaged goods industry, beginning with the seminal work of Chevalier and Curhan (1976) who observe (i) zero pass-through on a substantial fraction of trade promotions, (ii) average overall through of 35%, and (ii) average through of 126% excluding the zero pass-through events. While our empirical approach di↵ers, our results are similar in that we find, for example, a substantial fraction of zero through events and that average pass-through exceeds 100% when regular retail prices are increased in response to a wholesale price increase.
A major challenge in estimating pass-through is obtaining accurate cost data and, broadly speaking, there have been three approaches in the literature: working closely with a single firm, using aggregate data, or building a structural model. The first approach was used by Nijs et al. (2010), who worked closely with a single manufacturer to obtain detailed cost data throughout the manufacturer’s vertical channel thereby allowing for the study of pass-through across multiple layers of the channel. They find that pass-through from wholesalers to retailers averages 106%. They also find that pass-through from retailers to consumers averages 69%, which is similar to the estimates reported by Besanko et al. (2005) and Pauwels (2007) for a broader set of product categories within the Dominick’s Finer Foods retail chain.
The aggregate data approach to estimating pass-through was employed by Ailawadi and Harlam (2009) who examined the annual pass-through of trade promotion dollars. In particular, they calculated the annual total dollars spent by the manufacturer in the form of trade promotions and divided this by the annual dollars spent by the retailer in the form
of temporary price discounts to obtain an overall annual measure of pass-through. Under this approach, Ailawadi and Harlam (2009) found that (i) 20% 35% of observations have zero pass-through of trade promotion dollars and (ii) there is substantial heterogeneity in annual trade promotion dollars pass-through across categories with several categories showing annual pass-through in excess of 100%.
Finally, a structural modeling approach to estimating pass-through was used by Meza and Sudhir (2006) who investigated the timing of pass-through. They found that retailers tend to pass through a smaller amount in peak demand periods but that pass-through for loss leaders exceeds 160% in non-peak demand periods.
Given both the difficulty of empirically measuring pass-through and the variety of approaches used to do so, it is perhaps not surprising that there is considerable controversy over some findings. For example, a key finding of Besanko et al. (2005) is that discounts o↵ered on one brand may a↵ect the prices o↵ered on competing brands, an e↵ect termed cross-brand pass-through. This e↵ect has also been studied in a specific case by Anderson et al. (2013) who find that a retailer adjusts the private label price when a national brand is promoted. While there is some support for this concept of cross-brand pass-through, the empirical evidence is mixed as both McAlister (2007) and Duan et al. (2011) find little to no evidence of it.
In addition to the empirical literature on pass-through, there is also a considerable the-oretical literature (Tyagi 1999, Moorthy 2005) that focuses on the derivative of the retail price with respect to the wholesale price. Tyagi (1999) characterizes conditions (e.g., prop-erties of the demand function) that lead to pass-through that is greater than or less than 100% while Moorthy (2005) generalizes these findings to include cross-brand pass-through showing that it can be positive or negative. Our paper complements these theoretical papers by providing empirical evidence that pass-through is a two-stage rather than one-stage process; this suggests that new theoretical models of pass-through may need to be developed in order to explore the theoretical implications of a two-stage decision process. The two-stage decision process, while relatively unexamined in the marketing literature, has been widely considered in the theoretical macroeconomics literature. For example, menu costs, which impact whether to change prices but not how much to change them, are often cited as a key source of price stickiness (Barro 1972, Sheshinski and Weiss 1977). Despite the prominence of menu costs in theory, there is comparably less empirical evidence
of them with notable exceptions being research on how managers set prices (Levy et al. (1997), Levy et al. (1998), and Dutta et al. (1999)).
The paper is also related to work by two di↵erent (though overlapping) research teams using data from the same retailer. The results of the first study are described in Anderson, Simester, and Jaimovich (2015; forthcoming). They use a subset of the data used in this paper and focus on the role of menu costs. In particular, they investigate whether a whole-sale price increase is less likely to result in a regular retail price change if the menu costs of changing regular retail prices are higher. Because they focus on the role of menu costs, they only consider whether the regular retail price changes. In contrast, this paper considers both whether and how much the regular retail price changes and employs a more flexible statistical model. This allows us to characterize the asymmetric response to wholesale price increases versus wholesale price decreases and variables that moderate both stages.
Work-in-progress by Anderson, Nakamura, Simester, and Steinsson (2014) uses a dif-ferent sample of data from a di↵erent set of stores. They obtained data describing the quantities purchased at both the regular retail price and at the discounted or promoted price (if any). They combine this with unemployment data and commodity price data to study the retail price response to demand or supply shocks. In particular, they study whether the retailer responds to supply or demand shocks using regular retail prices or promoted prices.
Another area of focus in the macroeconomics literature has been studying the e↵ects of large-scale macroeconomic events such as recessions on retail margins, with early work suggesting that retail margins may be counter-cyclical (Pigou 1927, Keynes 1939). Sev-eral explanations have been o↵ered to explain this type of pricing behavior (Bils 1989, Rotemberg and Saloner 1986, Greenwald et al. 1984). We contribute to this literature by studying a time period that spans one of the largest recessionary periods in U.S. history and observing how all retail prices within a chain are a↵ected. While retail managers face an unprecedented number of wholesale price increases at the beginning of the recession and a large number of wholesale price decreases soon thereafter, we find that their pricing behavior is remarkably stable. In other words, retail managers do not seem to modify their price setting behavior during the recession.
3.
Data and Exploratory Data Analysis
3.1. Institutional Details
We study the pricing behavior of a retailer that operates a large number of stores across the United States and sells a broad mix of consumer packaged goods. Like many retailers, the firm sells a mix of national brands and private label products. The private label products typically carry the retailer’s name but are produced by either a contract manufacturer or a national brand manufacturer. As noted earlier, a subset of this data is utilized by Anderson et al. (2015; forthcoming) and additional details can be found in that paper.
To set the stage for our analysis, we briefly summarize important institutional facts regarding the pricing process of consumer packaged goods manufacturers and retailers. Many of these facts are also discussed in Anderson et al. (2014). First, nearly every major consumer packaged goods manufacturer and retailer engage in some type of annual plan-ning process that leads to a promotion calendar (Blattberg and Neslin 1990, p. 392). Second, manufacturers establish trade promotion budgets that are used to fund price discounts, in-store merchandising, and other retailer activities. Financial transfers from manufacturers to retailers are somewhat flexible, which allows retailers to execute di↵er-ent pricing policies (e.g., Hi-Lo versus EDLP). Third, manufacturers establish a wholesale price, which is the long-run wholesale price for a product, and nearly every retailer faces this same wholesale price. Fourth, changes in the wholesale price are infrequent events and are often a↵ected by input costs, such as crude oil; these changes are unplanned, are not part of the annual promotion calendar, and are highly disruptive to the supply chain, which explains in part why they are so infrequent.
We now consider how these facts manifest themselves in our data. The retailer that provided the data for our study maintains a wholesale price (or vendor list price) for every product; this is viewed as the marginal cost of acquiring the product. The wholesale price tends to be stable: only very infrequently does a manufacturer adjust the wholesale price and then, in turn, the retailer decides whether to adjust the regular retail price. It is unusual to change the wholesale price more than once a year and typically wholesale price changes are announced thirty to sixty days in advance, although this varies by manufacturer. When faced with a wholesale price change, the retail category manager and corporate pricing team jointly determine the best response. If they decide to make a regular retail price change, it is often coordinated with the wholesale price change so that both occur on the
same day. These are very high-profile decisions that are carefully scrutinized by senior management via a monthly report that summarizes the expected profit implications of the decisions.
In contrast, price promotions, which are studied by Ailawadi and Harlam (2009) and Nijs et al. (2010), are managed via an entirely di↵erent process at this retailer. Promoted price changes often occur several times per year and are heavily influenced by trade promotion funds. At the retailer we study, these financial flows are distinct from the wholesale price and reside in a dedicated IT system. As we do not have access to these financial flows, we do not have a measure of wholesale price for promotion and therefore cannot study promoted price pass-through.
Given that there is some flexibility in the allocation of trade promotion funds, one may be concerned whether changes in the wholesale price may a↵ect the depth or fre-quency of trade promotions. Our conversations with many managers suggest that this is very unlikely. Similar to industry norms, this retailer jointly plans price promotions with manufacturers well in advance because they require tremendous coordination and lead-time. In-store merchandising activities that generate demand (e.g., special displays, weekly features, television advertising) must be coordinated with supply (e.g., inventory), and promotions featured in store flyers each week are finalized at least twelve weeks in advance. Canceling or changing a promotion at the last-minute is both difficult and costly. Given these facts, we believe that the wholesale price change events that we observe in our data have no immediate impact on promotions or temporary discounts. Additional research by Anderson et al. (2014) on the same retail chain is consistent with this assumption.
One factor that may a↵ect the decision to change the regular retail price at this retail chain is a capacity constraint on the number of price changes each day. This is analyzed in detail by Anderson et al. (2015; forthcoming) who provide details on this policy. The rationale for this capacity constraint is to avoid excessive use of in-store labor that is required to change each regular retail price. For completeness, we also examine whether this capacity constraint a↵ects whether and how much to pass through wholesale price changes.
3.2. Data
Our data consist of n = 11, 852 wholesale price change events faced by the retailer from January 2006 through September 2009. For each event i, we observe four variables of
Scanned Regular Wholesale ● ● ● ● ● ● 2006 2007 2008 2009 Time Pr ice
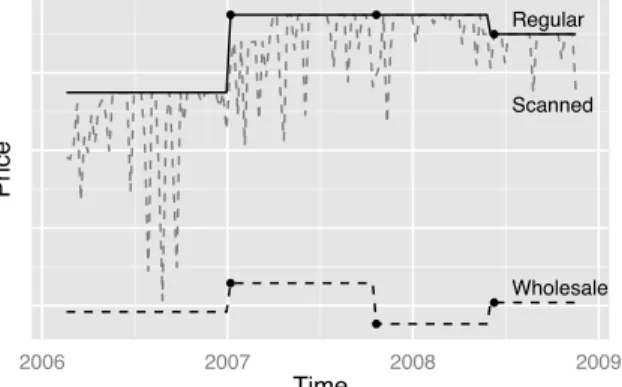
Figure 1 Time Series of Prices for a Single SKU. Scanned prices change frequently relative to wholesale prices
and regular retail prices. Wholesale prices co-vary with regular retail prices but not scanned prices. Observation of wholesale prices and regular retail prices allows us to model the managerial decision process more accurately. We note that, while we observe these three time series for this single SKU, in general we possess only the data described in Section 3.2 and indicated by the six points in the figure; we also emphasize that this figure plots data for a single SKU and thus serves only for illustration.
principal interest: (i) c0,i, the wholesale price charged to the retailer by the manufacturer
before the wholesale price change; (ii) c1,i, the wholesale price charged to the retailer by
the manufacturer after the wholesale price change; (iii) p0,i, the regular retail price (i.e.,
shelf price) charged to consumers by the retailer before the wholesale price change; and (iv) p1,i, the regular retail price charged to consumers by the retailer after the wholesale
price change.
An event in our data is an aggregate for all related flavors or variants of an SKU. For example, the wholesale prices of all flavors of single serve Snapple always change at exactly the same time. Thus, while Snapple may have many single serve SKUs (e.g., single serve Lemon Iced Tea, single serve Raspberry Iced Tea, etc.), a change in the wholesale prices of these SKUs constitutes a single event in our study. Unfortunately, we do not have data on how wholesale price changes a↵ect other retailers. However, conversations with retail managers suggest that competing retailers generally face the same wholesale price change. For example, if the wholesale price of single serve Snapple changes at the retailer in our study, then it is very likely that competing retailers also face a similar wholesale price change.
To demonstrate how the price variables contained in our dataset have a number of unique advantages relative to the data used in prior research, consider Figure 1, which provides a time series of prices for a single SKU. Prior research (Besanko et al. 2005, Bils
Variable 25% Median 75% Mean Std.Dev.
Market Share (Percent) 0.61 1.83 5.03 4.88 8.67
Promotion Frequency (Percent) 0.00 2.27 21.74 15.12 23.78
Promotion Depth (Percent) 0.00 20.40 48.07 25.10 26.01
Shelf Time (Days)? 795 1771 3890 2241.30 1638.74
Time Since Last
266 478 959 746.32 741.56
Wholesale Price Change (Days)?
Proliferation (No. of Brands)? 217 521 1254 739.96 601.71
Revenue (Dollars)? 221.37 550.24 1299.40 1288.86 2959.54
Number of Same Week
52 88 151 105.42 68.82
Wholesale Price Changes (Number)?
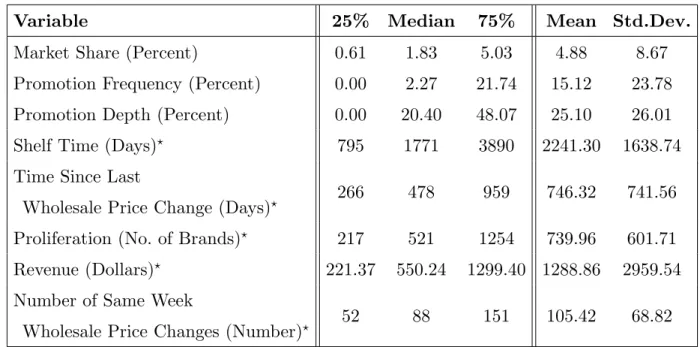
Table 1 Continuous Covariate Summary Statistics. Variables marked with a star enter into our model
logarithmically.
and Klenow 2004, Dub´e and Gupta 2008) has typically worked with the full time series of scanned prices which, as demonstrated in the figure, is typically noisy. Our data contrasts in two notable ways. First, we possess accurate observations of both the regular retail price and the wholesale price; the wholesale price is the current base cost for the item and is not confounded by trade promotions or adjustments for the historical price paid for current inventory. Second, we isolate the points in time for which there is a change in the wholesale price. More concretely, rather than working with the full time series of scanned prices in the figure, we are able to work with the wholesale and regular retail prices immediately before and after the wholesale price changes indicated by the points in the figure. These observations allow us to model the managerial decision process more accurately (see Sections 3.3 and 4 for details).
In addition to information about wholesale and regular retail prices, we observe several auxiliary variables as well as ten covariates. Our auxiliary variables include: (i) SKUi, the
stock keeping unit associated with event i; (ii) d[i], the department of SKUi (e.g., beauty,
snacks, etc.); and (iii) the date associated with event i. Among our ten covariates, there are two binary covariates, namely (i) whether SKUiis private label or national brand (24.9% of
all events are for private label SKUs) and (ii) whether or not p0,i ends in ninety-nine cents
Wholesale Price Regular Retail Price Decrease No Change Increase
Decrease 2.4% 22.7% 1.2%
Increase 0.4% 21.5% 51.7%
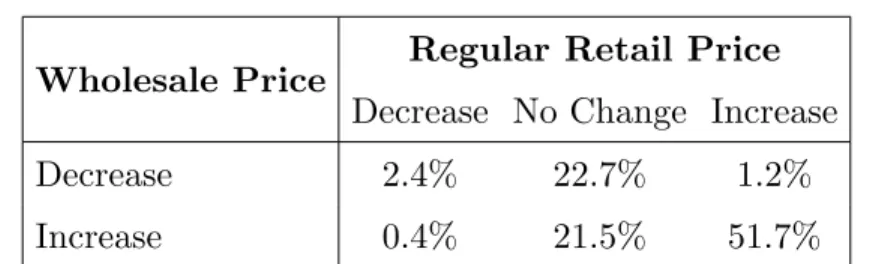
Table 2 Frequency of the Direction of Changes in Wholesale Price and Regular Retail Price. Decreases in the
wholesale price are less frequent and are more often followed by no change in regular retail price whereas increases in the wholesale price are more frequent and more often followed by increases in regular retail price.
continuous covariates are: (i) market share, the dollar sales of SKUi in the ninety-days
prior to the wholesale price change divided by the dollar sales in the department of SKUi in
the ninety-days prior to the wholesale price change; (ii) promotion frequency, the number of units of SKUi sold when SKUi is o↵ered at a promoted price in the ninety-days prior
to the wholesale price change divided by the total number of units sold in the ninety-days prior to the wholesale price change; (iii) promotion depth, the average discount of SKUi on
days it is o↵ered at a promoted price in the ninety-days prior to the wholesale price change; (iv) shelf time, the number of days between the date of event i and the date on which SKUi was first sold by the retailer; (v) time since last wholesale price change, the number
of days between the date of event i and the date of the most recent prior wholesale price change; (vi) proliferation, the number of brands o↵ered by the retailer in the department to which SKUi belongs; (vii) revenue, the dollar sales of SKUi in the ninety-days prior to
the wholesale price change; and (viii) number of same week wholesale price changes, the number of wholesale price changes across all SKUs occurring in the same week as event i. We present summary statistics for these variables in Table 1. Of note is the relative infrequency of wholesale price changes with the median (mean) time between such changes being 478 (746) days.
3.3. Exploratory Data Analysis
Consider sc
i = sgn(c1,i c0,i) and spi = sgn(p1,i p0,i), the direction of the change in the
wholesale price and regular retail price associated with event i respectively, which we summarize in Table 2. Nearly three-quarters of our observed wholesale price changes are increases in the wholesale price and these wholesale price increases are typically followed by increases in the regular retail price. Nonetheless, a large fraction of our observed wholesale price increases are followed by no change in the regular retail price. On the other hand,
about one-quarter of our observed wholesale price changes are decreases in the wholesale price and these wholesale price decreases are typically followed by no change in the regular retail price. This portends two features of the managerial decision-making process. First, the large fraction of wholesale price change events with no change in the regular retail price suggests managers may be adopting a two-stage approach in setting prices: after observing a change in wholesale price, they first determine whether and in what direction to change the regular retail price, and then they determine the magnitude of the change in regular retail price. Second, the asymmetry of responses suggests managers may use a di↵erent process when responding to wholesale price increases versus decreases.
Table 2 also shows a curious behavior: sometimes the retailer increases (decreases) the regular retail price after a decrease (increase) in the wholesale price. We believe that changes to the wholesale price prompt the retailer to re-evaluate their regular retail price, and, consequently, they sometimes react in the unexpected (i.e., opposite sign) direction.
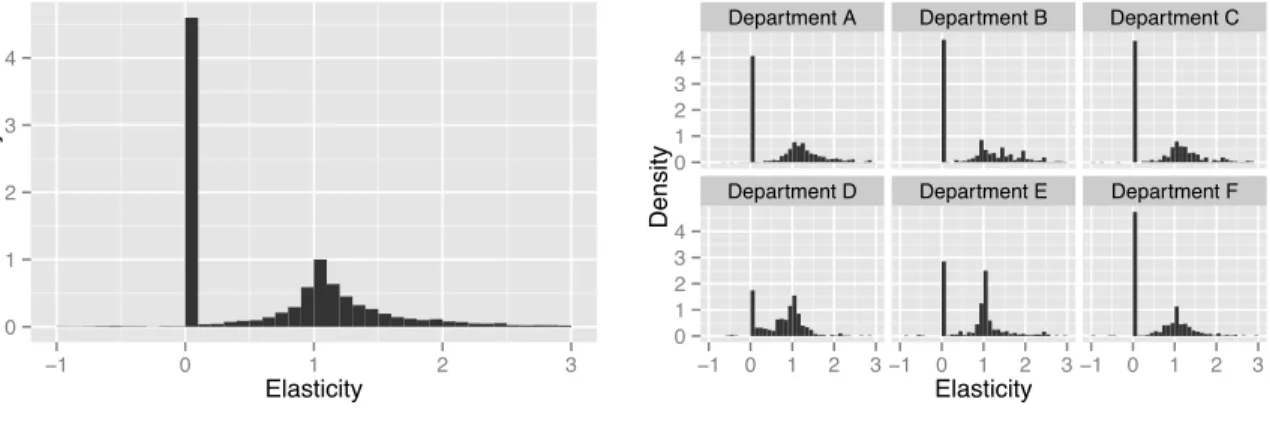
To more deeply examine the relationship between wholesale and regular retail price changes, we plot the change in regular retail price (i.e., p1,i p0,i) versus the change in
wholesale price (i.e, c1,i c0,i) in Figure 2. The observations fall into two distinct groups,
a group of observations for which the change in the regular retail price is zero (and for which the points lie on the y = 0 line in the plot) and a group of observations for which the change in the regular retail price is non-zero (and which tend to be strongly positively correlated with the wholesale price change).
Key features of the relationship between wholesale and regular retail price changes are highlighted by the solid smoothing curve. First, there appears to be an asymmetric price response: for wholesale price increases that are small to moderate the smooth curve overlaps the gray 45 line while for wholesale price decreases the smooth curve is well above the 45 line. This suggests that managers might pass wholesale price increases through on a one-to-one basis but that they decrease regular retail prices commensurately less when faced with wholesale price decreases. Second, for relatively small decreases in wholesale price, the smooth curve essentially lies on the y = 0 line suggesting that relatively small decreases in wholesale prices are generally not passed through to consumers.
The solid smooth curve is fit to all observations and thus ignores a key feature of the data, namely that the data falls into two distinct groups (i.e., those with zero and non-zero changes in regular retails prices). By examining the curve alone, one cannot determine