HAL Id: inserm-00547895
https://www.hal.inserm.fr/inserm-00547895v2
Submitted on 20 Dec 2010HAL is a multi-disciplinary open access
archive for the deposit and dissemination of sci-entific research documents, whether they are pub-lished or not. The documents may come from teaching and research institutions in France or abroad, or from public or private research centers.
L’archive ouverte pluridisciplinaire HAL, est destinée au dépôt et à la diffusion de documents scientifiques de niveau recherche, publiés ou non, émanant des établissements d’enseignement et de recherche français ou étrangers, des laboratoires publics ou privés.
Transcranial ultrasonic therapy based on time reversal
of acoustically induced cavitation bubble signature.
Jérôme Gâteau, Laurent Marsac, Mathieu Pernot, Jean-François Aubry,
Mickaël Tanter, Mathias Fink
To cite this version:
Jérôme Gâteau, Laurent Marsac, Mathieu Pernot, Jean-François Aubry, Mickaël Tanter, et al.. Tran-scranial ultrasonic therapy based on time reversal of acoustically induced cavitation bubble signature.. IEEE Transactions on Biomedical Engineering, Institute of Electrical and Electronics Engineers, 2010, 57 (1), pp.134-44. �10.1109/TBME.2009.2031816�. �inserm-00547895v2�
Transcranial ultrasonic therapy based on time reversal
of acoustically induced cavitation bubble signature
Jerome GATEAU * , Laurent MARSAC ** , Mathieu PERNOT *, Jean-Francois AUBRY * , Mickael TANTER * , Mathias FINK *
* Institut Langevin, ESPCI ParisTech, CNRS UMR 7587, INSERM ERL U979, Paris 7, Laboratoire Ondes et Acoustique, 10 rue Vauquelin, 75 231 Paris Cedex 05, France
** Supersonic imagine, Les jardins de la Duranne - Bât E, 510 Rue René Descartes 13857 Aix-en-Provence, France
Abstract
Brain treatment through the skull with High Intensity Focused Ultrasound (HIFU) can be achieved with multichannel arrays and adaptive focusing techniques such as time-reversal. This method requires a reference signal to be either emitted by a real source embedded in brain tissues or computed from a virtual source, using the acoustic properties of the skull derived from CT images. This non-invasive computational method focuses with precision, but suffers from modeling and repositioning errors that reduce the accessible acoustic pressure at the focus in comparison with fully experimental time-reversal using an implanted hydrophone. In this paper, this simulation-based targeting has been used experimentally as a first step for focusing through an ex vivo human skull at a single location. It has enabled the creation of a cavitation bubble at focus that spontaneously emitted an ultrasonic wave received by the array. This active source signal has allowed 97%±1.1% of the reference pressure (hydrophone-based) to be restored at the geometrical focus. To target points around the focus with an optimal pressure level, conventional electronic steering from the initial focus has been combined with bubble generation. Thanks to step by step bubble generation, the electronic steering capabilities of the array through the skull were improved.
I. INTRODUCTION
To focus an ultrasonic beam with precision through the skull, for transcranial therapeutic purposes, one has to first correct the significant aberrations induced by the skull bone. Indeed, a large discrepancy in acoustic velocities between the brain and the skull tissues (about 1500m/s and 3000m/s respectively), combined with a severe attenuation of ultrasound in the bone, heavily degrade the beam shape, spreading the main lobe energy and increasing the side-lobes [1]. These effects decrease heat deposition at the focus and the spatial resolution, which can reduce therapeutic performance.
As shown by different teams the phase aberrations induced by the velocity discrepancy can be corrected using time shifts [2,3] (i.e. phase shifts for harmonic signals), or time reversal [4]. For transcranial thermal therapy with High Intensity Focused Ultrasound (HIFU), which consists of a local heating of tumorous brain tissue through the skull until necrosis, it is crucial to have the best possible aberration correction in terms of energy deposition. Indeed, as the acoustic energy is proportional to the square of the acoustic pressure amplitude at focus the slightest defect in the pressure amplitude, that is to say in the aberration correction, has significant consequences on the acoustic energy available for the heating of soft tissues. It is therefore important to have a phase aberration correction that tends toward a matched filter. Such a filter maximizes the amplitude of the acoustic pressure at a specified location (focus) and time (for
pulsed signals) for a given energy that is transmitted by the array. Tanter et al. demonstrated in [5], that in spite of the absorption by the skull, time-reversal achieves the performance of a matched filter. In the present paper we attempt to reach experimentally and non-invasively the optimum time-reversal process through the skull.
The first experimental adaptive focusing process using time-reversal that was implemented through the skull, was invasive. Indeed, in this technique proposed in 1996 by Thomas and Fink [6], a hydrophone had to be implanted in the brain to record through the skull the signals from each element of an ultrasound array. The hydrophone was then removed, and one had to emit the time-reversed signals on each array element to automatically compensate for the phase aberrations. The technique was validated experimentally in vitro at low amplitude levels, showing an improvement in the focusing quality. A high power prototype has been constructed [7] and necrosis has been induced in vivo transcranially in the brains of sheep thanks to time reversal correction [8]. In 1998, Hynynen et al. applied an analogous phase conjugation technique with a high-intensity ultrasound system [3].
To perform a non-invasive approach, a time-reversal process based on a prior CT scan acquisition has been proposed [9-10] and tested in vivo [11]. A finite-difference simulation, based on a 3D acoustic model of the skull derived from the CT images, computes the propagation through the skull of a spherically diverging acoustic pulse from a virtual point-like source to the ultrasound array. The signals recorded on the virtual array are then time-reversed and re-emitted experimentally in stereotactic conditions. This computational method has been shown to enable precise control of the location of the focal spot. However errors in modeling and repositioning lead to a suboptimal correction in comparison to what can be achieved using a hydrophone based time-reversal technique. To actually reach the optimum focusing non-invasively, an all-experimental time-reversal process has to be carried out. As a consequence, one has to rely on backscatterers distributed in the region-of-interest and use a point-target based algorithm [12-14]. Different techniques using backscattered random noise have been developed to correct aberrations [15]. However, the statistical estimation of the time delays compensation is noisy and often not good enough to achieve aberration corrections. A strong scatterer that could be used as a point-target would work better. However, in the brain, no such native scatterer is usually available. Some passive sources can nevertheless be implanted using for example acoustic droplet vaporization [16], but a prior injection is then required. In 2006, Pernot et al. [17] demonstrated that an intense ultrasound short pulse is able to induce micro-cavitation, and that the created bubble immediately generates a characteristic acoustic signature. This signature was then successfully used for the time-reversal technique to correct strong aberrations and focus with precision at the prior location of the bubble. With this method, the cavitation bubble acts as an acoustically induced active source embedded in the medium. However, in their studies, two different arrays were used. A spherically curved array was used to induce cavitation through a homogeneous medium, and a linear array recorded the bubble signature through a strong phase and amplitude rubber aberrator. The application of transcranial therapy is more challenging, since it requires generating a cavitation bubble through the skull bone. The focal spot obtained without aberration correction is, however, away from the targeted location and has a large width [7]. Furthermore, the peak pressure amplitude reached is not high enough to efficiently induce cavitation. A preliminary adaptive correction is then needed to be able to generate a bubble and control its position. This preliminary adaptive focusing is referred to in this paper as the first focusing step.
A two-step adaptive focusing technique is presented in the first section of this paper. The aim of the first step is to target the desired location through the skull, and then to induce a cavitation bubble by emitting a high intensity pulse signal from an ultrasonic array. The targeting is achieved with a 3D finite-differences simulation based on ex vivo CT images of a half skull. Note that this first focusing step based on extensive computation is performed only once for the whole protocol, as the bubble generation will enable us to steer the beam at other locations from this first target. The second step is an all-experimental adaptive time-reversal focusing method which uses the acoustic emission of the induced bubble to
maximize the pressure level at the targeted spot.
Once the aberration correction has been performed for one location, it has been shown [18] that the ultrasonic beam can be steered electronically to treat the surrounding area thermally. This process is shorter than repeating the whole process of computing emission signals with the CT scan based simulation and inducing a cavitation bubble. Nevertheless, the presence of the aberrator degrades the accuracy of the focus location and the accessible acoustic pressure while moving away from the initial focus. We demonstrate, in the second section of the present study, that this limitation can be overcome using conventional electronic beam steering as an easy and fast first focusing step to induce new bubbles and then acquire multiple reference signals.
Experiments are conducted in tissue mimicking phantoms through an ex vivo human skull. The feasibility of using this method for maximizing the energy deposition non invasively through the skull bone is demonstrated. Furthermore, the accuracy and the efficiency of both the focusing and the beamsteering techniques are discussed in the framework of brain HIFU therapy.
II. MATERIALS AND METHODS
A. High-Power ultrasonic array
The ultrasonic device is a high-power therapeutic prototype. It comprises 136 individual transducers specially designed by Imasonic (Besancon, France), and mounted on a spherical surface (14 cm radius of curvature) with a semi-random distribution [7] (Fig. 1 b)). These piezocomposite transducers benefit from a specific technology [17] that enables them to reach high acoustic levels (up to 20 W/cm2 intensity on their surface). For brain therapy HIFU treatment, their central frequency was set to 1MHz. The piezocomposite technology provides a large bandwidth (0.7 to 1.2 MHz) for high power transducers, so that they can be used either in harmonic or pulse emission mode. Each transducer is driven by its own fully programmable 18-W electronic channel. All of the 136 channels have an emission electronic board and 54 of them a reception electronic board too (Fig. 1 b)). Each reception board has the following characteristics: bandwidth: 0-15 MHz, sampling rate: 30 S/s, buffer memory: 2 MS, resolution: 9 bits.
B. Skull sample
The half-skull used in this study is an ex vivo human calvaria (i.e. the skullcap or domelike superior portion of the skull). The skull, which was dry from storage in air, was immersed in water and degassed for a week in a vacuum chamber at 60 mm/Hg so that no air bubbles remained trapped in the porous zones. The purpose of these step is to reproduce in vivo conditions as closely as possible [19]. The skull was then fixed on a stereotactic frame at an average distance of 19 mm (+/- 7mm) from the ultrasonic array.
C. Phantoms for in vivo bubble formation
Gel phantoms were prepared with a 1.75% w/v concentration of agar powder (Fluka, BioChemika, for microbiology ref. 05040). The agar powder was first added to stirred cold tap water. The resulting suspension was then covered and gradually heated to near 100°C, until the agar melted and a translucent solution was obtained. The hot solution was then degassed for 2 minutes to avoid bubbles in the final gel, and poured into a cylindrical mold (80 mm inner diameter, and 180 mm height) made of transparent plastic (Polymethyl Methacrylate). The top end was sealed off with a plastic film for one hour, allowing the solution to stand still at room temperature : bubbles potentially created while pouring could thus move up in order to be eliminated. It was then sealed off with a rubber seal lid. After approximately 24 hours at
room temperature, the mold was opened and the gel removed and placed immediately into a bath of degassed water maintained thermostatically at 37°C. Testing began 10 min after immersion. The pH of the gel, measured with pH paper, was: 6-7 . Such gels have been reported to reproduce in vivo conditions of bubble formation under ultrasonic insonification in the low MHz range [20].
In order to perform a statistical study of the cavitation bubble generation, twenty independent zones per gel were sonicated. Three different gels were prepared with a total of 60 different sonicated zones.
The gel was positioned in the water bath only when bubbles were induced. However, the sound speed of the gel is 1.56 x 10³ m.s-1, which is close to that of the surrounding water. Therefore, the presence of the gel is assumed to have a negligible effect on the focusing quality.
a)
b) c)
Figure 1: a) Experimental setup. The drawn configuration corresponds to the part of the experiment where bubbles were induced in the phantom. When the hydrophone is used, the phantom was removed and the device was moved in the vicinity of the geometrical focus of the array. b) Front view of the spherical array. The colored circles represent the projection of the transducers' positions. Black filled circles: transducers only connected to an emitting channel. Gray filled circles: transducers connected to a both emitting and receiving channel. The transducers that both transmit and receive are clustered predominately in the central portion of the array since a quite good spacial sampling of the receive array wanted to be kept, so as to reduce grating lobes. c) Picture of the half-skull mounted on the stereotactic positioning system and positionned in front of the ultrasound array.
D. Emitted signals
The emitted signal parameters such as the shape and the amplitude depend on the application. High intensity pulse-shape signals of a 4 cycle duration were used to induce the cavitation bubbles. All the 136 emitting transducers were used. For pressure field measurements, and for the localization of the peak pressure, long bursts of 200 cycles at 1MHz were preferred. Indeed, both the measured pressure level and
the acoustic intensity estimated by squaring it are then independent of the signal duration as long as it is harmonic. Thus, the measured pressure fields correspond to HIFU treatments conditions, where harmonic signals that typically last for seconds are used. To be able to compare the pressure level accessible with each of the different aberration correction techniques, and in particular the bubble-signature based one, only the 54 emitting transducers connected to a receiving channel were used.
Due to the complex bubble dynamics phenomena at stake, the exact origin of the observed acoustic emission is currently not known. The bubble acoustic emission measured here corresponds to a short pulse. Consequently, for relevant comparison, short pulses of a 4-cycle duration have been used in the numerical simulation and the hydrophone-based time reversal. Harmonic signals were deduced from the pulsed ones by extracting the harmonic component phase at 1MHz using discreet Fourier transform. In this study, the amplitude of the emitted signals was set to the same value for all the array channels in order to be able to obtain the highest possible acoustic power at focus.
For direct pressure field scans, the amplitude of the emitted signals was set to 10% of the maximum value (to avoid damages of the hydrophone and to stay in the linear regime). For pulse emission to induce cavitation, it is set to the maximum.
E. Phase aberration correction with time-reversal
The time-reversal process for phase aberration correction consists of three steps [4]. First, the pressure field is recorded on the transducer array from a pulsed point-like source located in the cranium. This first step can be done directly using the simulation or the acoustic emission of the bubble, or indirectly thanks to spatial reciprocity when using the hydrophone. The recorded signals are denoted:
p
i
t
0≤t≤T
where the exponent i refers to the elementary transducer Ei and T is the duration of the recording. Then, the recorded signals are time-reversed, which means that
p
iRT
t
=p
i
T −t
(Eq. 1) is computed, T being here also the overall delay necessary to insure causality. This step accomplishes automatic compensation for the phase aberration for all the frequencies of the pulse. Indeed, it changes the time delays induced by the phase aberrator in their opposite. Depending on the shape of the desired emission signals further data processing was performed before back-propagation:- For pulse-shape signals, the amplitude of each waveform
p
iRT
t
was normalized to its maximum absolute value∀
tε
[
0,T
]
, p
normalizedi
t
=
p
RTi
t
max
/ t
p
iRT
t
(Eq. 2)- For harmonic signals, the phase
Φ
f0
i
of the harmonic component at f0 (here f0=1MHz) was extracted for each waveform
p
iRT
t
using a discreet Fourier transform algorithm. A long burst sinusoidal signal, containing the phase aberration correction at f0, was then reconstructed :∀
tε
[
0,T
2]
, p
normalizedi
t
=sin
2. π . f
0. t+Φ
if0
(Eq. 3) where T2 is the duration of the burst.The third step consists of sending the waveforms
p
normalizedi
t
with the desired amplitude on the array. An ultrasonic wave is emitted in the medium that converges toward the source of the first step.1) Gold standard: hydrophone-based time-reversal
Thanks to spatial reciprocity, it is equivalent to emit a signal with one transducer of the array and record it on a hydrophone or to use an active acoustic source at the location of the hydrophone and record the signal received on the transducers of the array. To carry out an optimal time-reversal experiment, the hydrophone was placed at the targeted location. Then, each transducer of the array emitted successively a short pulse. After propagation through the skull, these signals were recorded by the hydrophone and
stored successively in the memory. This constitutes the first step of the hydrophone-based time-reversal process. The set of signals is then ready to be time-reversed and re-emitted by the elements of the array. In the whole paper such a process is considered to be the gold standard for the phase aberration correction.
2) 3D CT scan simulation
To target non-invasively the geometrical center of the array a 3D finite differences time domain (FDTD) stimulation, based on an acoustic model of the skull bone, was used. In the FTDT code, the scalar heterogeneous acoustic wave equation without absorption was discretized with a 2nd order in space and time centered scheme [9]. A 4th order approximation Higdon absorption boundary condition was used on the computation volume borders to minimize unphysical reflexions. Discretization parameters were set for the spatial step to 0.15 mm, that is to say a tenth of wavelength at 1MHz in medium surrounding the skull (hot water at 37°C), and for the time step to 20 ns to satisfy the Von Neumann stability condition of the finite difference scheme. The internal skull properties were modeled from a 3D CT scan of the calvaria performed on a Siemens Sensation 16 CT Scanner. The in-plane spatial resolution of the slices was 0.3 mm, and the slice thickness and inter-slice spacing are 0.75 mm and 0.5 mm respectively. The acquisition parameters were set to 120 kV, 203 mA. The 3D Hounsfield unit map was converted to a density map and speed of sound map as described in [9-10]. Both the 3-D density and sound speed maps of the skull were then linearly interpolated to fit the spatial step of the simulation. The skull-array relative position, and the exact transducers' positions and geometrical parameters were also implemented. Once the experimental set-up was reproduced in the model, an omnidirectional point-like source emitting a 4-cycle pulse ( 1MHz central frequency) was created in the computational grid at the geometrical center of the array. After propagation through the bone the pressure field was recorded on the virtual array. The resulting signals reproduce the acoustic field recorded in the first step of an experimental time-reversal aberration correction process. The computation time for a 180x180x150 mm3 volume was three hours. On a high-end PC computer this computation time was reduced to one hour and a half. This improvement makes it is comparable to dose calculations in clinical radiotherapy treatments.
3) Bubble-signature based time-reversal
The use of the acoustic emission of a single cavitation bubble in an adaptive time-reversal process requires first to record its specific pressure field, i.e. the bubble signature. In Pernot et al experiment [7], the signal coming from the bubble was selected using high-pass filtering. This selection technique is not feasible here because the skull acts as a low-pass filter for transmitting ultrasound [21], and the bandwidth of the receiving transducers is limited. Therefore, signal subtraction was chosen.
Pulse-shape signals are emitted toward the targeted position and the same emission signals are transmitted twice, once at low-power level (20% of the maximum amplitude), and then at high-power level (full amplitude). Signal subtraction was then performed on the recorded signals of each transducer :
p
bubble signaturei
t
=p
high power
i
t
−
Amp .
high powerAmp .
low power. p
low poweri
t
(Eq. 4).The resulting waveforms were then aligned and windowed to extract the signature of the bubble. First, a coarse alignment was performed using the time delays of the first focusing step. Then, a fine alignment of the bubble signature signals was performed using a cross-correlation algorithm. The waveforms were cross-correlated with one another. The one that gave the highest correlation coefficient was chosen as the alignment reference and the additional time shifts were deduced from the temporal position of the maximum of its correlations. This fine alignment corresponds to the improvement of the initial aberration correction provided by the first focusing step. When more than one resolvable bubble signature appeared, a time window was applied to select the strongest signature before evaluating the fine alignment. In the rare cases where two or more peaks had approximately the same amplitude, bubbles created further away
from the focal point were removed. Bubbles that might appear within the resolution limit were considered here as a single bubble: they would lead to a spatial distribution of phase aberration almost unaltered since the array is located in the far field of the unresolved sources. After the extraction of the bubble signature, the signals corresponding to the first step of the time reversal process were built by adding coarse and fine delays to the windowed signals.
F. Pressure acoustic field measurements
Acoustic fields were measured behind the half-skull, with the phantom removed, in the degassed water tank maintained at 37°C. A 400 µm aperture needle hydrophone (HCN-400, Onda Corporation, Sunnyvale, CA) was moved along the axes of a cartesian coordinate system using a 3-D positioning system (Newport). The z-axis was set along the array axis, and the two other ones, x- and y-axes, respectively along the horizontal and vertical directions in the focal plane (Fig 1a) ). For all the figures of this paper, the origin of the coordinate system corresponds to the geometrical focus of the array. At each location, the measured signal was pre-amplified (AH-2020, Onda Corporation, Sunnyvale, CA), and recorded by a dedicated reception channel of the electronic driving system. The scan positions and the data acquisition were computer controlled.
For the bubble-signature based harmonic back-propagations, the pressure field was mapped in a 2.1x2.1x16.2 mm3 volume around the theoretical position of the bubble generation. The step along the x- and y- axes was set to 0.6 mm, and along the z-axis to 0.9 mm. The data was twice cubic interpolate (3D interpolation) after propagation. The ratio of the optimal pressure reached at the pressure peak was computed :
r
BP=
P
B
X
r
P
G
X
r
(Eq. 5) where Xr=(xr,yr,zr) is the coordinate vector of the peak pressureposition obtained while emitting the harmonic bubble-signature based emission signals, PB(Xr) is the associated amplitude of the peak pressure, and PG(Xr) is the amplitude of the peak pressure reached at Xr with the harmonic gold-standard correction. The distance from the generating impulse focus location Xt=(xt,yt,zt) was computed too:
D
B=∥
X
t−
X
r∥
(Eq. 6)For the estimation of the quality of the focal spot (Fig. 4), the spacing between the measurement points was set to 0.25 mm for the x- and y-axes and to 0.75 mm along the z-axis. No interpolation was made on the data.
G. Electronic steering capabilities
The transcranial electronic steering capabilities were evaluated, around the geometrical focus, in the focal plane (on a 39.2mm by 39.2mm square surface with a 0.7mm spacing between the target points along the x- and the y- axes), and along the array axis (on a 40mm range with a 1mm spacing between the target points). First, to evaluate the pressure level that could optimally be reached at each target point a hydrophone-based time-reversal process was performed at each location. Using harmonic signals, the pressure level at the corresponding focal point was measured (Fig. 6). The 136 emitting transducers were used.
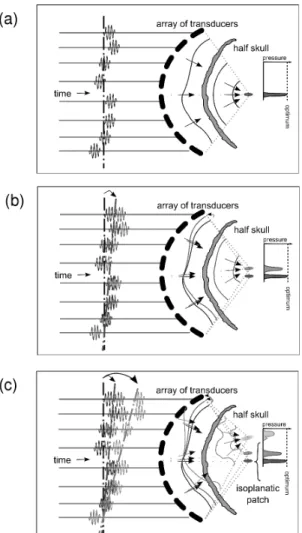
Then, a harmonic emission pattern, that optimally focuses on a reference position, was steered electronically so as to reach all the target points of the region. Conventional electronic steering consists of adding extra phase-delays to the reference emission signals. These additional phase delays were directly deduced from geometrical acoustical path differences, assuming a constant speed of sound in the medium. Due to the defocusing effect of the skull, this technique is only valid in a limited isoplanatic area around the reference position (Fig. 2) [18] (isoplanatic area : area over which the wavefronts are closely correlated).
Figure 2. Concept of conventional steering, illustrated here for targets located in the focal plane of the array and reached using beam-steering from a set of pulse signals which optimally focus on the geometrical center of the array . The focusing of the reference a), and of two other sets b) and c) of signals conventionally steered are shown. The focusing degrades as the distance from the reference position increases since the aberrations encountered by the beams differ. c) also illustrates the concept of isoplanatic patch.
Because the computed delays do not take into account the change in the aberrations encountered by the steered beam, the actual focus location is not exactly the same as the targeted location and the peak pressure amplitude is not optimum. The pressure variation at the focus was investigated as a function of the steering position and compared to the optimum pressure that would be restored at the same point. Each time the beam was electronically steered, the variation index of the pressure at the actual focus with respect to the optimum pressure at the same spot was computed. This variation index
Vi
is represented at the target coordinates, and the corresponding equation is then :Vi
X
t
=1−
P
St,Xt
X
r
P
G
X
r
(Eq. 7) where Xt=(xt,yt,0) or (0,0,zt) is the coordinate vector of the target point, Xr=(xr,yr,0) or (xr,yr,zr) is the coordinate vector of the actual peak pressure position obtained while emitting the harmonic electronically steered beam to target Xt,
P
St,Xt
X
r
is the amplitude of the peak pressure at the actual focus Xr, and PG(Xr) is the amplitude of the peak pressure reached at Xr with the harmonic gold standard correction. The distance between the target point and the reached location was computed too:These two computed quantities assess the efficiency of the steering.
III. RESULTS
A. Two-step focusing: reaching the optimal focusing capacities of the ultrasonic array at its geometrical center
Using the CT-scan based time-reversal process for the first focusing step, cavitation was generated at the geometrical center of the array and the bubble signature was deduced from signal subtraction. A typical example of the different pressure fields recorded at low and high emission amplitude, and the resulting subtraction are shown in figure 3. At low-power level, an acoustic pressure amplitude of 0.6 MPa was reached at the focus. The recorded pressure field consisted only of backscattered echoes (Fig. 3a)). Structural scatterers are naturally present in agar gel due to gel inhomogeneities, however no strong scatterer can be used as a reference source for the time-reversal adaptive focusing method. When the amplitude emitted by the high-power system is set to its maximum value, an acoustic pressure amplitude of 3MPa (linearly extrapolated from low pressure measurement) was reached at the focus. Moreover a bubble appeared and generated a short pulse. Recorded signals containing the signature of one single bubble can be seen in Fig. 3b. Subtracting the signals, the bubble acoustic emission was better selected (Fig. 3c).
Whether the recorded signal comes from the expansion phase or the collapse of the bubble, or from acoustic scattering from the bubble is not currently known. Rebounds from potential collapse were not observed on the recorded signals. This could however be due to the attenuation by the skull. The skull is also a low-pass filter, and the sharp transitions that would be due to potential shock waves are smoothed out before the wave reaches the transducers. The ringing artifacts that may appear on the recorded signals due to the limited bandwidth of the receivers should then be minored.
Figure 3: Backscattered signals recorded by the transducers at a) low power level and b) high power level. The difference c) between b) and a) (with amplitude correction) reveals the bubble signature. For each plot, the data is scaled to use the full colormap.
To determine whether a cavitation bubble was actually induced, the spectrum of the generated pulse was investigated. Due to the limited bandwidth of the array, two passive transducers were placed perpendicularly to the ultrasonic beam axis, along the x-axis to probe respectively the sub-harmonics and harmonic emissions that might occur. The first one had a 500 kHz central frequency with a 300kHz bandwidth at -6dB (M0.5/541, Vermon S.A, France), and the other one a 3.5MHz central frequency with a 3.5MHz bandwidth at -6dB (V382 , Panametrics). With both transducers, even the 3.5MHz one which was sufficiently sensitive, mainly sub-harmonic emission was detected when the emission amplitude was maximum. No such emission could be observed at low power level or at high power when no bubble signature could be distinguished on the signal subtraction (it happened when the insonification was iterated on the same spot). This confirms that cavitation occurred [22]. The second harmonic component remained low in comparison.
Pressure field distribution for four different emission patterns are displayed in Fig. 4 (center and right). For sake of clarity, the shape of the corresponding emission signals is presented on the left. Without any correction (Fig 4a) the focal spot is 6 mm away from the geometrical focus, and is widely spread in comparison to what can be obtained with a hydrophone-based correction (Fig. 4d). With the gold standard correction, the focus is located at the desired position. Moreover, the pressure amplitude of the corrected beam at focus is 2.5 times higher than the highest amplitude accessible with the uncorrected one. The ratio would be even higher with more transducers involved [7].
The phase correction, derived from the ex vivo CT guided simulation, restores the focus location at the geometrical center of the array (Fig. 4b). The pressure amplitude at focus reaches 83% of the optimal pressure. Nevertheless, the focal spot is asymmetric compared to the one obtained with the hydrophone-based correction. The same measurements have been performed with emission signals deduced from the bubble signature (Fig. 4c) : the focal spot is similar to the hydrophone-based one. Since the focus location and the ratio of the optimal pressure (Eq. 5) reached at the pressure peak depend on the cavitation event, the experiment was repeated 60 times to get statistical estimations of their values. The peak pressure amplitude reached 97.5 % +/- 1.1% of the maximum pressure obtained with a hydrophone-based time-reversal focusing at the exact same position.
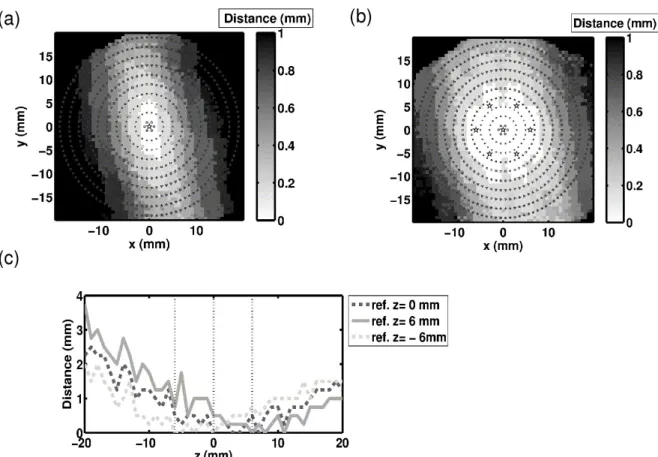
The distance between the focal point of the first focusing step and the focal points corresponding to the bubble-signature based emission (Eq. 6) is 1.1 mm +/- 0.7mm. This distance can be divided into two main different contributions : the projections on the xy-plane (Fig. 5a), and along the z-axis (Fig.5 b) and c)) are respectively 0.28 mm +/- 0.15 mm and 1.04 mm +/- 0.77 mm. The focus location uncertainty is highly affected by its z component because of the larger depth-of-field in this direction. Figure 5 shows that 82% of the pressure peaks are distributed in the -1dB focal area of the initial pulse (measured here at low-power level). The phase aberrations were then optimally corrected non-invasively for the geometrical center of the array.
Figure 4: Harmonic pressure fields measured in the focal zone for different emission patterns: a) emission signals without any adaptive corrections, b) the simulation based emission signals, c) a bubble-signature based emission signals, and d) the hydrophone based time reversal. For each emission pattern, a sample of the harmonic transmit signals are shown (left), as well as the resulting pressure field along the focal (xy) plane (medium) and the xz plane (right). The pressure values are normalized with respect to the maximum reached with the hydrophone-based phase correction (gold standard).
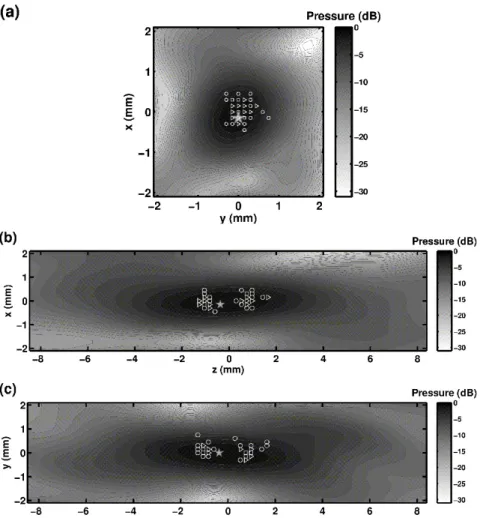
Figure 5: Estimated bubble positions within the focal spot of the first focusing step (simulation based impulse emission), and their occurrence. For each bubble, its estimated position is here the focal point of the harmonic emission signals derived from the bubble signature. The projection of the positions on a) the focal (xy) plane, b) the xz plane and c) the yz plane are shown. The marker symbols depend on the number of bubble at the same location: circles for one bubble, triangles for 2 to 4 bubbles, and squares for 5 to 8. The pressure isolines are distributed every dB. The location of the maximum peak pressure amplitude is pointed out by a gray filled star.
B.
Reaching the optimal steering capabilities of the ultrasonic array in the vicinity of its geometrical center
With the optimal phase-aberration correction (without any electronic steering), all the resulting focal points are exactly localized at the targeted positions. The distribution of the peak pressure obtained is shown in figure 6. The fact that the axial peak in figure 6 b) appears distal to the geometric focal position is due to the defocusing effect of the skull.
The conventional electronic beam steering capabilities of the array from a reference position were evaluated using the 136 emitting transducers. The phase aberrations induced by the skull was first corrected for targeting the geometrical center of the array thanks to a hydrophone-based time-reversal (because the bubble-signature correction is limited to the 54 receiving transducers). Then for each target point, the beam was steered and the variation index of the pressure obtained at the focus with respect to the optimum pressure was computed (Eq. 7). The results are shown in figures 7 a) and c) (curve “ref z=0mm” ). The pressure variation index was thresholded at 0.3 in Fig. 7 a), corresponding to a 50%
energy loss with respect to the optimal correction. The variation index increases with the distance from the reference point almost symmetrically around the array axis. Along the z-axis (Fig. 8c), curve “ref z=0mm” ), the difference to the optimal pressure is low and the variation index does not exceed 7% up to 20mm away from the geometrical center. The distance between the actual focal point (peak pressure location) and the targeted location was also measured (Eq. 8). Electronic steering along the z-axis induces a rapid increase of the positioning errors especially when going away from the array (Fig. 8 c) curve “ref z=0” ). In the focal plane, this error is asymmetric, the y-axis being favored (Fig. 8 a). This effect, not so noticeable for the variation index, might be due to the fact that the angle between the mid-sagittal plane of the skull and the y-axis is only about 0.2 rad. In summary, while targeting transcranially points further and further from the reference position, both the accuracy of the focus location and the ratio of the optimal pressure are degraded.
New references were chosen at a distance of 6 mm from the geometrical focus. In the focal plane, six new references were equally distributed on a circle (Fig. 7b the reference positions are marked with stars). Along the z-axis two references were added on each side of the geometrical center at a 6mm distance. Electronic steering was then studied from each reference. Once all the studies were done, the minimum value over the different studies (each corresponding to a different reference) of the variation index
Vi
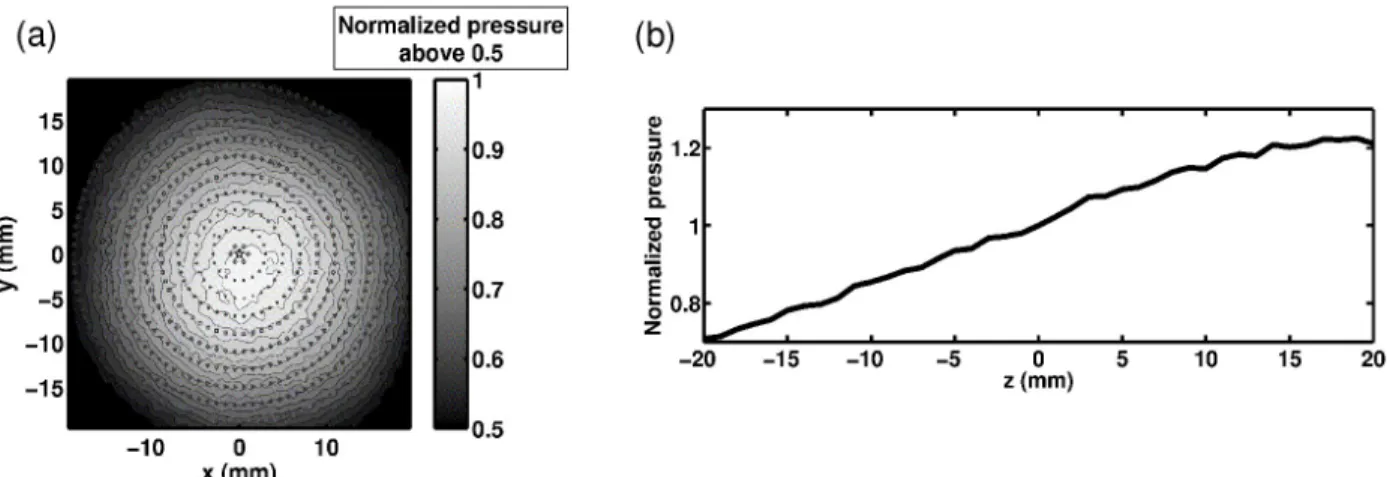
was computed at each target location. The minimum value over the different studies of the distance between the actual focus point and the target point was also computed at each target location. The results are shown in Fig. 7b) and 7c) for the comparison to the optimal peak pressure distribution, and Fig. 8b) and 8c) for the positioning error. In the focal plane, the radius of the area where the variation index stays below 0.1 expanded from 11 mm with only one reference to 15 mm with the combined effects of the seven ones. Concerning the distance to the targeted location, the area of low error was increased too, but the asymmetry of the distribution makes it difficult to express the expansion in term of radius. Along the z-axis, thanks to the combination of the three references, the positioning error improved up to five times for targeted positions more than 15mm away from the array center. In summary, thanks to new reference positions distributed around the geometrical center of the array, significant improvements in terms of focus location and pressure level were made : transcranial conventional electronic beam steering could be performed effectively over larger areas.Figure 6: Peak pressure distribution obtained when the hydrophone based harmonic correction is used to focus along a) the xy plane, b) the z axis. The pressure values are normalized with respect to the geometrical focus one. For a) the geometrical focus is marked with a five pointed star, and is also the center of the superimposed benchmark circles. The fine lines are level curves.
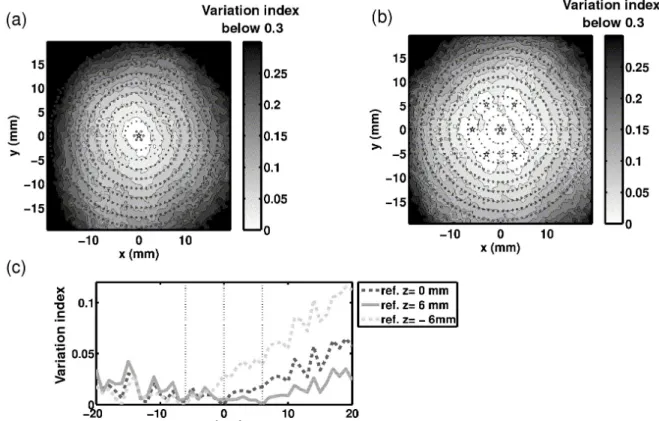
Figure 7: Variation index of the actual peak pressure with respect to the optimum when the focus is steered electronically. In the focal plan, the distribution of the variation index is shown: a) when using one optimal aberration correction performed at the geometrical center of the array, and b) when using the combination of several optimal aberration corrections performed on a 6-point constellation around the center. The constellation points are marked with five pointed stars. Along the z-axis, the distribution of the variation index is shown c) when using three optimally corrected points (the array center plus two others), marked with the vertical dotted lines.
Figure 8: Error made on the focus location after electronic beamsteering of a) one reference emission pattern acquired at the center, and b) 6 other reference emission patterns from a constellation, both in the focal plane, and c) 3 reference emission patterns, along the array axis.
In order to achieve the acquisition of multiple reference signals non-invasively, cavitation bubbles have been induced at the desired locations. The optimal phase aberration correction could then be extracted from their acoustic emissions. The first focusing step is now based on conventional electronic beam steering from an impulse emission pattern (for which the phase-aberration has already been optimally corrected). As the bubble acoustic emission is a short pulse, the initial reference for this impulse steering can easily be extracted from the bubble-signature previously recorded while using the CT guided simulation to target the geometrical center of the array. Nevertheless, with the current set-up, the bubble-signature can only be recorded on 54 transducers, which is not enough to induce a new bubble by back-propagating the conventionally steered impulse signals. Therefore, a hydrophone-based impulse correction for the geometrical center of the array was first recorded for the 136 emitting transducers. These signals were electronically steered to induce bubbles at the positions taken as reference positions in the previous study. These positions are drawn in the 3-D coordinate system in Fig. 9 a). Bubbles at position “zero” were induced using the CT guided simulation. The other positions were targeted using conventional electronic steering, and bubbles were induced using this first focusing step. We repeated the bubble induction experiment 60 times for each position, and performed the whole harmonic adaptive time-reversal process from every bubble signature. For each of them, the ratio of the optimal pressure reached at the peak pressure and the distance between the peak pressure location and the focal point of generating impulse were recorded. Statistical estimations were then computed (Fig. 9 b). Whatever the targeted position, a mean ratio of the optimal pressure between 96% and 98% with a 1% standard deviation could be reached (except for position 7, further from the array, where the standard deviation reached 3%). We can also notice that the uncertainty in the peak pressure location, as when the first focusing step was issued from the CT guided simulation, is strongly affected by its z component for all
the positions.
Thereby, inducing cavitation bubble with electronically steered impulse signals, we were able to acquire new optimally corrected reference signals in the vicinity of the geometrical focus of the array that could be used to enhance the steering capabilities.
Figure 9: Constellation of 8 bubbles generated using electronic beam steering. The position 0, the geometrical center of the array, is reached using the impulse version of the simulation. The positions of the targets are shown on a). For each of the targets, b) shows the pressure reached using the bubble signatures (harmonic emission) with respect to the reference pressure obtained using the hydrophone-based time reversal performed at the exact same location. c) shows the distance between the actual estimated bubble position and the focal point of first focusing step .
IV. Discussion
Acoustically induced cavitation bubbles have been shown to be an effective source to optimally correct the phase aberrations caused by the skull bone in vitro. For an in vivo implementation, the whole technique presented in this paper relies on the ability to acoustically induce microcavitation in brain tissue and detect its acoustic emission through the skull. Thus, the brain tissue cavitation threshold must be exceeded to ensure that a bubble is created for every insonification. As this threshold may differ from person to person, it could be estimated adaptively for each patient by increasing step by step the transmit beam amplitude up to the appearance of a bubble signature. This process would avoid uncontrolled cavitation outside the targeted location, and limit the number of acoustic sources generated at this location since the cavitation threshold would only be exceeded slightly.
Determining a reference mean value of the in vivo cavitation threshold is a challenge, since most of the techniques developed for in vivo detection are not sensitive to a small number of cavitation bubbles [23]. For brain tissue, the only documented experimental cavitation detection technique has been lesioning. This technique requires a large number of bubbles to be effective, and it is therefore destructive. Using this method, Fry and al [24] determined that the brain cavitation threshold at 1MHz is approximately 400 W/cm2 (SPTP, no indication of irradiation time) for dog brain tissue, which corresponds to a 3.5 MPa peak pressure. With the hypothesis that no cavitation nuclei pre-exist in vivo, Church [25] combined observations of cavitation during lithotripsy and theoretical analyses of spontaneous nucleation and bubble dynamics in liquids to obtain a minimum cavitation threshold of at least 4.6 MPa, for a one-cycle pulse of 1MHz. Moreover, given the size of cavitation nuclei formed by homogenous nucleation [25], this threshold is theoretically independent of the pulse length [26]. Despite the difficulty in assessing them,
these two threshold values are consistent. They might, however, over-estimate the real threshold value because of evidence that gas nuclei may pre-exist in living tissue [27], and lesioning is unable to detect microcavitation.
With our experimental set up we were able to reach, with harmonic signals at 1MHz and full amplitude, an optimal pressure of 3 MPa (linearly extrapolated from low pressure measurement) at the geometrical focus of the array, using 136 transducers. This pressure level in combination with pulsed signals, enabled us to record, for all targeted positions a bubble signature at each insonification. We observed that, depending on the gel position and for a single emission event, one to four bubble signatures could be identified from the received signals. The strongest one was selected for further treatment. Moreover, when repeating the bubble induction at the exact same gel position, we found out that after two to five iterations depending on the gel position, a bubble signature could no longer be identified, and only background signals from the gel itself remained. These two observations support the idea that cavitation nuclei exist in agar gel [28]. Indeed, it is very likely that one (or more) of these randomly distributed nuclei is close enough to the acoustic pressure peak, has a radius large enough to become destabilized and can generate its own signature. This would also explain the variation in the peak pressure spatial position between the bubble-signature-based harmonic back-propagations (Fig. 5), as these back-propagations are focusing toward their sources. In addition, since the system is static, the depletion of cavitation nuclei large enough to be excited in the insonified zone could explain the loss of bubble signatures after a few emissions at the same location. Gas nuclei are more difficult to model in vivo [27] than in a gel, and therefore their dynamics and location in brain tissue are even more difficult to predict. However, it should be feasible to destabilize some nuclei using a high enough pressure level. This pressure level would anyway be of the order of the one used for HIFU therapy. Considering that the irradiation time is six orders of magnitude smaller for cavitation bubble induction, the energy deposition is far lower.
The location of the cavitation events within the generating acoustic pressure field is another important issue. Using the bubble-signature-based harmonic signals focused back to their original source, it has been shown that these events occur in the immediate vicinity of the generating beam focal point for any of the targeted positions (Fig. 5) and 9.b) ). The distribution of the cavitation events extends preferentially along the axis of propagation rather than perpendicularly to it. This effect is due to diffraction. Nevertheless, since we plan to steer the beams with an optimum correction based on bubble signatures, it is important to assess the effect of a small translation along the z-axis of the reference focus point on the location of the steered beam focus. With a first order approximation, the direction of the steered beam has been calculated to maintain the same angle relative to the array axis, but it will focus on the same unknown z-coordinate as the reference beam. This effect thus appears to be small but might become significant if the steering process from bubble-signature based corrected beams is iterated.
It has been shown that the conventional transcranial electronic beam steering capabilities of our array have improved thanks to the introduction of reference signals for discreet points located in the region-of-interest. Since electronic steering from one reference gives satisfying results in its immediate vicinity, the region-of-interest may then be spatially divided into cells, the center of each being occupied by a different reference (Fig. 7.b) and 8.b)). These new references are determined by the step-by-step steering process, which consists of using recorded bubble signatures to induce new cavitation bubbles in the vicinity of the previously corrected locations.
The area accessible with this step-by-step technique is, however, limited by the single element directivity pattern since the optimally accessible pressure in the focal plane also decreases with the distance from the geometrical center of the array. Far from the geometrical focus, the pressure level might then not be sufficient to induce cavitation. This limitation is intrinsic to the ultrasonic system geometry and will also limit the effectiveness of thermal deposition to approximately the same area. The optimal pressure non-uniformity in the vicinity of the geometrical center is primarily due to the inherent steering capabilities of the array, linked to the shape of the holder, and the size, distribution, and directivity of the transducer elements. In a homogeneous medium like water, it has a Gaussian distribution in the focal plane, that is
centered on the array axis. The presence of the aberrator makes it asymmetrical around this axis (Fig. 6.a). This asymmetry can be attributed to the asymmetry of the skull heterogeneities (and thus of the global absorption).
The step-by-step steering process is a major advantage of the adaptive focusing technique presented in this paper. To our knowledge, such an approach is faster and more efficient than any other adaptive technique to extend the aberration correction in the vicinity of a primary corrected spot. It provides an optimally corrected new reference within a few seconds. The whole technique is costly as far as equipment is concerned, because it requires as many receiving channels as emitting channels (with a quite large bandwidth to generate and record the bubble signatures), which can represent up to 500 to 1000 items for an ultrasonic brain therapeutic system. Nevertheless, multi-element arrays with transmit and receive capabilities are becoming increasingly widespread.
V Conclusions
The results of this in vitro study demonstrate the potential of the new two-step adaptive focusing technique based on acoustically induced cavitation bubble signatures: the optimal focusing and steering capabilities of a HIFU array through human skulls can be obtained within a very short time. The technique is physically limited by the back and forth propagation of the ultrasonic wave (200µs for an array with 15cm radius of curvature). Furthermore the whole process is non-invasive. From one CT image based initial simulation, which sets the initial targeted location, the focusing was optimally restored transcranially by inducing a cavitation bubble at this location. Taking advantage of this aberration correction, the corrected zone was extended by electronic beam steering and discreet bubble generation to benefit as much as possible from the intrinsic steering capacities of the array. This method should benefit transcranial brain therapy.
References
[1] D.N. White, J.M. Clark, J.N. Chesebrough, M.N. White and J.K. Campbell, " Effect of skull in degrading the display of echoencephalographic B and C scans." , The Journal of the Acoustical Society of America, Vol. 44, pp.1339-1345, November, 1968 .
[2] D. Phillips, S. Smith, O. Von Ramm, and F. Thurstone, “Sampled aperture techniques applied to B-mode echoencephalography,” Acoustical Holography , Vol. 6, pp 103–120, 1975 .
[3] K. Hynynen, FA. Jolesz, “Demonstration of potential noninvasive ultrasound brain therapy through an intact skull.” Ultrasound in Medicine and Biology, Vol. 24, pp 275-283, February 1998
[4] M. Fink, G. Montaldo, M. Tanter, “Time-reversal acoustics in biomedical engineering”, Annual Review of Biomedical Engineering, Vol. 5, pp 465-497, August 2003
[5] M. Tanter, J.-L. Thomas, M. Fink, “Time reversal and the inverse filter” The Journal of the Acoustical Society of America, Vol. 108, pp 223-234 , July 2000
[6] J.-L. Thomas, M. Fink, " Ultrasonic beam focusing through tissue inhomogeneities with a time reversal mirror: application to transskull therapy" , IEEE Trans. Ultrason., Ferroelect., Vol. 43, pp 1122-1129, Novembre 1996
ultrasonic brain therapy”. Phys. Med. Biol. Vol. 48, pp 2577–2589, July 2003
[8] M. Pernot, J.-F. Aubry, M. Tanter, A.-L. Boch, F. Marquet, M. Kujas, D. Seilhean, M. Fink, “In vivo transcranial brain surgery with an ultrasonic time reversal mirror”, J Neurosurg., Vol. 106, pp 1061-1066, June 2007.
[9] J.-F Aubry, M. Tanter, M. Pernot, J.-L Thomas, M. Fink, “Experimental demonstration of noninvasive transskull adaptative focusing based on prior computed tomography scans”, J. Acoust. Soc. Am. , Vol. 113, pp. 84-93, January 2003
[10 ] F. Marquet, M. Pernot, J.-F. Aubry, G. Montaldo, L. Marsac, M. Tanter, M. Fink, “Non-invasive transcranial ultrasound therapy guided by 3D CT-scans: protocol validation and in-vitro results”, to appear in J. Acoust. Soc. Amer.
[11] M. Tanter , M. Pernot, J.-F. Aubry, G. Montaldo ,F. Marquet, M. Fink, “Compensating for bone interfaces and respiratory motion in High Intensity Focused Ultrasound”, International Journal of Hyperthermia, Vol. 23, pp 141-151, March 2007
[12] S. Flax, M. O'Donnell, “Phase-aberration correction using signals from point refectors and diffuse scatterers: Basic principles.”, IEEE Trans Ultrason Ferroelec Freq Control, Vol. 35, pp 758 -767, November1988;
[13] D. Zhao, G. E. Trahey, “Comparisons of image quality factors for phase aberration correction with diffuse and point targets: Theory and experiments”, IEEE Trans Ultrason Ferroelec Freq Control, Vol. 38, pp 125-132, March 1991
[14] M. Fink, “Time-reversal of ultrasonic fields - part I: Basic principles”, IEEE Trans Ultrason Ferroelec Freq Control, Vol. 39, pp 555-566, september 1992
[15] L. Nock, G. E. Trahey, and S. W. Smith "Phase aberration correction in medical ultrasound using brightness as a quality factor," J. Acoust. Soc. Amer., Vol. 85, pp. 1819-1833, 1989.
[16] K. Haworth, J. Fowlkes, P. Carson, O. Kripfgans, “Towards Aberration Correction of Transcranial Ultrasound Using Acoustic Droplet Vaporization”, Ultrasound in Medicine & Biology, Vol. 34, pp 435-445, March 2008
[17] M. Pernot, G. Montaldo, M. Tanter, M. Fink, “ “Utrasonic stars” for time-reversal focusing using induced cavitation bubbles”, Appl Phys Lett. , Vol. 88, January 2006
[18] M. Tanter, J.L. Thomas, M. Fink. “Focusing and steering through absorbing and aberrating layers : Application to ultrasonic propagation through the skull”, Journal of Acoustical Society of America, Vol. 103, pp. 2403-2410, May1998.
[19] White, P.J. Palchaudhuri, S. Hyuynen, K. Clement, G.T. , “The Effects of Desiccation on Skull Bone Sound Speed in Porcine Models”, IEEE Trans. Ultrason., Ferroelect., Vol. 54, pp 1708-1710, August 2007
[20] S. Daniels, D. Blondel, L. A. Crum, G. R. Ter Haar , M. Dyson “Ultrasonically induced gas bubble production in agar based gels. I: Experimental investigation”, Ultrasound in medicine & biology, Vol. 13, pp. 527-539, 1987
[21] F. J. Fry, J. E. Barger “Acoustical properties of the human skull” J. Acoust. Soc. Am., Vol. 63, pp 1576–1590, 1978
[22] E. A. Neppiras, ‘‘Acoustic Cavitation,’’ Physics Reports, Vol. 3, pp 159–251 1980 .
[23] S. B. Barnett, “Nonthermal issues: cavitation-its nature, detection and measurement,” Ultrasound Med. Biol., Vol. 24, pp. S11-S21, 1998.
[24] Fry, F. J. Sanghvi, N. T. Foster, R. S. Bihrle, R. Hennige, C. “Ultrasound and Microbubbles: Their Generation, Detection and Potential Utilization in Tissue and Organ Therapy-Experimental” Ultrasound in medicine & biology, Vol. 21, pp 1227-1238, 1995
[25] CC Church, “Spontaneous homogeneous nucleation, inertial cavitation and the safety of diagnostic ultrasound”, Ultrasound Med. Biol., Vol. 28, pp 1349–1364, October 2002
[26] CC Church, “Frequency, pulse length, and the mechanical index“ Acoustics Research Letters Online Vol. 6, pp. 162-168, July 2005
[27] J.E. Blatteau, J.B. Souraud, E. Gempp, A. Boussuges, “Gas nuclei, their origin and their role in bubble formation”, Aviat Space Environ Med, Vol. 77, pp 1068–1076, 2006
[28] L. Crum, S. Daniels, G. Ter Haar, M. Dyson, “Ultrasonically induced gas bubble production in agar based gels: Part II, theoretical analysis”, Ultrasound in Med & Biol, Vol. 13, pp 541-554, 1987