HAL Id: hal-02448241
https://hal-univ-lemans.archives-ouvertes.fr/hal-02448241
Submitted on 27 Jan 2020
HAL is a multi-disciplinary open access
archive for the deposit and dissemination of
sci-entific research documents, whether they are
pub-lished or not. The documents may come from
teaching and research institutions in France or
L’archive ouverte pluridisciplinaire HAL, est
destinée au dépôt et à la diffusion de documents
scientifiques de niveau recherche, publiés ou non,
émanant des établissements d’enseignement et de
recherche français ou étrangers, des laboratoires
Source directive de vagues dans un cristal de cylindres
émergeant en surface
Mathieu Chekroun, Agnès Maurel, Vincent Pagneux, P. Petitjeans
To cite this version:
Mathieu Chekroun, Agnès Maurel, Vincent Pagneux, P. Petitjeans. Source directive de vagues dans
un cristal de cylindres émergeant en surface. Comptes Rendus Mécanique, Elsevier Masson, 2015, 343
(12), pp.689 - 699. �10.1016/j.crme.2015.06.005�. �hal-02448241�
Directional source of water waves by a crystal of surface piercing
cylinders
M. Chekroun
a, A. Maurel
bV. Pagneux
aP. Petitjeans
caLAUM, Univ. du Maine, Av. O. Messian, Le Mans, France bInstitut Langevin, ESPCI, 1 rue Jussieu, Paris 75005, FRRance
cPMMH, ESPCI, 10 rue Vauquelin, Paris 75005, France Received *****; accepted after revision +++++
Presented by
Abstract
The feasibility of using the band structure of a crystal to realize directional emission of water waves is investigated numerically and experimentally. The directionality of a source inside a square array of cylinders is obtained numerically for a perfect lattice in a lossless liquid. But in the experiments, the directivity is weakened, due to the effects of losses. Nevertheless, the waves are shown to satisfy the Helmholtz equation when proper attenuation is accounted for. Thus, the robustness of the directionality is studied numerically with respect to the effects of the attenuation and of the disorder. To cite this article: A. Name1, A. Name2, C. R. Mecanique 333 (2005). R´esum´e
Source directive de vagues dans un cristal de cylindres ´emergeant en surface. On ´etudie la faisabilit´e d’une source directive pour les ondes `a la surface de l’eau, bas´ee sur les propri´et´es de la structure de bande d’un cristal. Cette directivit´e est caract´eris´ee num´eriquement pour un r´eseau p´eriodique de cylindres rigides dans un fluide parfait. Dans l’exp´erience, la directivit´e est affaiblie, `a cause de l’att´enuation. Cependant, en prenant en compte cette att´enuation, la propagation des ondes est toujours correctement d´ecrite par l’´equation de Helmholtz. Aussi, la robustesse de la directivit´e est-elle ´etudi´ee num´eriquement plus en d´etail, vis-`a-vis des effets d’att´enuation et de d´esordre.
Pour citer cet article : A. Name1, A. Name2, C. R. Mecanique 333 (2005).
Key words: Keyword1 from list ; Keyword2 ; Keyword3 Mots-cl´es : Mot-cl´e1 de la liste ; Mot-cl´e2 ; Mot-cl´e3
Email addresses: [email protected] (M. Chekroun), [email protected] (A. Maurel), [email protected] (V. Pagneux), [email protected] (P. Petitjeans).
Version fran¸caise abr´eg´ee
Dans cette ´etude, la directivit´e d’une source d’´emission plac´ee dans un r´eseau p´eriodique est ´etudi´ee, num´eriquement et exp´erimentalement, dans le contexte des ondes de gravit´e se propageant `a la surface de l’eau. Si ces ondes satisfont, dans des cas limites, une ´equation d’onde identique `a celle v´erifi´ee par les ondes acoustiques et par les ondes ´electromagn´etiques en deux dimensions (l’´equation de Helmholtz, Eq. (1)), elles pr´esentent une complexit´e souvent n´eglig´ee. Dispersives, non-lin´eaires dans des conditions usuelles, susceptibles d’ˆetre affect´ees par des modes ´evanescents dans le volume du fluide d`es que la bathym´etrie du fond sous marin varie brutalement, d’ˆetre affect´ees par le comportement de m´enisques pour des obstacles ´emergeant hors de l’eau, les ph´enom`enes attendus par simple inspection de l’´equation de Helmholtz doivent ˆetre regard´es avec vigilance au regard d’exp´eriences qui diront si, oui ou non, ces ph´enom`enes sont robustes. Dans ce papier, nous donnons des ´el´ements de r´eponse `a cette question dans le cas de l’hyper directivit´e pr´edite par Mei et al. [13] dans le contexte des ondes `a la surface de l’eau. Pour ce faire, nous caract´erisons, num´eriquement et exp´erimentalement, les ondes ´emergeant d’un r´eseau p´eriodique (un cristal de taille fini) pour une fr´equence en bord de bande, c’est-`a-dire pour laquelle la structure de bande pr´edit que seul un ´etroit faisceau d’onde peut s’´echapper d’une structure p´eriodique lorsqu’une source est plac´ee en son centre. Cette directivit´e de la source est test´ee exp´erimentalement, pour un r´eseau de cylindres ´emergeant (Figure 1).
Dans la section 2, nous montrons que pour une fr´equence au bord de la bande interdite, et pour une position disymm´etrique de la source dans le r´eseau, une tr`es bonne directivit´e peut ˆetre obtenue (position B sur la Figure 1) ; cette directivit´e est illustr´ee par le diagramme d’´emission (Figure 2(c)) ainsi que par le comportement d’indicateurs (i) la section totale de diffusion, Eq. (5), qui mesure l’´energie totale sortant du r´eseau et par (ii) une mesure de la directivit´e D, Eq. (6), qui mesure la proportion de l’´energie contenue dans les faisceaux directifs autour des directions ϕ = 0, π (le long de l’axe x). La figure 3 montre que ces deux indicateurs pr´esentent un optimum pour la fr´equence en bord de bande f = f0 = 5.69 Hz et pour une source en position B, r´ealisant ainsi une source directive. Dans la Section 3, cette pr´ediction est test´ee exp´erimentalement. Nous utilisons une technique de profilom´etrie par transform´ee de Fourier (FTP) qui permet une mesure r´esolue en temps et en espace du champ des “vagues”, c.a.d. de l’´el´evation de la surface libre du fluide (Figure 4), ainsi que la reconstruction du champ complexe η1(x, y) correspondant `
a la fr´equence d’excitation de la source, Eqs. (7)-(8). Les exp´eriences sont conduites pour une position de la source en A, non directive (Section 3.2), et pour une position de la source en B, pour laquelle la direc-tivit´e est attendue `a la fr´equence f0 (Section 3.3). Nous observons que la directivit´e est affaiblie : Figure 7(a) (champ exp´erimental) `a comparer `a (c) (champ th´eorique). Ceci est due `a une att´enuation tr`es forte dans le syst`eme r´eel, et qui est d´etermin´ee en ajustant ce param`etre dans la simulation num´erique. Dans tous les cas, un excellent accord exp´erience/ th´eorie est alors retrouv´e, qualitativement sur les champs spatiaux, Figs 5 et 7 (a)-(b) et (d)-(e), et quantitativement sur les diagrammes d’´emission, Figs 6 et 8. L’origine de cette forte att´enuation est probablement li´ee au comportement dynamique des m´enisques sur les cylindres, qui n’est pas pris en compte dans la mod´elisation. Cette ´etude exp´erimentale r´ev`ele que l’hyper directivit´e attendue est sensible `a des ´ecarts au cas id´eal d’un milieu parfaitement p´eriodique et sans pertes. Cependant, parce que l’´equation mod`ele de Helmholtz n’est pas mise en d´efaut, nous terminons notre ´etude en Section 4 par une ´etude num´erique plus syst´ematique de la directivit´e de la source en fonction de l’att´enuation et du d´esordre dans le milieu, effets qui peuvent exister dans tous les contextes d’ondes. Il est montr´e que l’att´enuation et le d´esordre ont le mˆeme effet, fort `a la r´esonance, d’affaiblissement des interf´erences constructives qui produisent la directivit´e. Pour conclure, il est cepen-dant probable que l’affaiblissement de la directionalit´e observ´ee dans une exp´erience de laboratoire soit moins important `a l’´echelle des vagues en mer puisque l’att´enuation est moins forte `a cette ´echelle.
1. Introduction
Man made photonic and phononic crystals have generated an intense research interest since the 1990’s for their ability to produce unusual properties of wave propagations [1,2,3]. This is because it is possible to engineer the band structure to constrain the wave to follow peculiar directions or to produce complete band gaps where wave propagation is forbidden. Resulting superlensing and self-collimation effects have been reported for electromagnetic [4,5], acoustic [6,7] and elastic [8,9] waves. More recently, the interest has been extended to the case of gravity water waves [10,11], because they share, in some limiting cases, the same wave equation than electromagnetic and acoustic waves. However, surface waves have a complexity that is often neglected. Dispersive, non-linear in usual conditions, they are also susceptible to be affected by evanescent modes in the bulk of the liquid as soon as the bathymetry of the sea bottom varies rapidly and may experience strong damping. To cite Richard Feynman, “[water waves] that are easily seen by everyone and which are usually used as an example of waves in elementary courses [. . . ] are the worst possible example, because they are in no respects like sound and light; they have all the complications that waves can have” [12]. Thus, the phenomena expected by the simple inspection of the Helmholtz equation have to be considered carefully by means of experimental studies, able to say whether or not the phenomena are robust.
In 2010, Mei and co-authors [13] proposed the design of an highly directional source for water waves based on the band-structure of a periodic array of surface piercing cylinders. The idea behind directionality is to work at a frequency very near the complete band gap where only small angular regions allow the wave propagation, most of the directions being otherwise forbidden. In this paper, we inspect experimentally the feasibility of such directional source. This is done by using a space-time resolved profilometry technique able to provide quantitative measurements [14,15,16], beyond the usual qualitative visualizations. The paper is organized as follow. In Section 2, we use numerical calculations of Multiple Scattering Theory (MST) to design the crystal. Following [13], two positions of the source are considered among which only one provides the expected directionality, when working at the band edge frequency. Section 3 presents the experimental results in the same conditions. It is found that the wave experiences an high attenuation, or damping, which weakens the directivity. Nevertheless, it is shown that the wave field still satisfies the Helmholtz equation, which is proven by computing MST solutions using the damping as adjustable parameter. The fitted damping is unexpectedly high, and might be attributable to the dynamics of the contact lines of the meniscus at the cylinders [17,18]. This attenuation is responsible for the some loss of directivity, not only because less energy emerges from the array but because it changes the directivity function, that is the directionality of the structure. Accounting for actual attenuation in the numerics allows to get an excellent agreement with the experimental results. As the validity of the Helmholtz equation is not in question, we end our study in Sec. 4 by inspecting more systematically the influence of the attenuation and of the disorder on the efficiency of the directional source.
2. Configuration of the set-up to produce directive source
The propagation of water waves, in the frequency regime (frequency ω), is described by the Helmholtz equation
(∇2+ k2)η(r, ω) = 0, (1)
where η is the water height and k is the wavenumber. This equation is obtained under the assumptions that the flow is incompressible, irrotational, inviscid and that the water depth at rest, h0, is constant (flat sea bottom) [19]. Then, k is given by the dispersion relation for linear water waves
ω2= gk tanh(kh0), (2) with g the gravity constant. In the presence of rigid, surface piercing, obstacles, Neumann boundary condition applies
∂nη|Rig.Obs. = 0, (3)
with ∂nthe normal derivative. This translates the slip boundary condition for inviscid fluid and omits the presence of meniscus. These simplified equations for water waves present an analogy with the acoustic and electromagnetic waves. In this section, we follow the idea of Ref. [13] to build a set-up, based on the band structure of a crystal and able to produce an ultra directional source of water waves.
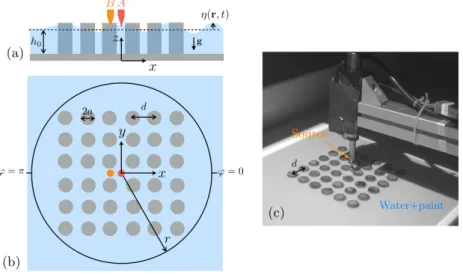
Figure 1. Geometry of the 6×6 square lattice (a) side view and (b) top view, (c) experimental set-up; A and B show the two source positions inside the array.
The crystal consists of vertical rigid surface piercing cylinders of radius a = 10 mm equally spaced on a square array of periodic d = 30 mm, resulting in a filling fraction of φ = πa2/d2' 0.35. The structure, composed of 6×6 cylinders, is immersed in water of depth h0= 33 mm (Fig. 1). The small dimension of the array will be justified later, in view of the attenuation experienced by the wave in the practice. Two positions of the source are inspected. The position A is at the center of the square array; in the position B, the source is shifted by d/2 along the x-axis; this latter position of the source point has been shown to produce the highly directional source [13]. The band structure of the infinite crystal has been given in [13], exhibiting a complete band gap below the frequency f0 being the band-edge frequency (f0 = 5.69 Hz in our case). Just above the band edge, the directions ΓK (ϕ = 0, π along x and ϕ = ±π/2 along y in Fig. 1(b)) become propagating with high density of states. It results an angular band gap able to narrow the angular distribution of a beam generated by a source point located inside the array. This is the basic idea behind the concept of ultra directional wave source.
We performed numerical calculation of the solution in the idealized case of Eqs. (1)-(3) using Multiple Scattering Theory (MST, see e.g. [13,20]) for our array of rigid cylinders and for a line source emitting cylindrical waves (at position A or B). For the ease of comparison with experimental measurements, and to quantify the angular distribution of the water wave beam, we use the normalized directivity function of the wave intensity
ftot(ϕ) ≡ 2π |η(r, ϕ)| 2
R2π
0 dϕ |η(r, ϕ)|2
, (4)
with η(r, ϕ) being calculated at distance r from the source (in the practice, r = 120 mm will be used). Note that, for this low value of r (wavelengths will be typically in the range 30 to 60 mm), ftot does
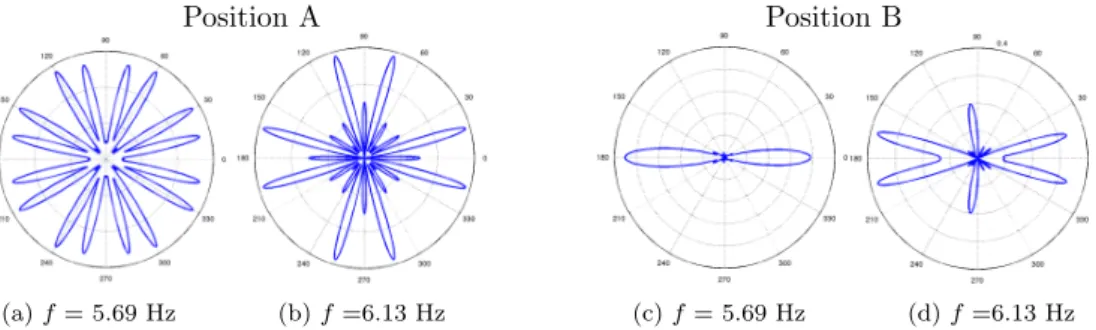
not correspond to the definition of the directivity function, being usually defined in the far field region. Again, this is due to the actual damping in the experiments which renders unaccessible the far field region; nevertheless, we have checked that the tendencies observed in this quite near field remain the same in the far field. MST solutions have been calculated for f = f0= 5.69 Hz and f = 6.13 Hz. The directivity functions are reported in Fig. 2 for the point source at positions A and B. As observed in [13], point source at position A does not reaches directional emission while the non symmetrical position B reaches this goal, because of the cut off of the emission branches at ϕ = π/2, 3π/2 (along y). Also, the lobe corresponding to the beam emerging at ϕ = 0 is lower than the one corresponding to the beam emerging at ϕ = π because the distance of propagation from the source is higher. Note that this relative weakness of the lobe at ϕ = 0 is not due to the attenuation inherent to water wave (and which occurs in infinite medium) since this latter is not accounted in the present MST calculations, but to the attenuation due to multiple scattering by the cylinders (3 rows between the source and the array exit in the direction ϕ = 0 and only 2 rows in the direction ϕ = π). The wavefields corresponding to these 4 cases will be reported latter in Figs. 6 (c) and (d) and Figs. 8 (c) and (d) respectively, for comparison with experimental wavefields.
Position A Position B
(a) f = 5.69 Hz (b) f =6.13 Hz (c) f = 5.69 Hz (d) f =6.13 Hz
Figure 2. Directional emission, ftot(ϕ) in Eq. (4), of the source embedded in the lattice (a)-(b) with the point source at A and (c)-(d) with the point source at B. Frequencies are (a) and (c) at f = f0= 5.69 Hz (band edge frequency), (b) and (d) at f = 6.13 Hz. Corresponding wavefields are shown in Figs. 6(c) and (f) for position A and 8(c) and (f) for position B.
Next, to quantify the emission of the array, we define two quantities: (i) the total cross section
σt= 2π Z
0
dϕ |η(r, ϕ)|2, (5)
which represents the wave energy, from the source, which emerges from the array and this quantity is normalized by σinc which represents the wave energy, from the source, in the absence of the array. (ii) Also, as an indicator of the proportion of the wave energy emerging in beams along the x-direction, we use D = 1 σt ∆ϕ/2 Z −∆ϕ/2 dϕ |η(r, ϕ)|2+ π+∆ϕ/2 Z π−∆ϕ/2 dϕ |η(r, ϕ)|2 , (6)
and isotropic emission would correspond to Diso= ∆ϕ/π; in the following, we will use ∆ϕ = 2π/45 (8◦). Thus, the value of D will be compared to the isotropic emission value Diso ' 0.04. Obviously, highly directional sources have to correspond to high values of the quantities σt/σincand D.
(a) (b)
Figure 3. (a) Total cross section σt/σincas a function of the frequency. (b) Directivity D, reflecting the energy transported by the beams emerging along the x-direction (with angular aperture ∆ϕ = 8◦).
Figs. 3 report the variation of σt/σinc and D as a function of the frequency. The range of considered frequencies covers the complete band gap (f between 5 and 5.5 Hz) and the band edge frequency f0. From both figures, the following tendencies are observed, in agreement with [13]: In the full band gap, the wave remains trapped within the array, all directions being associated to evanescent waves, and very few energy can escape from the array (however, non zero values are found since the energies are calculated in the near field where the evanescent waves are not completely damped). Only the position B results in a high directivity, with D about 10 times higher than the reference isotopic emission; as expected, this is obtained for the band edge frequency f0= 5.69 Hz.
We will now confront this prediction with results obtained in a laboratory experiment, and it is useful to note that, in the context of water waves, the presented modelization has an high level of idealization.
3. Experimental results
3.1. Experimental measurement of the wave field
The experimental set-up is shown in Fig. 1. The lattice is composed of brass cylinders placed in a rect-angular tank, filled with water with depth at rest h0=33 mm. The dimension of tank is 174×68 cm2. The point source is realized using a linear motor equipped with a thin tip, moving vertically with a sinusoidal motion at frequency f (at position A or B, Fig. 1). The wavefield is measured using an optical method (Fourier Transform Profilometry) adapted by our group to achieve space-time resolved measurements of the free surface elevation [21,22,23]. This technique requires diffusive reflection of light on the liquid surface, which is achieved by adding white pigments. As a compromise between diffusive properties of the liquid and low reflection of the waves at the wall tank, we use pigments which produce attenuation α=2.5 to 3.5 m−1 in the frequency range 5.5-6.2 Hz [23]. The measurement domain is 250 × 350 mm2 with a pixel size of 0.37 mm (Figure 4(a)). The temporal resolution is controlled by the frame rate of the high speed camera which is fixed at 100 Hz for our experiments. A typical instantaneous field of the free
surface elevation η(r, t) measured by FTP is show in Figure 4(b). In this example, the point source is located at the position A; as expected, the wave has very low amplitude (about 0.1 mm while the source generates waves of amplitude about 1 mm), and it is not concentrated onto a thin beam. Also, the field is not smooth; this is partially due to noise in the measurements, but also attributable to the non linear generation of harmonics, even at these low wave amplitudes.
(a) (b) (c)
Figure 4. (a) Picture corresponding to the measurement domain, as recorded by the camera, (b) Typical instantaneous measured field using FTP (the colorbar is in mm, for the values of η(r, t)), (c) Real part of the complex field corresponding to the linear field η1(r), Eqs. (7)-(8)
In order to evaluate quantitatively the amplitude and phase of the field corresponding to the fundamen-tal frequency (hereafter referred as the linear field), and to the harmonics generated by the non linearities, the signal η(r, t) is expanded as a Fourier series:
η(r, t) =X n
ηn(r)e2inπf t, (7)
where f is the frequency of the point source, and where the ηn are complex amplitudes. Notably, the linear field η1(r) can be computed from the measured fields
η1(r) = 2 tf tf Z 0 dt η(r, t)e2iπf t, (8)
with tf a time which is chosen as a multiple of the wave period. Fig. 4(c) shows the real part part of the
linear field η1(r)e2iπf t corresponding to the total field of Fig. 4(b). To measure the whole field emerging from the array and to characterize the directivity function at r = 120 mm, we perform two measurements as presented above, separately for x > 0 and x < 0 (by moving the camera). We checked that for the source in position A, the fields are symmetric with respect to the y-axis and only the one obtained for x < 0 will be reported. For the source in position B, the whole field will be presented.
3.2. Results for the point source at A
We have seen in the Section 2 that this position does not lead to an efficient directional emission, in agreement with the numerical results presented in [13] for a similar configuration. Typical results are
shown in figure 5(a) at the band edge frequency f = f0= 5.69 Hz and (d) at f = 6.13 Hz, in the pass band. In these figures, we reported |η1(r)|2, from which the directivity functions defined in Eq. (4) can be deduced, see red curves in Fig. 6. As expected, the source is not directive, with multiple lobs. To further compare with the numerics, we report in Figs. 5(c) and (f) the fields of |η(r)|2 obtained with MST as done in Sec. 2 for a lossless fluid. The disagreement is evident when the losses are not taken into account.
f = 5.69 Hz
(a) (b) (c)
f = 6.13 Hz
(d) (e) (f)
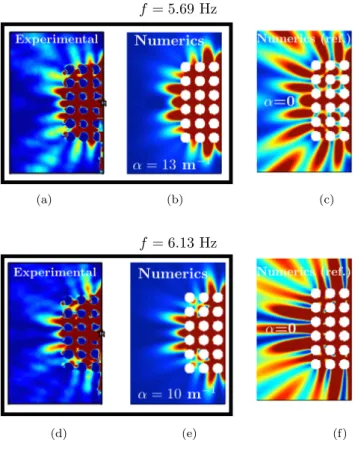
Figure 5. Point source at A. Fields of |η(r)|2 measured with FTP and calculated using MST. (a-b-c) at the band edge frequency f = 5.69 Hz and (d-e-f) at f = 6.13 Hz. (a) and (d) show the measured |η1(r)|2, Eq. (8), (b) and (e) show the fields |η(r)|2 computed with MST including attenuation to get the best agreement with the experiments; in (c) with α=13 m−1 and in (d) α=10 m−1, (c) and (f) show the reference fields |η(r)|2 calculated numerically without attenuation (α = 0).
To account for the attenuation, we computed the theoretical solution using MST, but adding the attenuation α which has been characterized accurately for our experiments in a previous study (α ∈ [2.6; 3.5] m−1, see [23]). The obtained patterns, not reported, do not coincide with the present experimental results. Thus, we computed MST solutions using α as an adjustable parameter. The optimized α -values are obtained which nicely reproduce our experimental results, both for the wave intensity patterns (Figs. 5(b) and (d)) and for the directivity functions (blue curves in Figs. 6 to be compared with the experimental red ones). The optimized α-values (13 m−1 and 10 m−1 respectively) are significantly higher than the ones measured in the absence of the cylinders. We do not have firm explanation for this apparent, or effective, attenuation due to the array, but we think that it can be attributable to the dynamics of the contact line at the meniscus, which has been shown to introduce significant damping of water waves, see e.g. [17,18]. Beyond the interest to understand such damping mechanism and the possible collective
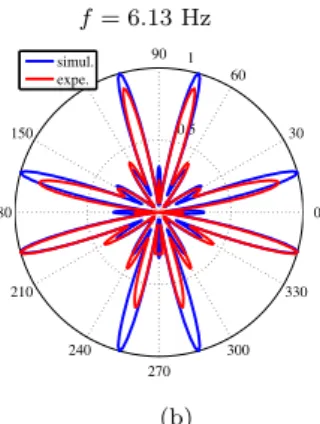
f = 5.69 Hz, f = 6.13 Hz 0.5 1 30 210 60 240 90 270 120 300 150 330 180 0 simul. expe. 0.5 1 30 210 60 240 90 270 120 300 150 330 180 0 simul. expe. (a) (b)
Figure 6. Point source at position A. Total directivity functions ftot(ϕ), Eq. (4), measured at r = 120 mm. Red curves, experimental, deduced from the measurement of |η(r)|2. Blue curves, numerical results using MST and with attenuation (a) α=13 m−1and (b) α=10 m−1.
effect of the meniscus in periodic arrays, this observation poses the question of wether or not the source directivity is robust or not. This will be inspected further for a source located at position B, where high directivity is expected.
3.3. Results for the point source at B
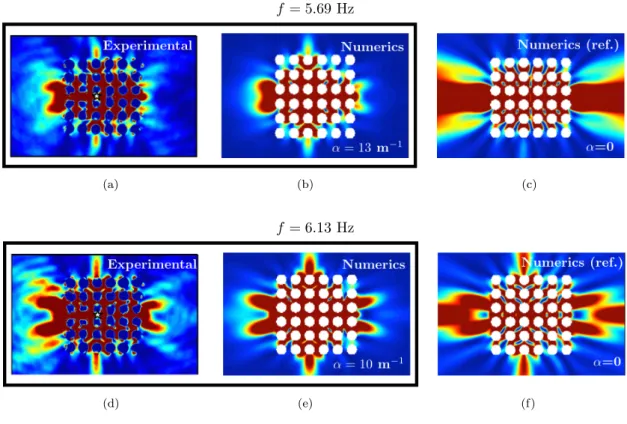
For a point source located at B, we perform the same measurements and data processing as previously. Results are reported in Figs. 7 and 8. The numerical MST calculations have been performed with the optimized α-values determined from the results obtained for a source located at A. With these α-values, the agreement is again excellent between experimental and numerical results, both in the qualitative aspect of the wave intensity fields (Figs. 7) and in the quantitative directivity functions (Figs. 8) . However, as observed for the source at A, the attenuation produces a significant modification in the angular response of the array. In the present case, the directivity of the source is weakened. This is visible in the directivity functions, with the appearance of additional lobes and the split of the central lobes along the x-direction but more dramatic because the waves emerging from the array in these directions is damped after few wavelengths.
These second experiments confirm the sensitivity of the directional emission to the damping. However, as the numerics is able to describe the experimental results, we can conclude that the mechanism is sensitive to damping for any context of waves being described by the Helmholtz equation. In the following section, we inspect numerically this sensitivity as a function of the damping and as a function of the disorder in the periodic arrangement, which are common deviations with respect to the ideal situation of a perfectly periodic array in a lossless medium.
4. Influence of attenuation and disorder on the directivity
Guided by the experimental results from previous section and owing to the agreement between ex-perimental and numerical results with high attenuation factor, we inspect numerically the effects of two possible sources of deviation with respect to the ideal case: the attenuation of the medium (whatever being the source of this attenuation) and the disorder in the positions of the cylinders. The MST
calcula-f = 5.69 Hz
(a) (b) (c)
f = 6.13 Hz
(d) (e) (f)
Figure 7. Point source at position B. Same representation as in Figure 5. f = 5.69 Hz, f = 6.13 Hz 0.5 1 30 210 60 240 90 270 120 300 150 330 180 0 simul. expe. 0.5 1 30 210 60 240 90 270 120 300 150 330 180 0 simul. expe. (a) (b)
Figure 8. Point source at position B. Same representation as in Figure 6.
tions are performed for the 6x6 lattice at the band edge frequency and for a source at B, where the ideal calculation (perfect periodic lattice and lossless medium) predicts highly directional source.
4.1. Influence of attenuation
We considered 4 values of attenuation α = 1, 3, 5 and 10 m−1. In the considered range of frequency, this corresponds to waves being typically attenuated after 20, 7, 4 and 2 wavelengths (wavelength are
typically in the range 3 cm to 6 cm). Results are compared to the ideal case α = 0 realizing high values of σt/σinc and of D. Figure 9 reports the evolutions of the normalized total cross sections σt/σinc and of the parameter of directivity D as a function of the frequency for various α-values.
(a) (b)
Figure 9. (a) Normalized total cross section σt/σinc and (b) factor of directivity D as a function of the frequency f for various attenuation factors α (in m−1).
The significant decrease in the normalized total cross sections observed in Fig. 9(a) is not a direct consequence of the attenuation. Indeed, both the incident wave and the scattered waves are damped when propagating. We have checked that σinc ∝ e−2αr when varying α, as expected. However, σ
t decreases faster, resulting in the observed decreased of the normalized value, near the band edge frequency f0= 5.69 Hz. At f0, σt/σincdecreases by a factor 2 for α going from 0 to 1 m−1(for α = 1 m−1, the wave is damped typically after 20 wavelengths, being about 5 cm) while it remains almost constant at f = 6.13 Hz. This is not so surprising if we keep in mind that the band edge corresponds to a Bragg resonance, that is constructive interferences. In principle, all the waves interfere with the same amplitude, and the efficiency of the interferences increases with the large “time” spent by the wave within the array. Here, the damping produces a progressive loss of energy of the successive waves which interfere, resulting in a weakness of the resonance efficiency.
The decrease in the directivity of the source is less pronounced, with a rather linear decrease of D with α. We conclude that the main effect of the attenuation is to destroy the resonance mechanism on which the concept of directional source is based. The wave still emerges preferentially along the expected direction, but with an amplitude which has been considerably decreased. Only low attenuations, as can be obtained with electromagnetic, acoustic or elastic waves, leave the resonance intact.
4.2. Influence of disorder on the position
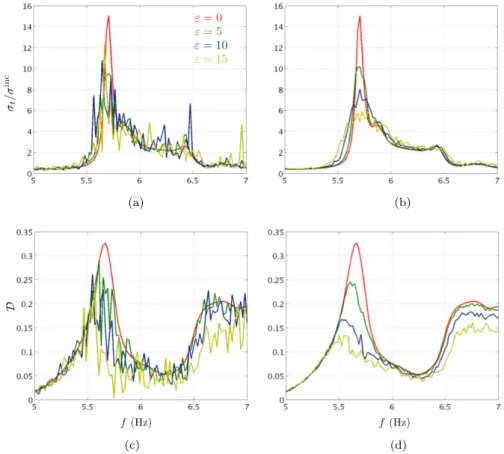
In addition to the losses of the medium, disorder in the position or the strength of the scatterers in the array can affect the expected directivity. This is inspected by means of a disorder in the positions of the cylinders within the array. In the MST calculations, we shift the position of each cylinder within a disc of radius εd. The final position of each cylinder is chosen randomly, resulting in a perturbed periodic arrangement of the lattice. Finally, to avoid overlapping of the cylinders, ε has to be smaller than 1/2 − a/d ∼ 16 %, and we choose ε = 0, 5, 10, 15 %.
Figures 10 collect the results. We reported, for one realization of the disordered structure, the nor-malized total cross section σt/σinc and the directivity parameter D as a function of the frequency for various ε values. Same dependences are reported for the quantities averaged over 40 realizations. This
(a) (b)
(c) (d)
Figure 10. Influence of the disorder on the directional emission. (a-b) Total directivity function σt/σinc and (c-d) directivity parameter D. (a) and (c) correspond to a typical response of the structure for one realization of the disordered structure (with amplitude of disorder measured by ε); (b) and (d) correspond to the response of the periodic-on-average structure (here 40 averages have been performed).
statistical average is believed to correspond to the most probable behavior, from which the behavior of each individual realization has be close. This becomes questionable when strong disorder is considered leading to more complicated situations, as the Anderson localization. A typical manifestation of such complication is the difficulty to make the simple average to converge, because of strong (rare) events that deviate significantly from the mean behavior, and this seems to appear for ε = 15 %. For smaller disorder, say around 5%, the directivity is maintained on the mean, and one particular realization is reasonably close to this mean. In these cases, we observe an important decrease of the energy emerging from the array at the resonance. Again, this is due to a weakening of the constructive interferences which require a strict periodicity. Because of the disorder, some of the waves, which should interfere, are lost (they emerge from the array with any direction), resulting in an effective attenuation due to disorder. Contrary to the case of an attenuation due to the propagation medium, this effective attenuation does not affect non resonant propagation; there, the wave experiences mainly single scattering, not sensitive to the exact position of the scatterers.
5. Concluding remarks
In this paper, we have investigated the possibility of exploiting the band structure of a periodic square array to produce the directional sources for water waves, as suggested in [13]. This has been done in an experiment performed at the laboratory scale, revealing the strong influence of the attenuation which partly impedes the expected directivity. Nevertheless, we did not observe deviations to the Helmholtz equation due to the many hypothesis on the fluid and on the sea bottom variation that the derivation of Helmholtz equation require. Next, we have confirmed numerically that the attenuation being either characteristic of the losses in the propagation medium or being due to an effective attenuation because of disorder, weakens the expected directivity. This is because resonances involve long travels of the wave within the periodic structures, able to produce the resonant constructive interferences, but inherently more sensitive to any loss of energy within the array.
Our conclusion is twofolds. (i) In the context of water waves, applications to the larger scale of the ocean waves remain feasible. Indeed, at the scale of wave of meter wavelength, losses are smaller. Nevertheless, care should be taken in the context of the ocean that the non linearities do not affect the resonance. Work is in progress in this direction. (ii) Our conclusion concerning the sensitivity of resonant mechanisms is generic to any context of waves. Bragg type resonances require that the successive waves, which are expected to interfere constructively, are identical (in amplitude and phase). Any deviation with respect to this perfect situation has important consequences on the resonance. This is probably a superiority of the metamaterials with subwavelength structure since they are inherently less sensitive to local modifications of the microstructure.
References
[1] Photonic Band Gap Materials, edited by C. M. Soukoulis, Kluwer Academic, Dordrecht, 1996;
[2] J. D. Joannopoulos, S.G. Johnson, J.N. Winn, R.D. Meade, (2011). Photonic crystals: molding the flow of light. Princeton university press.
[3] P.A. Deymier, (2013). Acoustic metamaterials and phononic crystals (Vol. 173). Springer.
[4] I. Bulu, H. Cayagan, E. Ozbay, Highly directive radiation from sources embedded inside photonic crystals, Appl. Phys. Lett., 83(16) (2003) 3263-3265.
[5] H. Caglayan, I. Bulu, E. Ozbay, Off-axis directionnal beaming via photonic crystal surface modes, Appl. Phys. Lett., 92(9) (2008) 092114.
[6] C. Qiu and Z. Liu, Acoustic directional radiation and enhancement caused by band edge states of two dimensional phononic crystals, Appl. Phys. Lett., 89 (2006) 063106,
[7] M. Ke, Z. Liu, P. Pang, C. Qiu, D. Zhao, S. Peng, J. Shi, W. Wen, Experimental demonstration of directional acoustic radiation based on two dimensional photonic crystal band edge states, Appl. Phys. Lett., 90 (2007) 083509.
[8] W. Liu, X. Su, Collimation and enhancement of elastic transverse waves in two-dimensional solid phononic crystals, Phys. Lett. A 374 (2010) 2968.
[9] B. Morvan, A. Tinel, J.O. Vasseur, R. Sainidou, P. Rembert, A.C. Hladky-Hennion, N. Swinteck, P.A. Deymier, Ultra-directional source of longitudinal acoustic waves based on a two-dimensional solid/solid phononic crystal, JAP 116(21) (2014) 214901.
[10] M. Torres, J.P. Adrados, F.M. de Espinosa, D. Garcia-Pablos, J. Fayos, Parametric Bragg resonances in waves on a shallow fluid over a periodically drilled bottom, PRE, 63(1) (2000) 011204.
[11] Y. Shen, K. Chen, Y. Chen, X. Liu, J. Zi, Self-collimation in liquid surface waves propagating over a bottom with periodically drilled holes. PRE 71(3) (2005) 036301.
[12] R. P. Feynman, R. B. Leighton, M. Sands, The Feynman Lectures on Physics (Addison-Wesley, Reading, MA, 1963), Vol. I, Chaps. 51??54.
[13] J. Mei, C. Qiu, J. Shi, Z. Liu, Enhanced and directional water wave emission by embedded sources, Wave Motion, 47(3) (2010) 131-138.
[14] P. Cobelli, A. Przadka, P. Petitjeans, G. Lagubeau, V. Pagneux, A. Maurel, Different regimes for water wave turbulence. PRL 107(21) (2011) 214503.
[15] A. Przadka, S. Feat, P. Petitjeans, V. Pagneux, A. Maurel, M. Fink, Time Reversal of Water Waves, PRL 109(6) (2012) 064501.
[16] C.P. Berraquero, A. Maurel, P. Petitjeans, V Pagneux, Experimental realization of a water-wave metamaterial shifter. PRE, 88(5) (2013) 051002.
[17] D.M. Henderson, J.W. Miles, Surface-wave damping in a circular cylinder with a fixed contact line, J. Fluid Mech. 275 (1994) 285-299.
[18] L. Jiang, M. Perlin, W. W. Schultz, Contact-line dynamics and damping for oscillating free surface flows, Phys. Fluids, 16(3) (2004) 748-758.
[19] P. Cobelli, V. Pagneux, A. Maurel, P. Petitjeans, Experimental study on water-wave trapped modes, (2011) J. Fluid Mech. 666, 445-476.
[20] C. M. Linton, P. A. Martin, Multiple scattering by random configurations of circular cylinders: Second-order corrections for the effective wavenumber, J. Acoust. Soc. Am., 117(6) (2005) 3413-3423.
[21] P. J. Cobelli, A. Maurel, V. Pagneux, P. Petitjeans, Global measurement of water waves by Fourier Transform Profilometry, Exp. Fluids, 46 (2009) 1037-1047.
[22] A. Maurel, P. J. Cobelli, V. Pagneux, P. Petitjeans, Experimental and theoretical inspection of the phase-to-height relation in Fourier transform profilometry, Appl. Optics, 48(2) (2009) 380-392.
[23] A. Przadka, B. Cabane, V. Pagneux, A. Maurel, P. Petitjeans, Fourier transform profilometry for water waves: how to achieve clean water attenuation with diffusive reflection at the water surface?, Exp. in Fluids, 52(2) (2012) 519-527.