HAL Id: hal-01961987
https://hal.sorbonne-universite.fr/hal-01961987
Submitted on 20 Dec 2018HAL is a multi-disciplinary open access archive for the deposit and dissemination of sci-entific research documents, whether they are pub-lished or not. The documents may come from teaching and research institutions in France or abroad, or from public or private research centers.
L’archive ouverte pluridisciplinaire HAL, est destinée au dépôt et à la diffusion de documents scientifiques de niveau recherche, publiés ou non, émanant des établissements d’enseignement et de recherche français ou étrangers, des laboratoires publics ou privés.
An attempt to characterize the human Chorionic
Gonadotropin protein by reversed phase liquid
chromatography coupled with high-resolution mass
spectrometry at the intact level
Julien Camperi, Audrey Combes, Jean Guibourdenche, Davy Guillarme,
Valérie Pichon, Thierry Fournier, Nathalie Delaunay
To cite this version:
Julien Camperi, Audrey Combes, Jean Guibourdenche, Davy Guillarme, Valérie Pichon, et al.. An at-tempt to characterize the human Chorionic Gonadotropin protein by reversed phase liquid chromatog-raphy coupled with high-resolution mass spectrometry at the intact level. Journal of Pharmaceutical and Biomedical Analysis, Elsevier, 2018, 161, pp.35-44. �hal-01961987�
1
An attempt to characterize the human Chorionic Gonadotropin
protein by reversed phase liquid chromatography coupled with
high-resolution mass spectrometry at the intact level
Julien Camperia, Audrey Combesa, Jean Guibourdencheb,c, Davy Guillarmed, Valerie Pichona,e,
Thierry Fournierb, Nathalie Delaunaya
a
Department of Analytical, Bioanalytical Sciences and Miniaturization, UMR CBI 8231 CNRS -ESPCI Paris, PSL University, Paris, France
b
Laboratory of Physiopathology and PharmacoToxicology of the Human Placenta, UMR-S 1139 Inserm - University Paris Descartes, Sorbonne Paris Cité, Paris, France
c
Laboratory of hormonology, CHU Cochin AP-HP, Paris, France
d
School of Pharmaceutical Sciences, University of Geneva, University of Lausanne, Geneva, Switzerland
e
Sorbonne Université, Paris, France
Corresponding author: Nathalie Delaunay, nathalie.delaunay@espci.fr; +331 40794651.
Corresponding author institution: LSABM, UMR CBI 8231 CNRS – ESPCI Paris, 10 rue Vauquelin, 75005 Paris, France.
Keywords: Glycosylation; human Chorionic Gonadotropin; Intact protein; Liquid chromatography; QTOF high-resolution mass spectrometry
2
Abbreviations: ACN, acetonitrile; FA, formic acid; GlcNAc, N-acetylglucosamine acid; hCG, human Chorionic Gonadotropin; hCGα, alpha subunit of the human Chorionic Gonadotropin; hCGβ, beta subunit of the human Chorionic Gonadotropin; Neu5Ac, N-acetylneuraminic acid; mAb, monoclonal antibody; Man, mannose; MW, molecular weight; PTMs, post-translational modifications; RF, radio frequency; r-hCG, recombinant human Chorionic Gonadotropin; TFA, trifluoroacetic acid; TIC, total ion chromatogram; u-hCG, human Chorionic Gonadotropin
3
Abstract
For the first time, the human Chorionic Gonadotropin (hCG) hormone at the intact level was characterized by reversed phase liquid chromatography (RPLC) coupled with high resolution mass spectrometry (HRMS). This heterodimeric protein is specific to human pregnancy, consists in an α and a β subunit, so-called hCGα and hCGβ, respectively, and has 8 glycosylation sites leading to a high number of isoforms. First, the LC method was optimized to separate the largest number of isoforms and also to facilitate the MS ionization process and data treatment. The initial mobile phase composition, slope of the gradient, and column temperature were appropriately selected to maximize the number of separated isoforms. Moreover, the MS detection parameters were adjusted to i) promote the efficient transfer of the heaviest ions, ii) avoid or limit the fragmentation of the ions and iii) improve the sensitivity. The repeatability of the final method in terms of retention times and peak areas was assessed. The method was next used to characterize two hCG-based drugs: Ovitrelle® (a recombinant hCG, r-hCG) and Pregnyl® (hCG isolated from urine of pregnant women, u-hCG). After the deconvolution step, the analytical method did not allow to observe the isoforms of the hCGβ. This may be due to its dramatic higher heterogeneity induced by its 6 glycosylation sites and a lack of ionization in the MS source. Nevertheless, the results revealed the presence of more than 30 hCGα isoforms, which differ by their number and their nature in the two drugs. Then, the molecular weights of the N-glycans already described in the literature for hCG were compiled in a database to identify the hCGα glycoforms by mass matching. This strategy was successfully applied for the identification of five glycoforms for both r-hCG and u-hCG. This work demonstrates for the first time the potential of RPLC-HRMS for the identification of the intact hCGα glycoforms.
4
1. Introduction
The human chorionic gonadotropin (hCG) is a hormone specific to the human pregnancy and is essential for the preservation of the pregnancy and the development of the placenta [1]. This protein is composed of two glycosylated subunits, namely hCGα and hCGβ, which are non-covalently associated and internally stabilized by a cystine knot and 11 disulfide bonds. The α-subunit is common to other gonadotropin hormones, such as the follicle stimulating hormone, the thyroid stimulating hormone, and the luteinizing hormone, while the β-subunit is specific of hCG [2]. The hCGα is composed of 92 amino acids with two N-glycosylation sites and has a molecular weight (MW) of 10,198 Da, regardless of glycans. The hCGβ is composed of 145 amino acids with two N- and four O-glycosylation sites and has a MW of 15,521 Da, regardless of glycans [2]. With 8 potential sites of glycosylation, hCG is a highly glycosylated protein and about 30% of its MW is due to the glycosylation [3].
The glycosylation is one of the most common post-translational modifications (PTMs) of proteins, since about 70% of the human proteins are glycosylated [4]. It plays an important role in numerous biological functions including stability, localization, cell-cell communication, half-life, binding, and activity [2]. Concerning hCG, it was demonstrated, by immunocytochemistry, that different placental sources produce different hCG isoforms [5] and, by preparative chromatofocusing followed by radioimmunoassay, that the relative proportion of different acidic isoforms (certainly due to different glycans), the biological activity, and the half-life of hCG vary during the pregnancy [6]. For this reason, one can expect that some glycosylated forms of hCG could be maternal biomarkers to identify so-called "at-risk" pregnancies. This is why it is so relevant to characterize the hCG glycoforms.
The characterization of the glycoforms of a given protein constitutes an important analytical challenge, especially for hCG having potentially a high heterogeneity of glycoforms. The
5
characterization of the protein glycoforms can be performed at different levels: the glycopeptides [7, 8], the released glycans [9], and more rarely the intact protein [10, 11]. Each approach brings complementary information. At the glycopeptide level, the so-called bottom-up approach allows the localization of the glycans along the protein chain and the determination of the MW and composition of the glycans. This approach is still the most widely used for the characterization of proteins. However, its suffers from some disadvantages related to the numerous sample preparation steps that are usually necessary, such as alkylation, reduction and enzymatic digestion. They can be expensive, time consuming, and above all lead to the loss of certain monosaccharides or some minor isoforms. At the released glycans level, different separation methods have been successfully used in the past [12, 13], but all of them are time-consuming (release, purification, derivatization, analysis) and require expensive reagents. Furthermore, the obtained glycan profile does not give sufficient information on the micro-heterogeneity in presence of various glycosylation sites, and one glycan cannot be attributed to a given isoform. For all these reasons, the characterization of glycosylation at the intact protein level is increasingly used today [10, 11]. In the particular case of hCG, which is composed of two glycosylated subunits that both contribute to its bioactivity, it may also allow to determine which isoform of hCGα is associated with which isoform of hCGβ, to identify potential hCG biomarkers. This analytical approach, for which no digestion is required prior to the analytical step, also has the advantages to be faster and cheaper. However, care should be taken to ensure that the isoforms of low abundance are well detected [14]. This is why the main challenge in that case is to achieve a high resolution separation, under conditions that favor the ionization of the different isoforms, and therefore their MS detection.
6
Until now, the hCG characterization was mainly carried out either by peptide mapping after an enzymatic digestion [15, 16] or by the analysis of the released glycans after a digestion with either a PNGase to release the N-glycans or with an enzymatic mixture to characterize some O-glycans for different hCG-based drugs [13, 17]. The bottom-up approach allowed the sequencing of several N-glycosylated peptides with the composition of the associated glycans for each N-glycosylation site. Furthermore, one review paper demonstrated the interest of using pronase to isolate one O-glycosylation site by peptide to determine the O-glycans composition of the β-subunit [13]. However, the identification of intact isoforms has not yet been carried out. Indeed, at the intact level, hCG was analyzed only by SDS-PAGE [18], which allow the evaluation of the MWs of the dimeric hCG and its subunits, with a limited resolution. One study involved the use of capillary zone electrophoresis (CZE) [19]. The CZE method led to 8, 4, and 7 peaks for the analysis of hCG, hCGα, and hCGβ, respectively, at the intact level, but the spectrophotometric UV detection does not allow more precise isoforms characterization. In high-performance liquid chromatography (LC), one publication deals with the analysis of hCG at the intact level [20], to compare two hCG-based drugs: Ovitrelle® (hCG recombinant, r-hCG) and Pregnyl® (hCG isolated from urines of pregnant women, u-hCG). Two main peaks were observed and were assumed to correspond to the two subunits, hCGα and hCGβ, but without any possible confirmation as only a spectrophotometric UV detection was used. To significantly improve the level of information obtained, the hyphenation with mass spectrometry (MS) is necessary. This was performed by Toll et al. who confirmed that the LC analysis of hCG on a styrene based monolithic stationary phase with a TFA-based mobile phase led to one wide peak of hCGβ and one or two wide peaks of hCGα [21]. A tentative of identification of the glycans present on a dozen isoforms of each subunit was reported in this study. Nevertheless, the lack of resolution of the used mass spectrometer (ion trap
7
quadrupole) can led to mass errors and misidentifications.
Regarding high resolution MS, to date, only MALDI-TOF analysis, with no separation technique, was carried out and only on the intact hCGβ [22]. This study revealed the existence of the hCGββ homodimer in an r-hCGβ standard and in urines of pregnant women.
Most of the recent literature related to the separation of isoforms of intact protein deals with the characterization of therapeutic monoclonal antibodies (mAbs) [23], which mainly involved reversed phase (RP) conditions with stationary phases based on pore core-shell or wide-pore sub 2-µm particles. These studies show a very high separation efficiency and good resolution of the intact mAb isoforms (± 150 kDa) [24], but also of their subunits with MWs between 25 and 100 kDa obtained after digestion with specific enzymes (IdeS, papain, pepsin,…) [10]. As the mAb fragments have MWs close to that of the intact hCG, these conditions could also probably be successfully applied for the analysis of intact hCG. This study presents, for the first time, the development of a RPLC separation method coupled to high-resolution MS (HRMS) for the analysis of the intact hCG. Different parameters of the separation and MS detection were optimized. Finally, the RPLC-HRMS method was used to identify the main glycoforms for two hCG-based drugs.
2. Materials and methods
2.1. Reagents and analytes
HPLC-grade acetonitrile (ACN), methanol (MeOH), trifluoroacetic acid (TFA), and formic acid (FA) were supplied by Carlo Erba (Val de Reuil, France). Cesium iodide (CsI) was purchased from Sigma-Aldrich (Saint Quentin Fallavier, France). Ultra-pure water was obtained with a Milli-Q Purification system from Millipore (Molsheim, France). Two hCG-based drugs were
8
used as hCG standards: Ovitrelle® and Pregnyl®. Ovitrelle® (Organon, Oss, The Netherlands)
was presented as a solution containing 500 mg L-1 of hCG (recombinant mammalian cell,
r-hCG), and Pregnyl® (Serono Europe Ltd, London, UK) as a lyophilized powder containing 5,000 IU hCG (hCG from the urines of pregnant women, u-hCG). A lyophilized powder containing 500 µg of r-hCGβ (recombinant Pichia pastoris, r-hCGβ) was purchased from Sigma-Aldrich (Saint-Quentin-Fallavier, France).
The Ovitrelle® solution was diluted in water to obtain a stock solution containing 100 mg L-1 of
r-hCG. For Pregnyl® and r-hCGβ, the lyophilized content of each ampoule was reconstituted in
water at a concentration of 100 mg L-1, taking as hypothesis that 1 UI is equivalent to a
concentration of 0.092 µg L-1 [25]. All the preparations were aliquoted and stored at - 20°C.
Before injection in LC-MS, the hCG fractions were cleaned by centrifugation with ultra-centrifugal units (Merck, Darmstadt, Germany) having a molecular weight cut-off of 10 kDa, to remove additives from drug formulations.
2.2. Apparatus and analytical conditions
The LC-MS method was performed using an Agilent 1100 LC system (Agilent Technologies, Les Ulis, France) coupled to a MicrOTOF-Q II Mass Spectrometer (Bruker Daltonics, Wissembourg, France) with an electrospray ionization (ESI) source and an orthogonal accelerator, reflector and detector. The separation was carried out with an Aeris WIDEPORE XB-C18 200 Å column (150 x 2.1 mm) packed with 3.6 µm core-shell silica-based particles (Phenomenex, Le Pecq, France) placed in a column oven (Crococil, Interchim, Clichy, France). The mobile phase was
first composed of (A) 0.1% TFA in water (v/v) and (B) 0.1% TFA in ACN/H2O (9/1; v/v). Then,
0.1% TFA was replaced by 0.1% FA in A and B. The optimized elution gradient was an increase from 4.5 to 31.5% ACN in 50 min, a plateau for 5 min, and a return to the initial composition
9
within 1 min followed by an equilibrium step for 10 min. The flow-rate was set at 0.4 mL min
-1 and injection volume was 5 µL.
The ESI-TOF-MS analysis was carried out in the positive ionization mode, and the mass-detection range was set at m/z 400–5,000. The ESI source parameters were as follows: drying gas (N2) flow rate, 9.0 L min−1; drying gas temperature, 200 °C; nebulizing gas pressure, 30 psi;
capillary voltage, 4,500 V. All data acquisitions were controlled by the TOF Control software (Version 3.4, Bruker Daltonics) and the Hystar software (Version 3.2, Bruker Daltonics) was used to interface HPLC and MS systems. To ensure optimal conditions for the detection, the
calibration of the detector was performed using cesium clusters (2 g L-1 Csl in water:
isopropanol (1:1, v/v)). The calibration solution was injected between each LC analysis and the MS spectrometer was calibrated prior to characterization. The MS tune parameters were optimized, as described in section 3.1. For the deconvolution method, the mass range was set at 10,000 – 25,000 Da, with a relative abundance cutoff of 5% and a maximal number of 20 compounds.
3. Results and discussions
3.1. Optimization of the RPLC-HRMS analysis of the intact r-hCG
Because of their tendency to adsorb in the LC system and their low diffusion coefficients, intact proteins require analytical conditions that are different from those applied for small molecules. To have suitable peak shapes and limit adsorption of hCG, 0.1% trifluoroacetic acid (TFA) was added to the mobile phase and a relatively elevated temperature was used as recommended for monoclonal antibodies [26, 27]. In terms of stationary phases adapted to the analysis of intact proteins, the last generation of particles is currently used, such as wide
10
pore sub 2-µm fully porous or core shell particles. Indeed, these particles allow to work under extreme conditions of pH, pressure and temperature, and are available with sufficiently large
pore size (200Å) to avoid exclusion of the proteins from the pores of the stationary phase.
Based on these considerations, a first RPLC-UV method was developed using C18-bonded
core-shell particles (Aeris WIDEPORE XB-C18, 200Å) and a mobile phase containing a
water/ACN mixture acidified with 0.1% TFA, which corresponds to the mobile phase used in the only papers dealing with the LC analysis of the hCG at the intact level [21, 20]. As previously observed by these authors, two peaks were observed and were attributed to the two subunits, hCGα and hCGβ (see Figure S1 in the supplementary data). Unfortunately, TFA induced a strong ion suppression in ESI-MS, resulting in a dramatic decrease in the signal of the first peak and the complete suppression of the second peak. Therefore, TFA was replaced by FA to acidify the mobile phase in the rest of the study. It is also worth noticing that the injected hCG solution
is based on water. Indeed, 3 media were tested: 50 mM NH4HCO3 at pH 7.5, 50 mM HEPES at
pH 7.5, and water. The stability of the hCG solution was assessed by gel electrophoresis (SDS-PAGE) and followed for 24 h. It was observed that hCG was stable only in water (data not shown).
Then, the mobile phase gradient, the temperature of the separation, and the MS parameters were studied to try to ensure an optimal resolution of the separation and a sufficient sensitivity for the detection of the hCG isoforms. It is worthwhile to notice that this was done with r-hCG, as it was expected to be the purest “standard” of our two hCG-based drugs. The mobile phase gradient was first optimized with an analysis temperature set at 35°C. The initial ACN content was set at 4.5% and different gradient slopes were tested, from 6.8 down
to 0.5% per min. Figure1 presents the total ion chromatograms (TIC) obtained with the
11
observed. In contrast, at least 6 peaks can be observed with the lowest slope. Each peak can correspond to at least one glycoform, but it can also correspond to other kinds of post-translational modifications (PTMs) such as deamidation, oxidation… A gradient with lower slope did not lead to a better resolution, but to a longer analysis time. Therefore, a slope of 0.5% of ACN per min was finally selected.
The effect of mobile phase temperature was further studied. As already mentioned, an increase in temperature should reduce the protein adsorption onto the stationary phase and improve diffusion of proteins. Temperatures from 35 to 65°C were applied with increments of 5°C. The maximum temperature was set at 65°C, since our HPLC system was not compatible with higher values. With a temperature of 35°C (Figure 1B), only six peaks were resolved instead of nine at 65°C (Figure 1C). The highest temperature was therefore selected.
Finally, the MS parameters were studied. Values recommended by the MS manufacturer for the analysis of macromolecules (see Table S1 in the supplementary data) were taken as our starting conditions. The parameters related to the ions transfer from the ESI source to the analyzer were first adjusted to increase the intensity of the r-hCG peaks. It appeared that the key factors were the collision radio frequency (RF) and the transfer time in the collision cell. A
compromise was found to attain the highest possible signal for ions with high m/z values (>
1000). Indeed, the transfer of the heaviest ions necessitates a high voltage for the collision RF and a relatively high transfer time. However, these settings led to the loss of the intermediate
and low m/z values (400-1000 and < 400). The comparison of the TICs obtained with the initial
and the improved values is provided in Figure 2. As expected, better sensitivity was obtained, and at least 12 peaks were detected for r-hCG, especially in the second zone of elution (at the highest retention times) that were not previously observed. The optimized method included
12
10% of the acquisition time (100 µs) and (ii) 1600Vpp/120 µs during 90% of the acquisition
time (900 µs) (i.e. an acquisition time of 1s for each MS spectrum). The collision energy and
the pre-pulse storage were maintained at 10eV and 15µs, respectively.
3.2. Comparison between r-hCG, r-hCGβ, and u-hCG
Once the separation and detection conditions were optimized, a standard of r-hCGβ, which corresponds to the β-subunit of hCG, was injected to compare the resulting TIC chromatogram with the one obtained with the intact r-hCG that contains both the α- and β- subunits (Figures 3A and 3B). First of all, the RPLC-HRMS analysis of both r-hCGβ and r-hCG provide complex chromatograms with more than 10 peaks. This is consistent with the high number of glycosylation sites present on the hCGβ (2 N- and 4 O-glycosylation sites), but it can also correspond to other PTMs. The retention times of the r-hCGβ isoforms were comprised
between 13 and 21min, shorter than those of the r-hCG, between 29 and 36min. To evaluate
whether this retention difference is significant, the repeatability of the retention times of the main peaks obtained by the RPLC-HRMS analysis of r-hCG and r-hCGβ was studied. As shown in Table S2, the relative standard deviation (RSD) values were always inferior to 2.4%. These results confirm that the peaks obtained for r-hCGβ are significantly different from the ones obtained for r-hCG. Therefore, even if hCG is composed of 2 subunits that are non-covalently associated, it seems that the RPLC conditions used here preserve, if not the native form, a strong interaction between the two α and β-subunits of the hCG. Table S2 also shows peak areas repeatability of the main chromatographic peaks for both r-hCG and r-hCGβ. The RSD values were comprised between 2.8 and 12.5%, which is acceptable for the analysis of intact proteins by RPLC-HRMS.
13
A second hCG-based drug obtained from the urines of pregnant women, so-called u-hCG, was analyzed using the same RPLC-HRMS conditions. The resulting TIC chromatogram is presented in Figure 3C. As expected, since u-hCG is obtained from complex biological samples, the
corresponding chromatogram presents some additional peaks at 7, 8, 16, and 17min with
respect to the chromatogram obtained for r-hCG (Figure 3A). As an ultra-centrifugation step
was carried out before the analysis with 10kDa filters to eliminate all the small molecules
initially present in the drug, it can therefore be assumed that these peaks correspond to other urinary proteins or cleaved forms of u-hCG. The comparison also shows that a wide and intense massif of peaks eluted at the same range of retention times previously obtained with r-hCG; these peaks should probably correspond to the isoforms of the u-hCG. Table S2 presents the RSD values of the retention times of the main peaks of u-hCG and, again, they were very low, between 0.3 and 1.3%. As previously, the RSD values for the peak areas were around 10%. The superposition of the chromatograms of r-hCG and u-hCG (Figure 3D) shows that the number of peaks, their retention times, and their relative intensities were different, which should be due to different natures and concentrations of the hCG isoforms present in both drugs. This constitutes a promising result for future fast and simple fingerprinting of hCG samples without any MS data processing. Overall, the intensities of the u-hCG peaks were lower. There are two possible explanations for these observations. First of all, it is important to keep in mind that u-hCG is produced by extraction and purification from urines and its
bioactivity was determined to be 9,200IUmg-1. Since each ampoule of drug contains 5,000IU
of u-hCG, the calculation of the concentration in mgL-1 of the injected u-hCG was done
considering that 1IU was equal to 0.092µg [25]. This calculation hypothesis may probably be
inaccurate. Secondly, it is known that there are some cleaved forms of hCG in urine and they may also be present in the u-hCG-based drug, even if the extraction and purification process
14
is not known [1]. These cleaved forms may still be bioactive and contribute to the lower intensities of the u-hCG peaks with respect to the intensities of the r-hCG peaks, for which the
concentration in mgL-1 is given by the manufacturer.
Figure 4 presents the m/z values of the average MS spectra of the zone of elution of (A) r-hCG and (B) u-hCG samples. It is important to notice here that the three same charge states were obtained in the two drugs (z=7, z=8, and z=9). Nevertheless, for a given charge state, the intensity and the number of peaks and their m/z values are different, confirming the presence of different isoforms (in amount and nature) in the two drugs.
3.3. MS data processing
For the processing of the MS data, deconvolution methods are needed to assign different ions to the same isoform. Deconvolution algorithms use the fact that (i) different fragments from the same molecule have the same retention time and (ii) their profiles across multiple charged states are highly correlated. The main disadvantage of the deconvolution methods is that the complexity of hCG with eight glycosylation sites can give a large number of peaks with similar retention times and overlapping isotopic patterns. Consequently, some identification errors can be obtained.
On the basis of these considerations, the deconvolution method described in section 2.2 was applied to each peak of the elution zone of r-hCG and u-hCG. The absolute mass values of the different peaks were summarized in Table 1. It is worthwhile to note that (i) even if a number of 20 compounds identified per peaks were possible in the deconvolution criteria, only 1 to 11 mass values were obtained for each peak, and (ii) the deconvolution of the second peak zone of r-hCG (between 32 and 34 min) was not possible, due to an extreme complexity and limited
15
chromatographic separation. Indeed, it was not possible to interpret the charge state distribution from the MS spectrum (see Figure S2 in the supplementary data).
Then, the number of different mass values reported in Table 1 corresponds to a large number of isoforms, which confirms the extreme complexity of the hCG protein. Indeed, 33 different mass values between 11,000 and 18,000 Da were observed for both r-hCG and u-hCG. Table 1 also shows the variability of the isoforms between the two hCG-based drugs, due to different glycosylations or other PTMs. Indeed, there are no common mass values in Table 1 between r- and u-hCG. The range of the mass values were also different between r- and u-hCG: from 12,465 to 17,960 Da and from 11,814 to 17,093 Da, respectively. Moreover, up to two orders of magnitude were observed between some abundance values for the r-hCG, which may correspond to significantly different concentrations of some isoforms, even if each isoform has its own ionization rate. A similar comment can be done for the u-hCG sample.
Taking into account the MWs of the N- and O-glycans already described in the literature for hCG and its subunits [13, 28–30], and the number of potential glycosylation sites, we have tried to assign the detected mass values to the dimeric hCG and/or its two subunits. These detected mass values may correspond to isoforms of the α-subunit, since hCGα has a MW of
10,198Da without glycans and two N-glycosylation sites (the MW of the N-glycans was
comprised between about 900 (three mannoses (Man) and two N-acetylglucosamine acids
(GlcNAc)) and 4,500 Da (N-glycans with 5 antennas)).For the hCGβ, the determination of the
MW range was more complex, due to the MW heterogeneity of the O-glycans. Since the MW of hCGβ without glycans is 15,521 kDa, it is only possible to estimate a very large mass range for the hCGβ between ≈ 18,000 and up to > 25,000 Da in some cases.
However, no isoforms with mass values superior to 18,000 Da was observed in the two hCG-based drugs. Therefore, it is possible to conclude that (i) the isoforms of hCGβ are less well
16
detected than the hCGα isoforms, maybe due to a higher heterogeneity of hCGβ and/or a less efficient ionization with its 2N- and 4-O potential glycans, and (ii) that the chromatographic separation is not resolute enough to facilitate the ionization and thus the detection of the hCGβ isoforms, thus highlighting the challenge of protein analysis at the intact scale.
To reduce the complexity of the hCG protein and to favor the ionization of the β-subunit, different analytical strategies can be considered. Indeed, a reduction step can be performed to completely dissociate the two subunits before their analysis in order to have different
retention times, and thus to favor the ionization of the β-subunit. Then, a PNGase-F treatment
can be applied to remove the N-glycans with the aim of analyzing only O-isoforms of the β-subunit. However, these two strategies were not considered in this paper because the objective here was to evaluate the potential of the hCG analysis at intact level without any preparation of the sample and the different challenges associated to this approach.
Therefore, to simplify the MS data processing and focus only on the major isoforms of hCGα, the deconvolution method was applied to the entire elution zone, between 28.5 and 33.4 min for both r-hCG and u-hCG (Figures 5A and 5B, respectively).
For r-hCG, at least seven major isoforms were observed with mass values between 13,732 and 14,681.1 Da. As illustrated in Figure 5A, some isoforms (13,732.9, 14,024.9, 14,315.9 and 14,607.7 Da) have a mass difference equal to 291 Da, which corresponds to the average mass of an N-acetylneuraminic acid (Neu5Ac) residue with the loss of a water molecule. It is possible to conclude that a large proportion of these hCGα isoforms are sialylated. As highlighted in Table 1, the separation method also allowed the separation of these isoforms and it was therefore possible to observe an interdependence of retention time vs the number of sialic acids present on the hCGα. To confirm this hypothesis, the main isoforms of r-hCGα mentioned previously were selected and their extracted ion chromatograms (XIC) were
17
plotted on the same chromatogram (Figure 6). It appears that retention times increase with the number of sialic acids. This surprising result in RPLC may be due to the specific nature of the used stationary phase that may contain polar moieties next to the silica surface close to the C18 chain and that is recommended by the company for the retention of polar acid compounds.
Concerning u-hCG, Figure 5B reveals at least 6 isoforms with mass differences that are characteristic of some glycans monosaccharides (Table 1). Indeed, they correspond to an N-acetylneuraminic acid (291 Da between 13,658.4 and 13,950.7) and to a hexose (161 Da between 13,293.3 and 13,455.5, 13455.5 and 13616.5 or 13,950.7 and 14,112.3).
To determine the exact composition and the structure of the N-glycans associated to a protein, a deglycosylation step is classically performed to analyze the released N-glycans. However, this approach requires a large amount of material and involves several steps of sample treatment (purification, labeling …). Consequently, our strategy was rather to create a database of all the MWs of the N-glycans already described for hCG in the literature and to identify the isoforms of hCGα by mass matching. The database contained around 70 N-glycans. With the deconvoluted spectra, the total mass of the glycans present in the isoforms was calculated for each isoform by the subtraction of the known deglycosylated MW of hCGα. This database allows the assessment of all the possible combinations of N-glycans leading to the measured total mass of glycans with an uncertainty of 0.25 Da.
This strategy of mass matching identification was applied to hCG and u-hCG. Concerning r-hCGα, 5 combinations of N-glycans were identified for the isoforms having masses of 13,732.9, 14,024.9, 14,315.9, 14,607.7 and, 14681.1 and, they were reported in Figure 5A. These r-hCGα isoforms were composed of sialylated N-glycans with two antennas, except for one form (14681.1 Da), which contains an N-glycan with three antennas. For hCG, 5 glycoforms of
u-18
hCGα were successfully identified, with N-glycans composed of two antennas (complex type) and the presence of hybrid glycans (1 complex chain and 1 high-mannose chain). They were reported in Figure 5B.
These results confirmed the presence of different glycoforms in each hCG-based drug, which probably results from their different origin (recombinant vs purified from the urines of pregnant women). Other peaks of the two drugs did not match with the database (e.g. 13489.0 Da for r-hCG and 13658.4 Da for u-hCG). These isoforms may correspond to other kinds of PTMs than glycosylation. In order to confirm this hypothesis and the identification of hCGα isoforms, a higher mass resolution and complementary data obtained from bottom-up and glycan approaches are therefore needed. Nevertheless, this study demonstrates the high potential of LC-HRMS to characterize and identify hCGα isoforms at the intact level without any tedious and time-consuming step of preparation of the sample.
4. Conclusion and perspectives
To the best of our knowledge, this study is the first one dealing with the analysis of hCG at the intact level by LC-HRMS. After the optimization of different key parameters of the LC-HRMS method (mobile phase gradient slope, temperature and detection parameters) with the r-hCG, the method allowed to resolve at least 12 chromatographic peaks, each corresponding to a multiple number of hCG isoforms. Then, the method was applied for the characterization of u-hCG. The results demonstrated that the two hCG-based drugs contain different isoforms in number and nature, due to different glycosylated forms or other PTMs. After a deconvolution step, the results revealed only the presence of hCGα isoforms despite the optimization of the RPLC separation. Indeed, it seems that the heterogeneity of hCG is too complex to detect all isoforms of the hCG, especially those of hCGβ. Therefore, a PNGase-F
19
digestion after a reduction step will help to reduce the complexity of hCG-sample and favor the ionization of hCGβ isoforms.
Nevertheless, more than 30 isoforms were detected for both r-hCGα and u-hCGα, and some of the main hCGα isoforms were identified by mass matching. The next step of this work will be to carry out analysis with a higher resolution MS analyzer, such as a Fourier Transform Ion Cyclotron Resonance (FT-ICR). The higher sensitivity and, above all, the higher accuracy of the MS should allow the identification of much more isoforms, without having errors due to the overlapping of isotopic patterns. Nevertheless, the transfer of the RPLC method to a nanoscale format will be required to facilitate the coupling with the FT-ICR MS and to increase the sensitivity of the most minor isoforms. However, the optimization of the different LC parameters carried out in this study will facilitate this step.
Acknowledgments
This work has received the support of "Institut Pierre-Gilles de Gennes" (laboratoire d’excellence, “Investissements d’avenir” program IDEX-0001-02 PSL and ANR-10-LABX-31.).
20
References:
1. Fournier T, Guibourdenche J, Evain-Brion D (2015) Review: hCGs: different sources of production, different glycoforms and functions. Placenta 36 Suppl 1:S60-65 . doi: 10.1016/j.placenta.2015.02.002
2. Guibourdenche J, Burc L, Frendo J., Flament G, Kacprzak A, Bazot I, Jeanne P, Porquet D, Muller F (2002) Physiopathologie de l’hormone chorionique gonadotrope humaine (hCG) dans la trisomie 21 fœtale. Immuno-Anal Biol Spéc 17:2–10 . doi: 10.1016/S0923-2532(02)01159-6 3. Liu L, Leaman D, Villalta M, Roberts RM (1997) Silencing of the gene for the alpha-subunit of
human chorionic gonadotropin by the embryonic transcription factor Oct-3/4. Mol Endocrinol Baltim Md 11:1651–1658 . doi: 10.1210/mend.11.11.9971
4. Mechref Y, Muddiman DC (2017) Recent advances in glycomics, glycoproteomics and allied topics. Anal Bioanal Chem 409:355–357 . doi: 10.1007/s00216-016-0093-9
5. Handschuh K, Guibourdenche J, Tsatsaris V, Guesnon M, Laurendeau I, Evain-Brion D, Fournier T (2007) Human Chorionic Gonadotropin Expression in Human Trophoblasts from Early Placenta: Comparative Study Between Villous and Extravillous Trophoblastic Cells. Placenta 28:175–184 . doi: 10.1016/j.placenta.2006.01.019
6. Diaz-Cueto L, Barrios-de-Tomasi J, Timossi C, Mendez JP, Ulloa-Aguirre A (1996) More in-vitro bioactive, shorter-lived human chorionic gonadotrophin charge isoforms increase at the end of the first and during the third trimesters of gestation. Mol Hum Reprod 2:643–650 . doi:
10.1093/molehr/2.9.643
7. Zhu H, Li X, Qu J, Xiao C, Jiang K, Gashash E, Liu D, Song J, Cheng J, Ma C, Wang PG (2017) Diethylaminoethyl Sepharose (DEAE-Sepharose) microcolumn for enrichment of glycopeptides. Anal Bioanal Chem 409:511–518 . doi: 10.1007/s00216-016-9937-6
8. Alagesan K, Khilji SK, Kolarich D (2017) It is all about the solvent: on the importance of the mobile phase for ZIC-HILIC glycopeptide enrichment. Anal Bioanal Chem 409:529–538 . doi: 10.1007/s00216-016-0051-6
9. Dong X, Zhou S, Mechref Y (2016) LC-MS/MS analysis of permethylated free oligosaccharides and N-glycans derived from human, bovine, and goat milk samples: Liquid Phase Separations. ELECTROPHORESIS 37:1532–1548 . doi: 10.1002/elps.201500561
10. Fekete S, Dong MW, Zhang T, Guillarme D (2013) High resolution reversed phase analysis of recombinant monoclonal antibodies by ultra-high pressure liquid chromatography column coupling. J Pharm Biomed Anal 83:273–278 . doi: 10.1016/j.jpba.2013.05.022
11. Haselberg R, de Jong GJ, Somsen GW (2007) Capillary electrophoresis–mass spectrometry for the analysis of intact proteins. J Chromatogr A 1159:81–109 . doi:
10.1016/j.chroma.2007.05.048
12. Vreeker GCM, Wuhrer M (2017) Reversed-phase separation methods for glycan analysis. Anal Bioanal Chem 409:359–378 . doi: 10.1007/s00216-016-0073-0
21
13. Wuhrer M, de Boer AR, Deelder AM (2009) Structural glycomics using hydrophilic interaction chromatography (HILIC) with mass spectrometry. Mass Spectrom Rev 28:192–206 . doi: 10.1002/mas.20195
14. Sinha S, Pipes G, Topp EM, Bondarenko PV, Treuheit MJ, Gadgil HS (2008) Comparison of LC and LC/MS methods for quantifying N-glycosylation in recombinant IgGs. J Am Soc Mass Spectrom 19:1643–1654 . doi: 10.1016/j.jasms.2008.07.004
15. Nerenz RD, Butch AW, Woldemariam GA, Yarbrough ML, Grenache DG, Gronowski AM (2016) Estimating the hCGβcf in urine during pregnancy. Clin Biochem 49:282–286 . doi:
10.1016/j.clinbiochem.2015.10.020
16. Lund H, Løvsletten K, Paus E, Halvorsen TG, Reubsaet L (2012) Immuno-MS based targeted proteomics: highly specific, sensitive, and reproducible human chorionic gonadotropin determination for clinical diagnostics and doping analysis. Anal Chem 84:7926–7932 . doi: 10.1021/ac301418f
17. Liu C, Bowers LD (1997) Mass spectrometric characterization of nicked fragments of the beta-subunit of human chorionic gonadotropin. Clin Chem 43:1172–1181
18. Gam L-H, Latiff A (2005) SDS-PAGE electrophoretic property of human chorionic gonadotropin (hCG) and its beta-subunit. Int J Biol Sci 1:103–109
19. Morbeck DE, Madden BJ, McCormick DJ (1994) Analysis of the microheterogeneity of the glycoprotein chorionic gonadotropin with high-performance capillary electrophoresis. J Chromatogr A 680:217–224 . doi: 10.1016/0021-9673(94)80070-7
20. Bassett R, De Bellis C, Chiacchiarini L, Mendola D, Micangeli E, Minari K, Grimaldi L, Mancinelli M, Mastrangeli R, Bucci R (2005) Comparative characterisation of a commercial human chorionic gonadotrophin extracted from human urine with a commercial recombinant human chorionic gonadotrophin. Curr Med Res Opin 21:1969–1976 . doi: 10.1185/030079905X75005 21. Toll H, Berger P, Hofmann A, Hildebrandt A, Oberacher H, Lenhof HP, Huber CG (2006)
Glycosylation patterns of human chorionic gonadotropin revealed by liquid chromatography-mass spectrometry and bioinformatics. ELECTROPHORESIS 27:2734–2746 . doi:
10.1002/elps.200600022
22. Butler S (1999) The beta-subunit of human chorionic gonadotrophin exists as a homodimer. J Mol Endocrinol 22:185–192 . doi: 10.1677/jme.0.0220185
23. Sandra K, Vandenheede I, Sandra P (2014) Modern chromatographic and mass spectrometric techniques for protein biopharmaceutical characterization. J Chromatogr A 1335:81–103 . doi: 10.1016/j.chroma.2013.11.057
24. Fekete S, Veuthey J-L, Eeltink S, Guillarme D (2013) Comparative study of recent wide-pore materials of different stationary phase morphology, applied for the reversed-phase analysis of recombinant monoclonal antibodies. Anal Bioanal Chem 405:3137–3151 . doi: 10.1007/s00216-013-6759-7
25. Berger P, Lapthorn AJ (2016) The molecular relationship between antigenic domains and epitopes on hCG. Mol Immunol 76:134–145 . doi: 10.1016/j.molimm.2016.06.015
22
26. Fekete S, Beck A, Wagner E, Vuignier K, Guillarme D (2015) Adsorption and recovery issues of recombinant monoclonal antibodies in reversed-phase liquid chromatography†: Liquid Chromatography. J Sep Sci 38:1–8 . doi: 10.1002/jssc.201400996
27. Fekete S, Rudaz S, Veuthey J-L, Guillarme D (2012) Impact of mobile phase temperature on recovery and stability of monoclonal antibodies using recent reversed-phase stationary phases: Liquid Chromatography. J Sep Sci 35:3113–3123 . doi: 10.1002/jssc.201200297
28. Cole LA (2010) Hyperglycosylated hCG, a review. Placenta 31:653–664 . doi: 10.1016/j.placenta.2010.06.005
29. Thakur D, Rejtar T, Karger BL, Washburn NJ, Bosques CJ, Gunay NS, Shriver Z, Venkataraman G (2009) Profiling the Glycoforms of the Intact α Subunit of Recombinant Human Chorionic Gonadotropin by High-Resolution Capillary Electrophoresis−Mass Spectrometry. Anal Chem 81:8900–8907 . doi: 10.1021/ac901506p
30. Valmu L, Alfthan H, Hotakainen K, Birken S, Stenman U-H (2006) Site-specific glycan analysis of human chorionic gonadotropin beta-subunit from malignancies and pregnancy by liquid chromatography--electrospray mass spectrometry. Glycobiology 16:1207–1218 . doi: 10.1093/glycob/cwl034
23
Figure caption
Figure 1: Effect of the gradient slope and temperature on the TIC chromatograms of intact
r-hCG obtained by RPLC-HRMS. Mobile phase: 0.1% FA in H2O/ACN mixture (v/v). Gradient: (A)
from 4.5 to 85.5% of ACN with a slope of 6.8%/min or (B,C) from 4.5 to 31.5% of ACN with a slope of 0.5%/min. Temperature: (A,B) 35°C or (C) 65°C. MS detection: 400-5000 m/z, full
scan-positive mode. r-hCG: 100 mg L-1. Other conditions: see experimental section.
Figure 2: Effect of the MS parameters on the TIC chromatograms of intact r-hCG obtained by RPLC-HRMS. MS detection: Transfer interface setting; (A) Collision RF/transfer time: 1600 Vpp/160 µs (100 % of acquisition time). (B) Collision RF/transfer time: 450 Vpp / 100 µs (10 % of acquisition time) and 1600 Vpp/120 µs (90 % of acquisition time), Acquisition time: 1s.
Range: 400-5000 m/z, full scan-positive mode. r-hCG: 100 mg L-1. Other conditions: see Figure
2B.
Figure 3: Comparison between the TICs obtained with the (A) r-hCG, (B) r-hCGβ, and (C) u-hCGβ by RPLC-HRMS. (D) Superposition of the r-hCG and u-hCG TICs between 24 and 36 min.
Concentration: 100 mg L-1. Other conditions: see Figures 2B and 3B.
Figure 4: MS spectra of (A) r-hCG and (B) u-hCG between 28.5 and 33.4min on the TIC
obtained by RPLC-HRMS with the different charge states. Other conditions see Figure 2B.
Figure 5: Deconvoluted spectrum of (A) r-hCG between 13,500 and 15,000 Da and (B) u-hCG between 13,000 and 15,200 Da with the different possible N-glycan structures obtained
24
between 28.5 and 33.4min on the TIC obtained by RPLC-HRMS. Unidentified isoforms are
represented with an asterisk (*).
Figure 6: Effect of the number of sialic acids present on the hCGα vs their retention times in RPLC (eXtracted Ion Chromatograms (XIC) plotted for main isoforms of hCGα with a mass difference to 291 Da: 13,732.9, 14,024.9, 14,315.9 and 14,607.7 Da).
25
Table 1: Absolute mass values (and abundance) corresponding to each chromatographic peaks of Figures 3 A and 3 C after deconvolution obtained for the analysis of r-hCG (a) and u-hCG (b) by RPLC-HRMS. Values in bold highlighted in grey correspond to hCGα isoforms with one recurrent addition of sialic acid (+291 Da). Values in bold and highlighted with an asterisk (*) correspond to hCGα isoforms with one addition of mannose (+161 Da).
a. r-hCGα
# Mass (Abund.) Peak 1 Mass (Abund.) Peak 2 Mass (Abund.) Peak 3 Mass (Abund.) Peak 4 Mass (Abund.) Peak 5 Mass (Abund.) Peak 6 Mass (Abund.) Peak 7 Mass (Abund.) Peak 8 1 13440.9 (1506) 13732.9 (17506) 13820.6 (308) 13820.4 (1123) 12465.4 (1722) 14315.9 (3767) 12724.2 (641) 14607.2 (247) 2 - 13567.9 (622) 13858.0 (599) 14023.9 (28158) 14315.3 (35801) 14330.9 (344) 14607.7 (22152) 15274.3 (242) 3 - 13785.7 (614) 14024.3 (11098) 14037.7 (924) 14328.7 (3423) 14682.4 (481) 14619.0 (2285) 15283.5 (207) 4 - 14098.0 (761) 14077.6 (906) 14076.8 (1219) - 14972.2 (1416) 14647.6 (787) 15313.4 (314) 5 - 16914.5 (566) 17658.9 (607) - - 17960.8 (628) 14660.9 (872) 15628.2 (289) b. u-hCGα
# Mass (Abund.) Peak 13 Mass (Abund.) Peak 14 Mass (Abund.) Peak 15 Mass (Abund.) Peak 16 Mass (Abund.) Peak 17 1 13665.5 (2396) 13455.5 (137)* 11814.2 (987) 13950.7 (6229) 14606.7 (314) 2 13672.6 (2132) 13614.8 (270) 11957.2 (723) 13962.4 (229) 14112.3 (3314)* 3 - 13619.2 (391) 13291.9 (373) 14003.2 (362) 14751.58 (184) 4 - 13624.2 (142) 13292.3 (4824)* 14112.2 (1865) 14749.75 (222) 5 - 13658.4 (172) 13344.3 (500) 14274.5 (482) 14313.00 (331) 6 - 13662.6 (119) 13455.2 (3643) - 14756.72 (251) 7 - 13666.2 (519) 13616.5 (2206)* - - 8 - 13668.6 (446) 13950.7 (1185) - - 9 - 13668.9 (167) 17093.1 (2170) - - 10 - 13963.7 (162) - - - 11 - 13965.5 (445) - - -
Figure 1 8 9 10 11 12 13 14 Time [min] 1 2 3 4 5 5 x10 Intens. 28 30 32 34 36 Time [min] 0 1 2 3 5 x10 Intens.
A
28 29 30 31 32 33 34 35 36 Time [min] 0 1 2 3 5 x10 Intens.B
C
Figure 2 26 28 30 32 34 36 Time [min] 0.0 0.5 1.0 1.5 2.0 2.5 5 x10 Intens.
A
B
Figure 3 5 10 15 20 25 30 35 40 Time [min] 0.0 0.5 1.0 1.5 2.0 2.5 5 x10 Intens. 5 10 15 20 25 30 35 40 Time [min] 0.0 0.5 1.0 1.5 2.0 2.5 5 x10 Intens.
A
B
1 2 3 4 5 67 8 9 10 11 12 5 10 15 20 25 30 35 40 Time [min] 0.0 0.5 1.0 1.5 2.0 2.5 5 x10 Intens. 24 26 28 30 32 34 36 Time [min] 0.0 0.5 1.0 1.5 2.0 2.5 5 x10 Intens. 1314 15 16 17C
D
Figure 4
10+
8+
7+
9+
1432.81 1461.84 1527.01 1559.30 1591.72 1624.01 1664.77 1717.71 1754.121790.51 1826.94 1872.51 1962.98 2004.52 2046.20 2087.81 rhCGgaz8-FUNEL300-F400-600HX_3438.d: +MS, 28.5-33.6min #855-1006 0 1000 2000 3000 4000 Intens. 1400 1600 1800 2000 2200 m/z 1478.12 1550.90 1662.71 1744.82 1826.90 1900.12 1993.93 2087.54 2216.41 2325.92 u-hCG-20-65_3196.d: +MS, 29.3-32.7min #876-978 0 250 500 750 1000 1250 Intens. 1400 1600 1800 2000 2200 m/z9+
7+
8+
B
A
Mannose (Man) Galactose Acid N-acetylneuraminique N-acetylglucosamine Fucose N-acetylgalactosamine 13292.3Mr 13455.5Mr 13616.5Mr 13950.7Mr 14112.3Mr +MS, 29.5-31.9min, Deconvoluted 0 500 1000 1500 2000 2500 Intens. 13000 13200 13400 13600 13800 14000 14200 14400 14600 14800 m/z 13732.9Mr 14024.9Mr 14315.9Mr 14607.7Mr 14681.1Mr +MS, 29.0-32.4min, Deconvoluted 0.0 0.2 0.4 0.6 0.8 1.0 4 x10 Intens. 13600 13800 14000 14200 14400 14600 14800 m/z 13732.9 14024.9 14315.9 14607.7 14681.1 14389.0 14112.3 13292.3 13455.5 13616.5 or ΔM= +161 Da ΔM= +161 Da ΔM = +291Da ΔM =+291 Da ΔM =+ 291 Da 13658.4 13950.7
A
B
Figure 5Figure 6 20 22 24 26 28 30 32 34 36 38 Time [min] 0.0 0.5 1.0 1.5 2.0 4 x10 Intens. 13732.9 14024.9 14315.9 14607.7
Figure S1: Separation of intact r-hCG by RPLC-UV with a mobile phase containing 0.1% TFA in
H2O/ACN mixture (v/v). Gradient: from 4.5 to 85.5% of ACN with a slope of 6.8%/min.
Temperature: 40°C. Flow: 0.4 ml min-1. UV detection: 214 nm. r-hCG: 500 mg L-1.
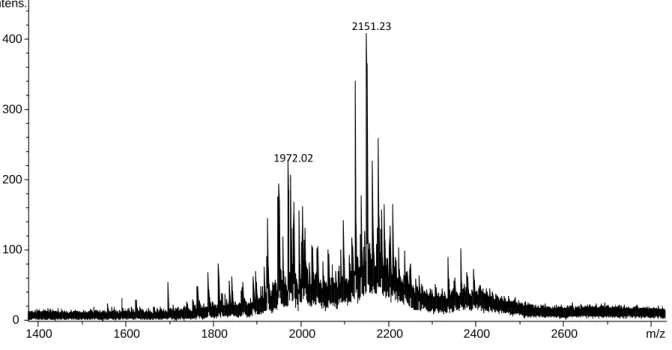
Figure S2: MS spectrum of r-hCG between 32.0 and 34.0min on the TIC obtained by
RPLC-HRMS. Gradient: from 4.5 to 85.5% of ACN with a slope of 0.5%/min, Temperature: 65°C. Flow: 0.4 ml min-1. r-hCG: 500 mg L-1. AU 0.00 0.50 1.00 1.50 Minutes 0.00 2.00 4.00 6.00 8.00 10.00 12.00 14.00 16.00 18.00 20.00 22.00 24.00 26.00 28.00 30.00 1972.02 2151.23 0 100 200 300 400 Intens. 1400 1600 1800 2000 2200 2400 2600 m/z
Table S1: MS tune parameters recommended by the manufacturer (Bruker Daltonics) for the analysis of macromolecules (with m/z > 1000).
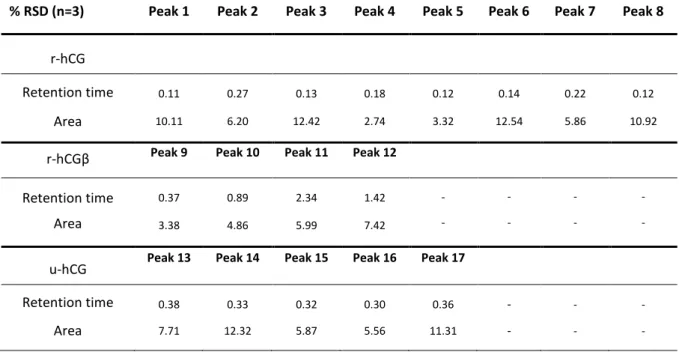
Table S2: Relative standard deviation (RSD) values of the retention times and the areas of the main peaks obtained for the r-hCG, r-hCGβ, and u-hCG analysis by RPLC-HRMS with the
optimized conditions (r-hCG, u-hCG, and r-hCGβ: 100mgL-1). For peaks number: see Figures
3A, 3B, and 3C.
Transfer
Funnel 1 RF 400.0 Vpp isCID 0.0 eV
Funnel 2 RF 600.0 Vpp Hexapole RF 800.0 Vpp Quadrupole
Ion energy 5.0 eV Low mass 300 m/z
Collision Cell
Collision Energy 10.0 eV Collision RF 1600 Vpp
Transfer Time 160.0 µs Pre-Pulse Storage 15 µs
% RSD (n=3) Peak 1 Peak 2 Peak 3 Peak 4 Peak 5 Peak 6 Peak 7 Peak 8
r-hCG
Retention time 0.11 0.27 0.13 0.18 0.12 0.14 0.22 0.12
Area 10.11 6.20 12.42 2.74 3.32 12.54 5.86 10.92
r-hCGβ Peak 9 Peak 10 Peak 11 Peak 12
Retention time 0.37 0.89 2.34 1.42 - - - -
Area 3.38 4.86 5.99 7.42 - - - -
u-hCG Peak 13 Peak 14 Peak 15 Peak 16 Peak 17
Retention time 0.38 0.33 0.32 0.30 0.36 - - -

![Figure 1 8 9 10 11 12 13 14 Time [min]12345x105Intens. 28 30 32 34 36 Time [min]0123x105Intens.A 28 29 30 31 32 33 34 35 36 Time [min]0123x105Intens.BC](https://thumb-eu.123doks.com/thumbv2/123doknet/14662782.554689/27.1262.411.883.47.822/figure-time-min-intens-time-intens-time-intens.webp)
![Figure 2 26 28 30 32 34 36 Time [min]0.00.51.01.52.02.5x105Intens.AB](https://thumb-eu.123doks.com/thumbv2/123doknet/14662782.554689/28.1262.112.637.149.441/figure-time-min-x-intens-ab.webp)
![Figure 3 5 10 15 20 25 30 35 40 Time [min]0.00.51.01.52.02.5x105Intens.510152025303540 Time [min]0.00.51.01.52.02.5x105Intens.AB123456789101112 5 10 15 20 25 30 35 40 Time [min]0.00.51.01.52.02.5x105Intens](https://thumb-eu.123doks.com/thumbv2/123doknet/14662782.554689/29.1262.123.1083.163.737/figure-time-min-intens-time-intens-time-intens.webp)

![Figure 6 20 22 24 26 28 30 32 34 36 38 Time [min]0.00.51.01.52.0x104Intens.13732.914024.914315.914607.7](https://thumb-eu.123doks.com/thumbv2/123doknet/14662782.554689/32.1262.277.955.298.647/figure-time-min-x-intens.webp)