Binding Civil and Civic Infrastructure: The Need for Transparency and Accountability in Baltimore’s Water Crisis by Haleemah N. Qureshi B.Sc. Civil and Environmental Engineering University of California, Berkeley, 2013 Submitted to the Department of Urban Studies and Planning in partial fulfillment of the requirements for the degree of Master in City Planning at the MASSACHUSETTS INSTITUTE OF TECHNOLOGY JUNE 2018 ©2018 Haleemah N. Qureshi. All rights reserved. The author hereby grants to MIT permission to reproduce and to distribute publicly paper and electronic copies of this thesis document in whole or in part in any medium now known or hereafter created. Signature of Author: ________________________________________________________________________________ Department of Urban Studies and Planning May 23, 2018 Certified by: __________________________________________________________________________________________ Assistant Professor Gabriella Carolini Thesis Supervisor Department of Urban Studies and Planning Accepted by: _________________________________________________________________________________________ Professor of the Practice, Ceasar McDowell Chair, MCP Committee Department of Urban Studies and Planning
Binding Civil and Civic Infrastructure: The Need for Transparency and Accountability in Baltimore’s Water Crisis by Haleemah N. Qureshi Submitted to the Department of Urban Studies and Planning on May 23, 2018 in partial fulfillment of the requirements for the degree of Master in City Planning Abstract With declining federal assistance for essential infrastructure upgrades, water and wastewater utilities have increasingly relied on customer revenue to fill funding gaps. This has led most recently to “water crises” in cities such as Baltimore and Detroit, where residents who cannot afford to pay increasing rates have been disconnected from water services altogether. Although utility disconnection is a common practice to collect unpaid revenue, the scale and duration of these shut-offs is unprecedented, and, in both cases, the result of concurrent urban fiscal and social crises. In the absence of legislation that secures the right to water for all American citizens, people addressing the problems have typically tried to identify sources of infrastructure funding that would be more equitable, or calculate levels of payment that are truly affordable. In light of these debates, this thesis asks whether processes of deliberation between the government and the public might serve a critical role in alleviating the problem. After investigating Baltimore’s financial structures and exploring causes of confrontation between the public and the utility, this thesis suggests transparency and accountability reforms that enhance planning processes which involve citizens so Baltimore’s DPW can move beyond the practice of just counting meters, to one of seeing and hearing customers. The thesis argues that, short of improving the infrastructure, the processes of citizen engagement, particularly via the collaboration of various state and utility departments, will help improve the technical and financial efficiency of the utility and create greater equity for customers through providing data and records that bolster various processes and programs, from account classification to collection to customer assistance to information about cognate programs such as affordable housing—all of which will make it easier to assess and determine equity. The ultimate goal is to meet the financial and physical needs of water and wastewater utilities, while also addressing issues of equity, with a focus on deliberation and data collection that places an emphasis on process that leads to both desired outcomes. Thesis Supervisor: Gabriella Carolini Title: Assistant Professor of Urban Planning Thesis Reader: Shadi Eskaf Title: Senior Project Director, Environmental Finance Center at UNC
Acknowledgments I owe my deepest gratitude and respect to the guidance and support of a network of advisors and loved ones. Those who humored me by listening to me rant about water infrastructure in America when I thought that I knew it all, those who gently encouraged me when I hit roadblocks, and those who reminded me of my worth, and provided perspective, when the task at hand seemed too big for me to tackle. To the officials and advocates in Baltimore, who graciously trusted an outsider with their time and opinions, this thesis would not be possible without your input, and I hope it can contribute to your work in the long run. To my advisor, Gabriella, a sincere thank you, for being an anchor in an otherwise stormy process, and for pushing me to follow my interests instead of settling for pragmatism, while never abandoning it either. I marvel at the support you could grant me, while anchoring so many others at the same time. To my reader, Shadi, thank you for your invaluable commentary, and for providing a practitioner’s perspective on a topic that will require the creativity of diverse opinions to tackle the challenges at hand. To my unofficial reader, Garnette, thank you for injecting inspiration and authenticity into a writing process that could have otherwise easily fallen flat. To my closest friends and loved ones from DUSP, your continuous presence, support, passion, and dedication in this journey has resulted in personal growth that will keep shaping my theory of practice and relationships long after we graduate. I hope we can celebrate and weather future storms together. To my closest friends in far-away places, your virtual presence through phone calls and messages of encouragement and humor got me through some of my toughest points. I am only here because of the paths we shared at one point or another, and for that I will always be grateful. To my family, from those who are no longer with me, to the newest arrivals, it is impossible to fully acknowledge the support, guidance and love that got me here, in any way that seems adequate. Aapko mera salaam. To the country that formally adopted me this year, thank you for the opportunities you have presented. This thesis was an endeavor in strengthening some of your weaknesses through the value of a different perspective, dedicated work, and honesty. To the country of my birth, a home, real and imagined, an apology for not being able to work on your behalf at this time but a hope that this endeavor will translate itself into support for the equal progress of all your people in the future.
Table of Contents
Motivations and Positionality ... 9 Chapter I: Introduction ... 16 Problem Statement ... 22 Deliberative Democracy ... 23 Methodology ... 26 Chapter II: The Origins of Baltimore’s Water and Wastewater Systems ... 32 A Brief History of “Crisis” ... 36 Chapter III: Building Financial Pressure ... 41 Baltimore’s Department of Public Works: Present Day ... 41 DPW Budget ... 43 Enterprise Funds ... 44 User Fees ... 46 Revenues Versus Expenses ... 49 Increasing Costs ... 52 Financing Options: Federal and State Funding ... 59 Compounding Pressures: Baltimore Demographics ... 69 Chapter IV: DPW Responds to Growing Needs ... 74 Controlling Costs with Integrated Planning and Outsourcing ... 74 Raising more revenue ... 85 Chapter V: Citizens Respond to Growing Burdens ... 109 Sowing the seeds of distrust through incorrect billing ... 110 Perception of unfairness as rates continue to rise ... 115 Rising Frustrations and Demands for Accountability ... 125 Political Responses and Standoffs: Government vs. The People ... 128 Chapter VI: Potentials for Improvement ... 134 Valuing the Customer: The Case of DC Water ... 135 Transparency and accountability ... 142 Charting a course forward ... 144 Future Research ... 156 Conclusion ... 160 Bibliography ... 162 Appendix A: DPW Public Information Act Request ... 181 Appendix B: DPW Public Information Act Response ... 183 Appendix C: List of Interviews ... 187 Appendix D: City of Baltimore Application for WIFIA Funding ... 188 Appendix E: DPW Customer Assistance Programs ... 189 Appendix F: Baltimeter Fact Sheet ... 192 Appendix G: DPW Sample Water Bill ... 193
Tables
TABLE 1: PERCENTAGE OF CONTRIBUTION DPW’S OPERATING BUDGET BY FUND (OFFICE OF MAYOR 2017) ... 46 TABLE 2: DPW DEBT SERVICE PAYMENTS FOR FY2013- FY2017 (“CAFR” 2013-2017) ... 50 TABLE 3: PLANNED SPENDING BETWEEN 2016 AND 2034 (DPW 2016B): ... 58 TABLE 4:OUTSTANDING REVENUE BONDS FOR BUREAU OF WATER AND WASTEWATER FUNDS, FY2015-2017 (“CAFR” 2015-2017) ... 67 TABLE 5: NUMBER OF PARTICIPANTS IN DPW CUSTOMER ASSISTANCE PROGRAMS, 2010-2016 (CITY COUNCIL 2016) ... 81 TABLE 6: DPW RATE INCREASES AND AVERAGE HOUSEHOLD BILLS, 2002-2018 (DPW 2018B) ... 89 TABLE 7: DEPARTMENT OF AUDITS RECOMMENDED INCREASES FOR WATER AND WASTEWATER RATES (BOE 2013) ... 93 TABLE 8: RECORD OF VOTES FOR AND AGAINST REQUESTED RATE INCREASES, 2010-2016 (BOE 2010, 2013, 2016) ... 96 TABLE 9: DPW UNCOLLECTED DEBT AND DELINQUENT ACCOUNTS (BOE 2013; DPW 2018B) ... 98 TABLE 10: BALTIMORE TAX SALE DATA, 2012-2017 (BIDBALTIMORE, N.D.; DPW 2018B) ... 104 TABLE 11: CITY VS. COUNTY BILLING METHODS AND RATES FOR FY 2016 (DPW 2015C) ... 123 TABLE 12: DC WATER 2020 STRATEGIC PLAN FRAMEWORK (DC WATER 2015) ... 136
Figures
FIGURE 1: BALTIMORE DEPARTMENT OF PUBLIC WORKS SERVICE AREA ... 41 FIGURE 2: DPW ANNUAL BUDGET FY2014 – FY 2017 (DPW 2015A, 2016A, 2017A, 2018A) ... 44 FIGURE 3: DPW ORGANIZATIONAL STRUCTURE AND ENTERPRISE FUNDS (OFFICE OF THE DIRECTOR 2018; “CAFR” 2017) ... 45 FIGURE 4: DPW EXPENSES AND CHARGES FROM FY2012 – FY 2017 (“CAFR” 2012-2017) ... 49 FIGURE 5: DPW’S DEBT SERVICE COVERAGE RATIO FOR FY2013 – FY2017 (“CAFR” 2013-2017) ... 51 FIGURE 6: FEDERAL VS. STATE AND LOCAL SPENDING ON WATER UTILITIES, 1956-2014 (CBO 2015, EXHIBIT 19) ... 60 FIGURE 7: TOTAL FEDERAL SPENDING FOR WATER UTILITIES, 1956-2014 (CBO 2015, SUPPLEMENTAL TABLES W-8) ... 60 FIGURE 8: CITY OF BALTIMORE PLEDGED REVENUE FOR DEBT SERVICE – WATER AND WASTEWATER UTILITIES (“CAFR” 2000; “CAFR” 2007; “CAFR” 2017) ... 67 FIGURE 9: BALTIMORE SIX YEAR CIP 2018-2023: WATER, WASTEWATER, AND STORMWATER PROJECTS (DEPARTMENT OF PLANNING 2017) ... 68 FIGURE 10: BALTIMORE’S POPULATION BY RACE, 1970-2014 (YEIP 2015) ... 70 FIGURE 11: BALTIMORE POPULATION ESTIMATES 2006-2016 (ACS 1-YEAR ESTIMATES) ... 71 FIGURE 12: ANNUAL MEDIAN HOUSEHOLD INCOME DISTRIBUTION (ACS 2016, 5 YEAR ESTIMATES) ... 72 FIGURE 13: BALTIMORE IPF BENEFIT CATEGORIES (CHOW ET AL. 2013) ... 77 FIGURE 14: AFFORDABILITY ANALYSIS OF CITY CENSUS TRACTS AT CONSUMPTION OF 21 CCF/QUARTER BY 2030, UNDER RATE INCREASES FROM SCENARIO 3 (LEFT) AND SCENARIO 1B (RIGHT) (CHOW ETMotivations and Positionality On the morning of June 23rd, 2016, I received an email in my official inbox, declaring that an early leave policy was in effect for the day, and that workers could leave the office anytime they wished. The cause was not weather, as is common in Baltimore, but an impending storm of a different kind. The verdict for police officer Caesar Goodson Jr., charged with second-degree murder and three counts of manslaughter, was to be announced that day. It had been over a year since his involvement in the death of Freddie Gray, but the subsequent protests and demands to address police brutality remained fresh in the city’s mind. Our office, Louis Berger, located in downtown Baltimore, was a mere block away from City Hall and police headquarters. Protests and general disorder were predicted for the aftermath of the verdict, perhaps because the verdict itself was predictable. And so most of us packed up our bags for the day and made our ways home, away from downtown, and away from City Hall, a place we would otherwise frequent on a daily or weekly basis when the city called us in for our technical projects regarding water and wastewater. This time, instead of calling us in, the city was telling us to evacuate. This was not our problem. *** Civil and environmental engineers like to claim that we, and the work that we do, is undervalued. This belief is held in part because despite our technical expertise, and despite our knowledge of how to replace and fix the nation’s infrastructure, few outside the profession are willing to talk about it, and even fewer are willing to pay for it. This
challenge has led to decades of underinvestment and a build-up of physical deterioration for which the solution is now estimated to cost trillions of dollars. When trying to understand how we got here, three explanations are widely offered: physical invisibility, ease of access, and political paralysis. In the water and wastewater sector, the majority of hard infrastructure lies beneath the ground, where it was placed decades ago. In a notable publication from 2012, the American Water Works Association (AWWA) argued that most of the nation’s drinking water infrastructure had been “buried in the national consciousness” and now that it was reaching the end of its useful life, it could be “buried no longer.” The invisibility of water infrastructure is played up outside industry organizations as well, with news reports and articles raising concerns about underground pipes remaining “out of sight, out of mind,” leaving their deterioration unnoticed, until they burst and roads are destroyed, properties are flooded, and lives are put at risk. Ease of access is another major factor that civil and environmental engineers have to contend with in the water sector. Because the systems that treat and distribute water remain invisible, the resource itself becomes an assumed good, readily available but not always appreciated for the social and economic value it generates. As a result, industry organizations are supporting a campaign designed to raise awareness around the “value of water”. On the campaign’s landing page, this message stands out in bold:
“Essential. Reliable. Invaluable. Water—it’s the thread that weaves together our daily lives. It keeps our communities healthy, our cities running, and our economies growing. Water is a cup of coffee, the produce aisle, better production, increased exports, and greater American strength. While essential, water infrastructure is largely invisible. Few people realize what it takes to treat and deliver drinking water every day or how wastewater is cleaned so that it can be safely reused or returned to the environment. The high quality of life we enjoy in America would not be possible without water and the infrastructure that fuels it.” The campaign also commissioned a report to quantify the “economic benefits of investing in water infrastructure” and found that investments in water would generate 1.3 million jobs over a 10-year period, and result in $220 billion dollars in total economic activity to the country. While the returns might sound attractive, the price tag of the investment is now well over $1 trillion by some estimates. Having studied, worked, and been raised in a context which some might call “developing,” I find the U.S.’s relationship with drinking water not only surprising, but concerning. The continuous availability of fresh, clean, water is taken for granted, and even when people appreciate its presence, they have difficulty quantifying its benefits. To add to the problem, the highest levels of government have been unable to respond with an effective, comprehensive solution. While both political parties agree that the issue must be addressed, Congress seems unable to chart a course forward. In response, the American
Society of Civil Engineers (ASCE) has placed the following call on its website: “We need your help to get Congress and state legislatures to take action on the things that matter most to civil engineers.” For those wondering what things matter most to civil engineers, ASCE offers the following: civil engineers serve as planners, designers, constructors and operators of the built environment, the ultimate economic and social engine of society. In short, issues that matter to civil engineers, should matter to all people. For the two years that I practiced engineering, this remained a point of pride. I could not imagine then, that in another two years, I might be asking a different kind of question: when should issues that matter to all people, matter to all civil engineers? *** In January 2018, I sat down with Bill Henry, a Councilmember of Baltimore’s 4th district. I had requested a meeting with him to discuss issues of water affordability in the city, the subject of a research project called “American Water Shutoffs” led by faculty members in my department at MIT, where I was completing a Master’s degree in City Planning. My transition from engineering to planning had been driven by the desire to understand and contend with the sociopolitical structures that produced obstacles for delivering basic services like water and sanitation. Although I was studying developing contexts, the
Motivated by the Flint crisis and news of water disconnections or “shutoffs” in cities including Detroit and Baltimore, our group’s research aimed “to develop financially sustainable and socially equitable solutions” that made water affordable for all urban residents in cities facing financial distress and infrastructure failure. I looked forward to speaking with members of the Department of Public Works (DPW) in Baltimore, to understand their struggles, as much as the struggles that urban residents were facing with rising water costs. Members of the utility proved difficult to get in touch with. Given the political sensitivity of the issue, and the slew of recent articles in the Baltimore Sun painting DPW in a less than favorable light, their hesitance to speak about the issue was unsurprising and unfortunate. Faced with that limitation, I reached out to an advocacy organization that had most prominently, and most recently, been organizing around the issue: Food and Water Watch (FWW). Although a national organization, FWW has city chapters dedicated to issues within their geographies. The Baltimore chapter had commissioned and released a report on “Baltimore’s Water Conundrum” in November 2017, prepared by Roger Colton, a legal expert in the world of affordable utility financing. After speaking with him, I was connected with other advocates on the ground who had organized themselves as the “Baltimore Right to Water Coalition.” They, in turn, led me to City Councilmembers and State Legislators with whom they had been meeting to address the problem.
By the time I met with Councilman Henry, a number of advocates had already drawn a very clear conclusion for me: DPW cared more about the physical system, than about the people it served. As a researcher, I knew that I had only heard one side of the story, and as an engineer, I wanted to give the benefit of doubt to the utility. The story could not be that simple. Therefore, when I met with the Councilman, I wanted to understand how he saw the problem, given that he was not constrained to this single issue, and his mandate was to serve his constituents. I prompted him about how access to affordable water related to the larger “cloud” of issues that people were facing. Although I immediately regretted the choice of that word on my part, I would come to appreciate it when, in response, he made a gesture, then leaned down and spoke directly into the phone that he had agreed to be recorded upon. Doing my job for me, he recited his own actions into the microphone: “Mr. Henry waved his arms and hands around in a large gesture, implying that the cloud was very big.” Intentional or not, his amusing reaction quietly subverted the interview before it had even begun, and reminded me of my role and responsibility. Baltimore is not a stranger to outsiders who assume that first and foremost, it is a dysfunctional city, and I was not the first one who had come around looking for answers and solutions to my own assumptions. While being an outsider presented its challenges and limitations, it also presented
approach practiced abroad. Whereas the World Bank and other development organizations would be quick to study human capacity, institutional strength, and political upheaval as significant challenges to successful implementation of infrastructure systems abroad, infrastructure in the 21st century has become a purely technical, or at most, a financial issue to be contended with in the U.S., with concerns of equity largely invisible in the mainstream. It is in that context that I interpreted my research Baltimore, and within which I formulated the question that is discussed further in this thesis.
Chapter I: Introduction Two weeks before Freddie Gray’s arrest, the Baltimore Sun ran a headline that received little to no national attention: “Baltimore to send water turn-off notices to 25,000 delinquent customers” (Broadwater 2015a) The few who took notice outside of Baltimore were those who had fought a similar issue in Detroit a year earlier. In reality, shut offs, or disconnections, are a common utility practice to recover money from customers for unpaid bills. The indignation that followed this news in both Detroit and Baltimore had less to do with the existence of the practice, and more to do with perceptions of fairness around it, given the economic distress that both cities were in. But in Baltimore, economic distress would not be discussed until after Freddie Gray. Mark Levine, a historian and Professor of Urban Studies at the University of Wisconsin-Milwaukee, wrote an article in the aftermath of Freddie Gray’s death, claiming that it was a grim reminder of the racial inequality and socio-economic distress that remains “entrenched in America’s inner city neighborhoods” (Levine 2015). More than a decade earlier, Levine had authored a chapter in a book on the social sustainability of cities
of “The Wire” aired on HBO and catapulted the “boarded up, post-apocalyptic neighborhoods” of Baltimore into the homes and imaginations of millions of Americans, Levine’s chapter explored Baltimore’s dynamic history as both a “renaissance” city, and an “underclass city,” and the policies and changes that led to both designations. The title for his chapter was inspired by a 1994 USAID Program called “Lessons without Borders” which aimed to bring ‘Third World’ development techniques to American inner cities, which were facing major social and economic stress. At that time, U.S. policy makers drew parallels between Baltimore’s social conditions, and the conditions of those in developing countries. Indicators for social conditions included drug addiction, of which 9% of Baltimore’s population was suffering in 1996, high infant mortality rates, with Baltimore ranking third in the U.S., and high crime rates, for which Baltimore was the second highest amongst the nation’s largest cities (Levine 2000). Fifteen years after his book, Levine claimed that the causes of the social conditions he had written about back in 2000 had still not been successfully reversed. In a way, he was unsurprised, as any city would struggle to reverse decades of economic decline, suburbanization, and racial segregation. In terms of economic decline, since the 1970’s, the city has lost over 80,000 jobs, which is over one-fifth of its employment base (Levine 2015). Deindustrialization has led to the disappearance of manufacturing jobs, like those offered by Bethlehem Steel, a plant that at its peak, offered 35,000 jobs to city residents. By comparison, the total number of factory jobs in the city today is 11,000. Although jobs in downtown Baltimore have increased, the majority of these jobs have gone to suburban
commuters. Meanwhile, employment in city neighborhoods has declined by almost 50% since 1970 (Levine 2015). The commuters that have taken many of the newer, higher skilled jobs in the city, have benefited from decades of suburbanization that aided in eroding the city’s financial base. After 1950, the city’s population declined continuously, falling over 30% below its peak by 1997. Population in the suburbs grew from just below 400,000 in 1950 to over 1.8 million in 1997 (Levine 2000). The process of suburbanization, largely driven by departure of white residents, also known as ‘white flight,’ impacted the racial composition of the city dramatically. Baltimore was a black-majority city by 1970, and by 1997, two-thirds of the population was black (Levine 2000), which is how it has remained until today (“Data & Demographics” 2016). Indicators demonstrate a disproportionate impact of economic distress on black residents of the city, as 44% of black male residents between the ages of 25-54 remain unemployed. Given the city’s history with red-lining and housing segregation, poverty and unemployment remain spatially concentrated within particular neighborhoods (Levine 2015). In a way, the public image cultivated through statistics like these has made Baltimore a poster child for the country’s racial tensions, with little understanding about the conditions that people live in, and even less discussion of the institutional mechanisms that have led to such issues. This disconnect between the spectacle of violence and the causes of distress has allowed city
This disconnect is reflected in the types of language used by public officials and advocates, with the former justifying practices like disconnections, by saying that customers need to pay their “fair share,” and the latter arguing that economically distressed cities have large swaths of people who cannot afford to pay, and do not deserve to be penalized for this inability (Broadwater 2015a). While legal rulings can bridge divides, a study in response to the Detroit shut offs found that access to safe and affordable water currently fell short of a constitutional right in the United States, but could be legislated and protected under the right to life in the future (Murthy 2016). Neither state nor federal legislatures seem to be moving in that direction. In the absence of such legislation, the problem of affordability and access to water can become a negotiation between local governments that provide water, and those who use it and pay for it. Local governments in turn, look to utilities who operate and manage the highly technical systems that provide water to the public. Although negotiations around water have taken place between the public and the government in the past, the nature of the problem this time around presents challenges to the public’s ability to pursue the problem purely through avenues of negotiation between residents and the government. In older U.S. cities like Baltimore, systems that provide water and sanitation services were originally built in the late 1800s or early 1900s (Melosi 2000; Boone 2003). Since then, contemporary negotiations around water in the United States primarily concerned quality, spurred by public health concerns over the pollution of public water bodies due to the
dumping of growing industrial waste. Conversations around quality of water in the 60s and 70s led to the passage of legislation like the Clean Water Act and the Safe Drinking Water Act. With mandates from above, engineers turned to their specializations and developed technologies that could treat water to the degree that was mandated. In the late 90s and early 2000s, the public and the government deliberated yet again over the quality of water, when cases of lead exposure came to light (Melosi 2000; Edwards, Triantafyllidou, and Best 2009). Even the most recent case of negotiation in Flint, Michigan, was over the quality of drinking water that people were receiving in their pipes (Butler, Scammell, and Benson 2016). Although problems of quality can be connected to problems of aging infrastructure, the nature of the problem in Baltimore and Detroit is different because quality of drinking water does not come into the picture at all. Instead, the conversation is purely around lack of access to drinking water, driven by financial pressures that have been passed down from the utility to the customer. In other words, the negotiation is not about level of toxin exposure or treatment that would reduce public health hazards, but rather the level of water rates and source of capital payments for aging infrastructure and increasingly stringent regulatory requirements, in a context of larger economic distress at the household and city level, like Baltimore, where 23% of the population fall below the poverty level (“Data & Demographics” 2016).
economic literature which justify user fees in exchange for benefits, such as water and sanitation services. Furthermore, many operators argue that water and wastewater rates have been historically lower than necessary, which has increased the existing gap between capital needs and sources of revenue. What Baltimore and Detroit demonstrate, however, is that certain portions of the population might be more vulnerable to rising rates and deteriorating infrastructure. And when economically distressed and historically marginalized communities face increasing financial pressure over “constitutive” or basic rights, it leads to suspicions regarding whose interests are ultimately being served or prioritized. The question of interests is further amplified with financial experts looking to fill the infrastructure gap with private sources of capital. Interest of private capital in infrastructure can be seen everywhere from financial consultant reports, to investment portfolios. Deloitte has released a report on the role of public-private partnerships (Eggers and Dovey n.d.). Citibank sponsored a report on the wealth of public assets (Boyle 2018). Goldman Sachs, Morgan Stanley, and Black Rock have established infrastructure funds, backed by investors that include the likes of Saudi Arabia (Merle 2017). Finally, the recently released federal infrastructure plan supports these calls and strategies for private participation (The White House 2018). This transition to international infrastructure capital, supports the splintering of metropolitan areas and is very likely to exacerbate uneven development of urban
infrastructure, or increase underinvestment and neglect of marginal populations (Graham and Marvin 2001). Furthermore, some argue that the nature and scale of financialization make it a deeply undemocratic practice, which the water sector needs to address before contemplating the use of new, seemingly easier sources of capital (Ahlers and Merme 2016). Finally, prior experiences in the solid waste and water sectors continue to draw concerns regarding cost inefficiencies of private capital (Bel and Warner 2008). Despite the debates, financial struggles remain a reality for both utilities and customers. Problem Statement Rather than trying to identify which sources of capital would be most equitable, or calculate what levels of payment are truly affordable, this thesis asks the question of whether processes of deliberation between the government and an increasingly distrustful public might serve a role in answering these questions. The ultimate goal is to meet the financial and physical needs of water and wastewater utilities, while also addressing issues of equity, but the focus on deliberation places an emphasis on the process, in the hopes that it leads to both desired outcomes. The rest of this chapter provides an overview of the ideal of deliberative democracy, and both classic and reformulated methods of deliberation that work towards the ideal. I then move on to discuss the history of Baltimore’s water and wastewater systems, to demonstrate how deliberation due to equity concerns and diverging political and fiscal
The next chapter, chapter II, presents a financial overview of Baltimore’s Department of Public Works (DPW). It analyzes DPW’s current financial performance, the sources of its revenue, and the drivers behind its increasing costs. Chapter III begins to look at DPW’s response to increasing financial pressure, and the ways in which that pressure is passed on to customers. Chapter IV evaluates resident, advocate, and local government responses to increasing financial pressures, and demonstrates growing distrust between citizens and the government. Chapter V looks at potentialities for improvement by analyzing the redemption of another city utility in the region: DC Water. DC Water used deliberative mechanisms like transparency and accountability as a way to package recommendations for the utility, and I explore the implications of this approach for Baltimore and for future research aiming to resolve the water infrastructure crisis in American cities. Deliberative Democracy While deliberation can be broadly defined as communication that uses non coercive methods to reflect on preferences and interests, democratic deliberation involves a decision binding on the participants, and those who the participants represent. All democratic deliberation aims to “inspire transformations in the direction of the common good” (Mansbridge et al. 2010). In the classic ideal, deliberation is based on reason and the authority of the better argument about a common concern. However, this excludes self-interest and all forms of negotiation. Contemporary theory moves away from deliberation based purely on reason, to deliberation based on mutual justification which opens the door for storytelling or other forms of “non-cognitive evocations of meaning and symbols” to appeal to shared experiences (Mansbridge et al. 2010). Not all deliberation attempts to end
in consensus, but rather aims to structure and clarify conflict well, such that participants can end with non-deliberative democratic mechanisms. Mansbridge et a. (2010) argue that the reformulation of democratic deliberative ideal should include non-coercive forms of negotiation. They also argue that some non-deliberative mechanisms that employ coercive power are necessary to democracy as long as they can withstand deliberative scrutiny. Voting is an example of this. Although voting is defined as a use of coercive power, it is justified because it makes self-government possible, but in the democratic ideal, each vote must be equal. There cannot be vote-buying through money or an exchange of goods and services to specific individuals. Still, there can be cases where the use of a coercive power like voting is less justified. For instance, in a context where a society is deeply segmented, and important issues cluster together, the minority on one issue is likely to be the minority on another issue. In such cases of “permanent minorities,” majority-rule voting is less fair than other forms of decision-making that generate more proportional outcomes. For Mansbridge, forms of deliberation lie on the following spectrum: 1) Convergence: Deliberation concludes with participants agreeing on a single
interest. Deliberation to convergence often generates mutual respect, trust, collective agency, satisfaction, and goodwill 2) Incompletely theorized agreements: Originates with conflicting agreements but ends with participants agreeing on the same outcome for different reasons. 3) Integrative negotiation: Similar to incompletely theorized agreements in that they originate with conflict and end with one outcome for different reasons, but in this case, differences are out of self-interest, including material interest. 4) Fully cooperative distributive negotiation: Originates with conflict and parties reach an agreement by giving up part of what they wanted, after deliberation on conflicting interests and principles of fairness. Finally, the reformulation of deliberative theory underlies the importance of identifying self-interest in deliberative conversations, with the understanding that if self-interest is not part of the process, the group will likely adopt a version of the common good that does not take everyone’s interests into account and misrepresents what’s really at stake. When dealing with concerns of human rights, expression of self-interest should serve as information, rather than justification (Mansbridge et al. 2010). Using these ideas of deliberative democracy, the rest of this thesis analyzes the role of deliberation in solving Baltimore’s modern day water crisis.
Methodology This thesis analyses Baltimore’s water crisis through the lens of the city government, the utility that it operates, and the people that it serves. Federal and state interventions in the city are considered where relevant, especially in terms of financial assistance. However, absolute numbers of financial assistance in the forms of loans and grants are challenging to determine, given that the only source for this information would be Maryland’s state audits which are thousands of pages in length each year. While state-specific information is fragmented and difficult to determine, the Congressional Budget Office (CBO) provides data on federal contributions to water and wastewater infrastructure, which is presented to provide context for the city’s finances. The majority of the analysis to determine the city’s financial condition is sourced from the city’s own financial documents that are all publicly available, including: • City of Baltimore Comprehensive Annual Financial Reports (CAFR) (2013 – 2017) • DPW Annual Reports (2014 – 2017) • City of Baltimore Open Budget It should be noted that while the City of Baltimore’s Department of Audits produces individual audits for the water utility fund and the wastewater utility fund, the type of information produced by these reports closely matched the city CAFRs. City CAFRs were chosen for the analysis because they also provide financial information for the stormwater
The period of time for which the analysis was done, includes the last five years. Five year increments are suggested by the University of North Carolina’s Environmental Finance Center (UNC EFC), which provides tools to help researchers and officials study the financial health of their utilities. Since the shutoff problem reached its peak in 2015, the period of 2013-2017 gives an overview of the condition prior to, and following the crisis. The financial analysis provides evidence for the utility’s increasing financial struggles, after which the thesis turns to look at the utility’s response to financial pressures, including what had been made public through the shutoff crisis. I combined the research that I had begun under MIT’s American Water Shutoffs project, with additional research that I conducted on my own based on what I had learnt from a conversation with Kim Grove, DPW’s Chief Compliance Officer. Ms. Grove indicated that the utility had reformed their planning processes, and was continuing to look for alternative sources of capital, to ease the burden on ratepayers. In light of that information, I present and analyze the following: • DPW’s new “Integrated Planning Framework,” based on a paper published by DPW Director Rudy Chow. • DPW’s lobbying efforts at the federal level, based on transcripts of Rudy Chow’s testimony provided at a Senate Hearing on Water Affordability in 2016 • DPW’s rate increases, based on Board of Estimates Meeting Minutes which are available online, starting from 2010, and billing data from a public information request.
• DPW’s collection efforts, based on responses to a public information request submitted on behalf of the MIT American Water Shutoffs projects in January 2018. The public information request and its response are attached as appendices to this thesis. Data was requested for the period between 2012 and 2017, to understand any trends prior to, and after, the publicized shut-offs in 2015. The third chapter discusses limitations of this data at length, particularly data regarding DPW’s collection processes. Ideally, the data would have revealed how much money DPW recoups through both processes, and how many people are impacted by these efforts. Where DPW made data available, such as numbers of properties impacted by tax sales due to unpaid water bills, these numbers were compared to the total number of annual tax sales conducted by the city in order to understand the scale of DPW’s actions in comparison to the city as a whole. Total tax sale data was collected from BidBaltimore, which is a public auction site where certificates are placed for sale. While this website provides information on the value and address of each individual certificate that is placed for sale, it does not indicate what the total value of the certificate is made up of i.e. whether the value is due to property tax debt or water debt. Because of this, it is impossible to know the number of properties that are listed for tax sale due to water bills only. The difference between the number of properties that are listed, as seen by BidBaltimore data, versus sold, as provided by DPW, offers an idea of how much the city collects from home-owners before properties are sold to investors, and how many residents are displaced due to inability to pay. The numbers that DPW provides represent
Because data is scarce, validating the data proves difficult. To ensure that I understood the tax sale data properly, I spoke with Margaret Henn, a pro-bono attorney in Baltimore, and Michael O’Leary, the Tax Sales Coordinator for the Department of Housing. To understand the shut off process, I relied on the Abel Foundation’s report titled “Keeping the Water On” and the Department’s internal standard operating procedures, which were acquired and shared by Food and Water Watch. While the Baltimore Sun has occasionally reported numbers on shut offs, particularly during 2015, data received directly from DPW was considered more valid than estimates in the news. The second half of this thesis focuses on understanding how citizens, advocates and city officials view DPW’s responses to rising financial pressures. Transcripts and videos from the Baltimore City Council Hearing in October 2016, and the Board of Estimates Hearing in August 2016 provided access to testimony from 41 members of the public. Of this group, 10 people represented some type of advocacy organization, while the rest are residents of the city. Recognizing the limits of public hearing testimony, this thesis does not argue that this information alone provides a complete picture of resident opinion throughout the city, but rather, that public testimony is an opportunity to highlight some of the causes behind discontent between the public and DPW. Since members of DPW were present at both of these hearings, they also provide an opportunity to understand how DPW responds to citizen concerns.
Ideally, this information would be coupled with interviews that are conducted on the ground, outside of the public hearings, to understand citizen motivations for appearing and publicly testifying. Unfortunately, due to limited time, this was outside the scope of this thesis, but should be considered in the methodology for future research. Furthermore, the thesis lacks interviews with DPW’s director and members of the executive team. Although I made efforts to contact them via email and phone call, I did not receive a response. Interviews with utility officials would have shed important light on how the utility perceives their relationship with customers, and whether they are attempting to address citizen concerns regarding affordability and other issues. While I could not conduct interviews with residents for this thesis, I was able to speak with advocates and city officials. Roger Colton, a consultant who has worked with Food and Water Watch (FWW) connected me to FWW advocates on the ground in Baltimore who further recommended that I speak with Councilman Bill Henry and State Delegate Mary Washington. Outside of these recommendations, I was also able to speak with Councilman Zeke Cohen, who provided a different opinion on the water crisis, since he was newly elected to the city council and had not been involved as long as Councilman Henry who has been active in Baltimore’s civic affairs for over twenty years.
Again, since the methodology for these interviews was more exploratory, the thesis does not argue that these are the only opinions or perceptions that exist, but rather strives to understand why each of these individuals has the opinions that they do. The final chapter of this thesis presents a short case of a neighboring utility, DC Water, to provide some context for DPW’s performance. Information on DC Water was obtained entirely through documentation that DC Water makes available online. The documents that were chosen for analysis include meeting minutes from committee meetings within the utility that discuss issues of customer affordability and customer service since 2009. Future research could expand on this case by looking more closely at how DC Water customers perceive the utility’s actions. Overall, the methodology for this thesis has been a combination of exploring qualitative and quantitative data to understand how DPW came to be in its current position of financial hardship, and how that hardship has been impacting customers, such that recommendations could be devised around making the relationship between DPW and the residents of Baltimore collaborative rather than confrontational.
Chapter II: The Origins of Baltimore’s Water and Wastewater Systems While the history of water and wastewater infrastructure in Baltimore is not altogether dissimilar from the overall national experience, understanding the political justifications and decisions that led to the city’s current predicament requires an overview of the city’s particular historical experiences with financing and building the networks that exist today, and how citizens played a role in that history. Since the beginning of its incorporation, the city has had to deal with political, economic, and financial issues that pose barriers to the implementation of basic service provision. Matthew Crenson’s recent book, “Baltimore – A Political History,” traces this history clearly, starting with issues of water supply in the late 1700s. Starting with its incorporation in 1796, the Baltimore city council formed a committee to contend with water shortages and supply in the city. Although a technically feasible solution existed, the city ran into legal hurdles because it lacked the power of eminent domain, and property owners did not provide permission to lay water pipes on private property. As the issue was lobbied back and forth between city council and the Mayor, private citizens with an interest in solving the issue gathered at a public meeting to devise a solution. The outcome of this meeting was a joint stock company in the water business with “local notables” serving on the board of directors. In 1804, they began receiving subscriptions for stock in the newly formed Baltimore Water Company (Crenson 2017).
At this time, water was not the only public service that was being provided through private means. The city relied on volunteer fire fighters and private hospitals to supply other critical public needs. Crenson (2017) suggests that in general, the city avoided large-scale, long-term public investments, due to a driving belief of dealing with “present necessities” first. After a while however, the Baltimore Water Company demonstrated the shortcomings of private enterprise in the water business, extending service only to those who could afford to pay. While the city’s population was close to 80,000 in 1825, only 1,640 households paid for water. In addition, the Company acted negligently by failing to meet agreed upon conditions with the city, such as re-paving streets after laying pipes. Around 1835, the City considered buying the company to solve its problems, but the Mayor worried that the city’s large stock debt due to railroad investments did not allow it to take on any more financial burden. In took another two decades before the city bought the Baltimore Water Company in 1854, adding $1.35 million to its municipal debt (Crenson 2017). Once the company was bought out, the city faced the task of overcoming its deficiencies against increasing public discontent. Citizens designed a petition and collected 1,300 signatures complaining about “the long delay on the part of the city authorities to obey the people of Baltimore to introduce an addition supply of Water into the city.” With this public push, the water board submitted requests to sell more municipal stock in order to finance the purchase of land and water rights needed to increase water supply (Crenson 2017).
The question of sewers and sanitation also arose due to issues with water supply. As the population grew and the city contended with consecutive summer droughts between 1860 and 1870, there was no longer “sufficient” water to flush out gutters into the docks and harbor as was previously practiced, leading to pungent stenches and odors (Crenson 2017). While some Baltimoreans had the vision of creating a citywide sewer system, Baltimore lacked the political integration necessary to build it, relying instead on partial solutions at the neighborhood scale. The debate on sewers was largely around whether to dump untreated sewage into the Chesapeake Bay, or to filter the sewage through sandy soils in neighboring Anne Arundel County. The former plan was cheaper, but many believed that it would harm the oyster beds in the Bay, and cause other public health concerns. While the majority of members on the city council were ready to follow the sewer commission’s suggestion of dumping the waste in the bay, public outcry forced them to reconsider, but instead of forging an alternate path, little progress was made to change the status quo. Although the city received an offer from a private company to finance and construct a sewer system in 1899, Baltimoreans swiftly opposed the plan based on the experience they had had with private infrastructure in the past, particularly streetcars and water, and it eventually came to end due to a procedural mistake (Boone 2003). By 1900, although every other big city already had a sewer system, Baltimore still relied on cesspools and neighborhood sewers. While the arrival of “reform boss” Mayor Hayes in 1901 indicated potential progress as the city came together to promote one plan (Crenson
writes, “Baltimore was again the victim of party politics conducted in a city far from its boundaries, a source of frustration for citizens and city leaders” (Boone 2003, 162). It took a devastating fire in 1904 to bring all players into alignment, as the city’s outlook on large, comprehensive works changed. In 1911, the State General Assembly permitted the city to borrow $13 million to complete a comprehensive system with treatment of wastes before dumping into the Chesapeake. The fire not only rallied citizens around a common cause to rebuild the city better, but also that property assessments increased after the fire, allowing municipal debt to be paid off by the time expenditures would be highest for sewer construction (Boone 2003). The political history of both the water and the sewer system did not end with the initial build out. The systems required continual work, sometimes related to expansion, and oftentimes related to improving the quality of the water source. For instance, in the 1920s, Mayor Broening took on the task of raising money to pay for an extension of the water system by winning voter approval for four bond issues. He ran a promotional campaign that included a parade of 10,000 adults and schoolchildren in support of the bonds and previews of films at local theaters in silent support after which the loans were overwhelmingly approved (Crenson 2017). Beyond occasional extensions however, infrastructure did not present a major challenge again until urbanization patterns began to change between 1945 and 1970, and then fiscal crises exacerbated issues with infrastructure maintenance and replacement (Melosi 2000).
The next section goes beyond Baltimore, to describe how these national trends impacted water and wastewater utility systems everywhere. A Brief History of “Crisis” The historian Martin Melosi argues that the period between 1945-1970 saw a new kind of “water crisis in an effluent society,” whereby systems began to demonstrate signs of decline, water usage increased with the availability of new appliances like washing machines and dishwashers in many middle-class homes, and urban expansion meant the simultaneous expansion of water systems, and therefore an increase in expenditures yet again. The value of constructing new water systems increased nationally from $97 million in 1945 to $3 billion in 19681. Meanwhile, expenditures for water revenues began outstripping revenues (Melosi 2000). Distribution of water supply contributed significantly to the problem, because water facilities were located in central cities but had to start serving larger metropolitan areas or outlying suburban communities which grew most significantly during this period. Costs of extension were often high because of lower population densities, and users in the suburbs had to be charged more to cover costs. City officials argued that raising sewer rates in the suburbs was justified because core residents had borne the initial costs of building the system (Melosi 2000).
An interesting twist in this history occurred when, in 1970, HUD began offering water and sewer grants to communities that were willing to accept subsidized housing, in response to allegations of segregated residential patterns in several cities. However, suburbs showed little interest in the program because the grants carried “disagreeable conditions” (Melosi 2000). While Melosi does not delve further into these conditions, Lamb (2005) describes this intersection of racial dynamics and infrastructure provision in greater detail. In a discussion on the general opposition to suburban integration in post 1960 America, Lamb describes how the Housing and Urban Development Act of 1970 was actually amended such that HUD could not withhold funds for water and sewer provision from suburbs refusing to provide low and middle-income housing (Lamb 2005). Concerns of equity persisted in other ways as well, as demonstrated by a notable lawsuit in 1971: Hawkins v. Shaw. In the lawsuit, black citizens of Shaw, Mississippi, brought evidence which demonstrated discrimination in public service provision, particularly water and sewer service. Their evidence rested on two facts: lack of sewer service for 20% of black families versus 1% of white families, and smaller sized water mains in black neighborhoods versus white neighborhoods (1.25 versus 6 inches). The second fact contributed to a number of consequences including low water pressure, and therefore higher fire insurance because water to fight fires was not readily available. Although dismissed initially, the Appeals court ruled in favor of the citizens, claiming that there was no “rational” explanation for the outcome (Melosi 2000; Troesken 2004).
In addition to issues with expanding and replacing distribution systems, there were also concerns over water quality and pollution, leading to the Water Pollution Control Act in 1948, and eventually, the Water Quality Act in 1965. In 1968, the Federal Water Pollution Control Administration estimated that it would cost more than $23 billion to build and maintain waste-treatment facilities. The growing environmental movement led to the establishment of a new federal agency, the Environmental Protection Agency (EPA) and the disbursement of more federal funding. Even with a significant increase in federal aid through grants, there was still a significant gap, especially for older cities, as most funds were expended in communities with less than 25,000 in population (Melosi 2000). With growing complexity in metropolitan growth, deepening urban fiscal problems, and environmental concerns, the 1980s saw the rise of another looming “infrastructure crisis.” Fiscal problems facing cities, were in many cases structural. Federal and state governments mandated that cities perform a wide array of functions, while concentration of poor people at the core raised the cost of providing many public services because of increasing and competing costs of public welfare, health care and hospitals, and decreasing general revenue sources with the continuation of white flight. Also, because core cities were older than suburbs, the cost of maintaining or replacing existing infrastructure was higher. City residents also had to finance services that benefited non-residents, especially commuters
Cities began to rely more heavily on federal aid. The Housing and Community Development Act of 1974 consolidated several programs including urban renewal and water and sewer facilities into single block grants, allows local official discretion in spending federal money. However, most of this aid ended up being sent to suburban jurisdictions who qualified for revenue sharing with cities due to mechanisms like special district administrations, deepening the schism between suburbs and central cities (Melosi 2000). By the 80s however, Reagan’s incoming federal administration significantly cut federal aid to cities. This was the same time that a book “America in Ruins: The Decaying Infrastructure,” ignited a wide-scale debate over the nation’s public works and future needs. Federal studies followed, the first of which indicated that America’s infrastructure suffered from “disinvestment” in basic public facilities ranging from $500 million to $3 trillion. Later studies refined these projections, claiming that infrastructure problems were both “specific and localized,” but that the general trend was that many systems were in significant disrepair and that the task ahead was formidable but not impossible, if appropriate funds could be identified (Melosi 2000). While local conditions impacted the operation and performance of water supply systems, water issues tended to be defined in technical terms by experts “operating in all allegedly apolitical agencies that faced little public review.” Melosi (2000) attributes this to rising urban service professionalism, including within the area of civil and environmental engineering. The belief that water and wastewater infrastructure problems were purely technical, lead to mainstream discussions of where to find new sources of finance to pay for
these technical issues. Yet, a study from 1984 presents evidence that reduced infrastructure spending infrastructure during the 70s and 80s was not only due to lack of availability of funds, but perhaps more-so a result of economic and budget decisions made by public officials and voters, who did not understand the consequences of deferring repairs to infrastructure systems (Peterson 1984). These arguments ring true today, more than ever, as utility operators and city officials lament the legacy of these public spending decisions, and argue for greater infrastructure spending on the justification that they can no longer kick the can down the road.
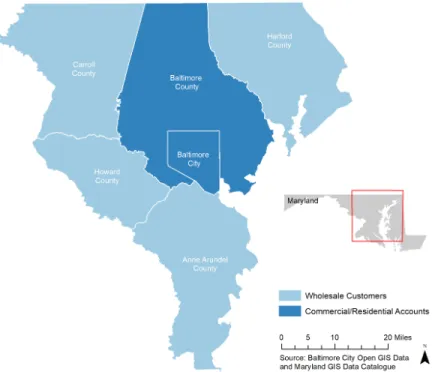
Chapter III: Building Financial Pressure Baltimore’s Department of Public Works: Present Day Due to the nature of municipalities and counties in Maryland, there are only two large water and wastewater operators in the state: The Baltimore Department of Public Works (DPW) and the Washington Suburban Sanitary Commission (WSSC). Both of these utilities serve approximately 1.8 million customers each in the larger DC-Baltimore metro region. WSSC’s customers live in the two counties that border Washington D.C: Montgomery County, and Prince George’s County. Baltimore’s Department of Public Works serves customers in Baltimore City and Baltimore County, in addition to selling wholesale water to four other counties (see Figure 1 below). Figure 1: Baltimore Department of Public Works Service Area
Over the course of its history, the utility has undergone multiple permutations as responsibilities have been added and removed from its original charter. Although established in 1925 as the Department of Public Works, the present administrative structure of this Department was actually formed in 1968, when it was divided into functional bureaus (“Baltimore City Archives (Department of Public Works) 1794-1977 BRG47” n.d.). Today, the Department consists of two bureaus: The Bureau of Water and Wastewater, and the Bureau of Solid Waste. The bureaus are DPW’s service providers; providing the drinking water, providing the trash collection, and providing wastewater collection and treatment. In 2014, the department underwent organizational changes such that, in addition to the two bureaus, cross-functional offices were set up to report directly to the DPW director. These included Asset Management, Engineering and Construction, and Compliance and Laboratories. DPW also created the office of Fiscal Management in the latter part of 2015 to provide oversight of DPW’s revenue and expenditures. This office is in charge of DPW’s operating and capital budgets, rates and financial forecasting, capital project financing, and procurement and inter-jurisdictional cost-sharing agreements. Prior to 2015, DPW administration, Water and Wastewater, and Solid Waste each had their own office of fiscal management (DPW 2015a, 2016a).
Harford Counties. The water utility treats over 360 million gallons of water per day through three water filtration plants (Montebello I and II, and Ashburton), and distributes it to about 1.8 million people. The utility also manages three raw-water reservoirs: Liberty, Lock Raven, and Pretty Boy, which, when full, cumulatively contain about 80 billion gallons of water (DPW 2015f). DPW also manages two wastewater treatment plants: Back River Wastewater Treatment Plant, and Patapsco Wastewater Treatment Plant (DPW 2015d). In addition to treatment and storage facilities, the Bureau of water and wastewater also maintains a vast distribution network of pipelines that includes approximately 4500 miles of water mains, and 3100 miles of sewer mains (DPW 2015e, 2015d). DPW Budget The Department’s annual budget is divided into operating and capital costs. Operating costs support day to day activities, and include administrative costs, while the capital budget is meant to support expenses that relate to the construction or acquisition of new assets. The graph below provides a look at the whole Department’s approved budget over the last five years, including both Bureaus. Overall, DPW’s budget has decreased, mainly due to decreases in the capital budget.
Figure 2: DPW Annual Budget FY2014 – FY 2017 (DPW 2015a, 2016a, 2017a, 2018a) According to the City of Baltimore’s Budget, DPW’s operating budget takes up the largest share of the overall city operating budget, about 20% out of $2.76 billion, followed closely by the operating budget for the Baltimore Police Department (about 17%) (Office of Mayor 2017). Enterprise Funds Services provided by the Bureau of Solid Waste are supported by the City’s General Fund, whereas the Bureau of Water and Wastewater is supported by three enterprise funds. This was the result of a Charter amendment approved by voters in November 1978. In Article $0 $200 $400 $600 $800 $1,000 $1,200 $1,400 $1,600
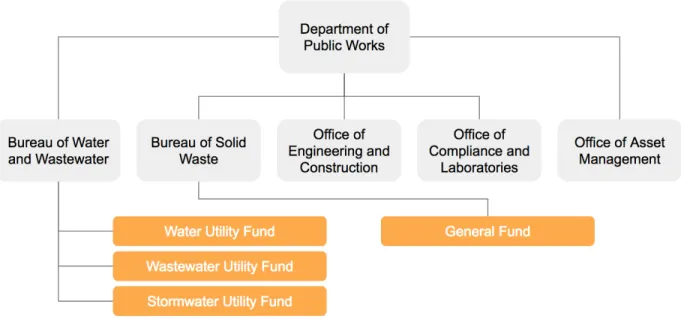
FY2014 FY2015 FY2016 FY2017
$2017 (M IL LI O N S) DPW Annual Budget ($2017)
the other funds or programs of the City (“Rates & Fees Overview” 2015). The stormwater utility was added as a third enterprise fund more recently in 2014. Figure 3: DPW Organizational Structure and Enterprise Funds (Office of the Director 2018; “CAFR” 2017) The table below provides a breakdown of DPW’s operating budget between 2013 and 2017. The water and wastewater utility funds make up the largest share of the operating budget, while state and federal spending often make up less than one percent. Unfortunately, the City’s open budget website, from which the data below is obtained, does not provide a similar breakdown of funds for the Department’s annual capital budget.
Table 1: Percentage of Contribution DPW’s Operating Budget by Fund (Office of Mayor 2017) 2013 2014 2015 2016 2017 Water Utility 38.1% 42.0% 43.5% 45.0% 44.5% Waste Water Utility 49.3% 49.3% 53.8% 58.2% 61.6% Stormwater Utility 0% 5.7% 4.3% 5.0% 5.3% State 0% 3.9% 3.4% 0.6% 0.2% Federal 0.4% 0.8% 0.8% 0.9% 0.4% Special 0% 0% 0.2% 1.4% 0.1% Internal Service 0.4% 0.5% 0.6% 0.6% 0.6% General Fund 18.7% 16.3% 17.2% 18.4% 18.7% User Fees Since the City’s water, wastewater, and stormwater funds are set up as enterprises, or “business type activities,” charges for services (also known as user fees), represent the principal revenue source for the funds. Payment DPW collects fees from its customers in Baltimore City and Baltimore County. Although DPW provides services to other counties, it does not handle the collection of fees from individual accounts within those counties. Instead, the Department receives lump-sum amounts from County governments based on inter-jurisdictional agreements for the amount each county will be charged, based on the amount of services provided.
and establishes that all charges (including fees, interest, and penalties) shall be a lien upon the property of an owner, and recorded in the Tax Lien Records (“Baltimore City Code Article 24” n.d.). Although cities like New York, Philadelphia, and Detroit also place water and sewer bills under property liens, it is unclear whether these cities allow properties to enter into tax sale processes for unpaid water bills only, which is a practice that Baltimore has utilized for many years (Cwiek n.d.; “Overview of the Sheriff Sale Process” n.d.; “Tax Lien Sale NYC: What Homeowners Need to Know” 2018). The challenges created by this process are described further in detail in chapter three. Billing and Collection DPW is in charge of sending out bills to individual accounts, and the Department of Finance is in charge of collecting bills for water used, or work done by DPW. According to City Code, all bills have to be paid 20 days after they have been issued, and in the case of default, DPW may cut off water supply to a customer. Internal standard operating procedures differ slightly from the Code, indicating that DPW considers an account “delinquent” and eligible for shut off if a water charge remains unpaid for more than 30 days, and is greater than $250 (DPW 2015b). Delinquent bills also begin to accrue penalty charges, at a rate of 1.64% of the service charge, and are forwarded as “arrearages” on subsequent bills. Even if a customer misses
one payment, but pays all subsequent payments, arrearages can count as sufficient reason for discontinuing or shutting off water service (“Baltimore City Code Article 24” n.d.). Rate Setting and Increases The Board of Estimates (BOE) is the governing body that establishes, assesses, and changes the rates and charges for water and wastewater services, based on the recommendations of the Director of Finance and the Director of Public Works (“Baltimore City Code Article 24” n.d.). According to the city’s Comprehensive Annual Financial Reports, the BOE is the highest level decision making authority, in charge of formulating and executing all fiscal policy for the city, including awarding contracts, and supervising all purchasing by the City. It consists of five voting members: The Mayor, President of the City Council, the Comptroller, the City Solicitor, and the Director of Public Works. The President of the City Council serves as the President of the Board, and the Comptroller serves as Secretary (“Board of Estimates” 2015). Each year, the Board adopts an Ordinance of Estimates, and presents it to the city council. The Ordinance of Estimates includes any changes to water and wastewater rates, among other fiscal decisions. At least 30 days prior to the adoption of any ordinance, a public notice period is required, during which City Council members and the public can make recommendations regarding the proposed changes (“Baltimore City Code Article 24” n.d.).
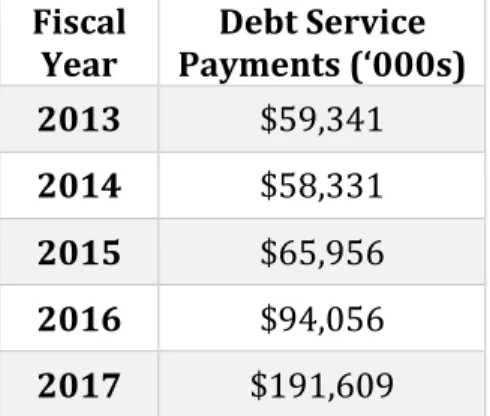
Revenues Versus Expenses As seen in the graph below, collected user fees have been covering the department’s annual expenses, and meeting the mandate for all three utility funds to be “self-sufficient.” Figure 4: DPW Expenses and Charges from FY2012 – FY 2017 2 (“CAFR” 2012-2017) However, given that user fees are being set to cover all expenses, it is important to recognize the breakdown of these costs and how they have been changing. Expenses can be broken down into operating expenses, and debt-service, where debt-service consists of principal and interest payments on long-term debt. The table below shows how DPW’s debt service payments have increased significantly since 2013. 2 Charges include revenue from capital grants and contributions. Expenses are not broken down by category and are assumed to include expenses for capital outlays and debt. 0 50 100 150 200 250 300 350 400 450 500 2012 2013 2014 2015 2016 2017 $2017 (M IL LI O N S) DPW Expenses and Charges Expenses Charges
Table 2: DPW Debt Service Payments for FY2013- FY2017 (“CAFR” 2013-2017)
Fiscal
Year Payments (‘000s) Debt Service
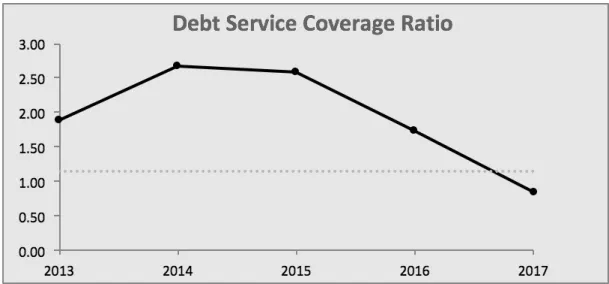
2013 $59,341 2014 $58,331 2015 $65,956 2016 $94,056 2017 $191,609 The debt-service coverage ratio (DSCR) serves as a useful indicator to understand whether a system is able to cover its debt-service after paying off its day-to-day operations. The ratio compares the relative magnitude of net revenues (after paying operating expenses) to debt service payments. So in Baltimore’s case, even though the department has been able to cover both expenses, a closer look at these expenses over the last five years shows a declining DSCR, or in other words, demonstrates that a higher percentage of revenues is being directed towards paying off long-term debt.
Figure 5: DPW’s Debt Service Coverage Ratio for FY2013 – FY20173 (“CAFR” 2013-2017) During a conversation with Kim Grove, the Chief Compliance Officer at DPW, she mentioned the challenge that this poses on the utility, since directing revenue towards debt-service implies that the utility is unable to use revenue for new investments, and has to continue taking out loans, further entrenching the agency’s reliance on long-term debt. Baltimore’s increasing reliance on debt is similar to the condition of many other public water and wastewater utilities in the country, and is a result of both increasing costs, and changes in federal and state funding. The history of both of these is discussed in the following sections. 3 This graph originated from a Financial Health Tool provided by the UNC Environmental Finance Center to assess the financial condition of a water system. The inputs for this calculation are from the City’s CAFRs, specifically from the Statement of Net Position, Changes in Net Position, and Cash Flows. The dotted line in this graph represents a DSCR of 1.2, which many rate covenants state as the minimum requirement underlying the ability of an agency or a city to issue a bond. It is unclear why DPW’s DSCR is below 1 for 2017, given that Figure 4 shows that charges are greater than expenses. However, the numbers in figure 4 are from a different table within the CAFR. This table is a summary of business-type activities, which “are presented after adjustment to reflect the consolidation of internal service fund activities related to enterprise funds” (CAFR 2017, Pg. 10).