Publisher’s version / Version de l'éditeur:
Biochimica et Biophysica Acta, 1808, 11, pp. 2761-2771, 2011-11-01
READ THESE TERMS AND CONDITIONS CAREFULLY BEFORE USING THIS WEBSITE.
https://nrc-publications.canada.ca/eng/copyright
Vous avez des questions? Nous pouvons vous aider. Pour communiquer directement avec un auteur, consultez la première page de la revue dans laquelle son article a été publié afin de trouver ses coordonnées. Si vous n’arrivez pas à les repérer, communiquez avec nous à PublicationsArchive-ArchivesPublications@nrc-cnrc.gc.ca.
Questions? Contact the NRC Publications Archive team at
PublicationsArchive-ArchivesPublications@nrc-cnrc.gc.ca. If you wish to email the authors directly, please see the first page of the publication for their contact information.
NRC Publications Archive
Archives des publications du CNRC
This publication could be one of several versions: author’s original, accepted manuscript or the publisher’s version. / La version de cette publication peut être l’une des suivantes : la version prépublication de l’auteur, la version acceptée du manuscrit ou la version de l’éditeur.
For the publisher’s version, please access the DOI link below./ Pour consulter la version de l’éditeur, utilisez le lien DOI ci-dessous.
https://doi.org/10.1016/j.bbamem.2011.07.022
Access and use of this website and the material on it are subject to the Terms and Conditions set forth at
Fluid phase lipid areas and bilayer thicknesses of commonly used phosphatidylcholines as a function of temperature
Kučerka, Norbert; Nieh, Mu-Ping; Katsaras, John
https://publications-cnrc.canada.ca/fra/droits
L’accès à ce site Web et l’utilisation de son contenu sont assujettis aux conditions présentées dans le site LISEZ CES CONDITIONS ATTENTIVEMENT AVANT D’UTILISER CE SITE WEB.
NRC Publications Record / Notice d'Archives des publications de CNRC:
https://nrc-publications.canada.ca/eng/view/object/?id=004d8b25-948a-4490-9fc2-127b470c45ad https://publications-cnrc.canada.ca/fra/voir/objet/?id=004d8b25-948a-4490-9fc2-127b470c45ad
Fluid Phase Lipid Areas and Bilayer Thicknesses of Commonly Used
Phosphatidylcholines as a Function of Temperature
Norbert Kučerka,
†‡Mu-Ping Nieh,
#and John Katsaras
†§†Canadian Neutron Beam Centre, National Research Council, Chalk River, Ontario K0J 1J0,
Canada
‡Department of Physical Chemistry of Drugs, Faculty of Pharmacy, Comenius University,
Odbojárov 10, 832 32 Bratislava, Slovakia
#
Department of Chemical, Materials & Biomolecular Engineering, Institute of Materials Science, University of Connecticut, Storrs, Connecticut 06269, USA
§Neutron Scattering Science Division, Oak Ridge National Laboratory, Oak Ridge, Tennessee,
37831-6100, USA
Abstract
The structural parameters of fluid phase bilayers composed of phosphatidylcholines with fully saturated, mixed, and branched fatty acid chains, at several temperatures, have been determined by simultaneously analyzing small-angle neutron and X-ray scattering data. Bilayer parameters, such as area per lipid and overall bilayer thickness have been obtained in conjunction with intrabilayer structural parameters (e.g. hydrocarbon region thickness). The results have allowed us to assess the effect of temperature and hydrocarbon chain composition on bilayer structure. For example, we found that for all lipids there is, not surprisingly, an increase in fatty acid chain trans-gauche isomerization with increasing temperature. Moreover, this increase in trans-gauche
isomerization scales with fatty acid chain length in mixed chain lipids. However, in the case of lipids with saturated fatty acid chains, trans-gauche isomerization is increasingly tempered by attractive chain-chain van der Waals interactions with increasing chain length. Finally, our results confirm a strong dependence of lipid chain dynamics as a function of double bond position along fatty acid chains.
Introduction
Throughout the biological world cell membranes are crucial to life. In the case of animal cells the plasma membrane, which is composed predominantly of proteins and lipids, and separates the cytosol from the cell‟s extracellular environment, acts as a selective semi-permeable barrier. Membranes also surround the various cell organelles (e.g. mitochondria, endoplasmic reticulum, Golgi apparatus, etc.), thus enabling them to maintain their characteristic functions.
The transport of molecules and the chemical signaling processes taking place across the membrane‟s lipid bilayer are, for the most part, mediated by membrane proteins, while their function (i.e. proteins) is determined by the lipid bilayer‟s structural properties. It is now generally accepted that the function, insertion, orientation, and subcellular localization of integral membrane proteins are all affected by the membrane‟s physical properties [1]. An example is the relationship between the activity of integral membrane proteins, such as the sarcoplasmic reticulum Ca2+-transporting ATPase, and bilayer thickness [2]. In this case, enzymatic activity was found to be maximal in bilayers composed of medium length (18-carbon) hydrocarbon chain lipids, and decreased by as much as a factor of four, in both short- (14-carbon) and long-chain (22-carbon) lipid bilayers [3].
There are various definitions of lipid bilayer thickness given in the literature, many of which depend on the technique used to measure the thickness, and on the physical phenomenon being studied. For example, hydrophobic thickness (DC) is widely used in cases where the
function of an integral membrane protein is affected by hydrophobic mismatch [4]. This thickness is typically defined by the bilayer‟s hydrocarbon acyl chains, and is assumed to be free of water. On the other hand, some amount of water molecules (nW) is known to intercalate into
the lipid headgroup region [5]. The thickness associated with this region (DH) depends on
headgroup conformation, which can be affected by other parts of the bilayer [6], and/or thermodynamic conditions [7]. DH is also often arbitrarily defined in terms of steric thickness
[7-10].
Bilayer thickness can be conveniently determined by various X-ray and neutron scattering experiments – note however, that the two techniques are sensitive to different bilayer thicknesses. In neutron scattering the high contrast between the protonated lipid and the deuterated water defines the overall bilayer thickness (DB), also known as the Luzzati thickness
[11]. On the other hand, the thickness best resolved by X-ray scattering is the distance between the peaks in the electron density (ED) profile, which, for the most part, corresponds to the distance between the lipid headgroup phosphates (DHH). Even though they are the two most
robust experimentally determined parameters, DHH and DB cannot be directly compared to each
other, and neither provides all of the desired information regarding bilayer structure. Instead, models are used to determine the remaining bilayer structural parameters, in combination with experimental data.
Recently, the scattering density profile (SDP) model that simultaneously fits X-ray and neutron small-angle scattering data has permitted the robust determination of bilayer structural parameters [12]. Even though the primary information obtained from scattering experiments is
the various bilayer thicknesses, the SDP model associates them by a common structural quantity that is central to describing bilayer structure - as well as lipid-lipid and lipid-protein interactions - namely the area per lipid along the surface of the bilayer (A). All thicknesses are then related to A through volume considerations (e.g. A=2VL/DB=(VL-VHL)/DC=(VHL+nWVW)/DH, where VL is
the volume of a lipid molecule, VHL is the lipid headgroup volume, and VW is the volume of a
water molecule). It should be stressed that A is not easily determined for fluid lipid bilayers and is only obtainable if additional information is provided to constrain the many parameters that are required by any realistic model of a bilayer. It should also be emphasized that this is not a criticism for the use of models. On the contrary, the unique advantage of models is that information obtained from different experiments can be used to refine them [13]. For example, total lipid volume is accurately obtained by other techniques [14-16] and is used in our analysis in order to reduce the total number of variable parameters.
Accurately known lipid areas are crucial when assessing the intermolecular interactions taking place within biomembranes. For example, historically models describing the structure of the red blood cell membrane were derived from knowledge of the total area occupied by the membrane‟s lipids [17]. The complex structural dynamics found in membranes involve a balance of forces, where area is the product of these forces in the lateral direction (i.e. in-plane). In single component lipid bilayers water permeability has been shown to correlate most strongly with area/lipid, but not so well with bilayer thickness and the bilayer‟s other structural and mechanical properties [18]. As a result, a new model for how water permeates a lipid bilayer was proposed, whereby lipid area was the key determinant [19]. Furthermore, if protein function involves a conformational transition accompanied by a change in its cross-sectional area, it can be assumed that even small changes in membrane lateral pressure (i.e. change in lipid area) can induce significant conformational (i.e. function) changes to a protein [20].
In addition to playing a key role in describing membrane structure and function, knowledge of lateral lipid area is central to simulations [13]. Recent studies suggest that the force fields utilized in molecular dynamics (MD) simulations, however carefully determined may result in poor agreement with experiment when the simulations are performed at the ideal zero surface tension condition [21]. To counter this, an alternative approach is to carry out simulations at constant, but nonzero tension, or equivalently at a fixed surface area [13]. The question then becomes, what value should the area/lipid be fixed to? The inconsistencies in lipid areas have been highlighted by the disparate results arising from MD simulations utilizing different force fields. For example, MD simulations based on the CHARMM (Chemistry at HARvard Molecular Mechanics) potentials are performed at nonzero surface tension in order to make them “better agree” with X-ray scattering data [13], whereas simulations using a combination of GROMOS and OPLS (Optimized Potential for Liquid Simulations) potentials do not seem to require this additional „„tweaking‟‟ [22]. Since MD force fields are considered to be „„well tuned‟‟ if they are able to reproduce experimental data [23], it is obvious that more work is needed to reconcile simulation and experiment, even in the simplest case of single component membranes.
Due to its complexity, the physical properties and functional roles of individual lipid species in biomembranes are exceedingly difficult to ascertain in an intact membrane. In order to gain insight into the roles of individual components, it is necessary to study model membrane systems that contain the lipid species of interest. For example, in eukaryotic membranes the predominant lipid species is glycerol-based phospholipids, including phosphatidylcholine (PC), phosphatidylethanolamine (PE), phosphatidylserine (PS), phosphatidylinositol, and cardiolipin. In the case of glycerol-based lipids, it is usual to find a saturated fatty acid esterified at the 1-position of the glycerol backbone and an unsaturated fatty acid at the 2-1-position. Also, compared
to other lipids PE and PS lipids contain fatty acid chains with a greater degree of unsaturation [24].
Over the years, a number of area per lipid data has been published for the various headgroup-containing (e.g. PC, PG, PE, etc.) lipids found in nature (e.g. [7, 9, 12, 25-34]). However, the recent interest in MD simulations requires for systematic and more precise descriptions of the most commonly used lipids. The present work evaluates the molecular area of PC headgroup lipids with hydrocarbon chains of various length and degree of unsaturation, using the recently developed method for determining area per lipid described by [12]. In addition to lipid areas, a comprehensive list of other structural parameters is reported for lipid bilayers in the liquid crystalline phase as a function of temperature.
Materials and Methods
Synthetic saturated acyl chain phosphatidylcholines: 1,2-dilauroyl-sn-glycero-3-phosphatidylcholine (diC12:0PC, DLPC), 1,2-dimyristoyl-sn-glycero-3-1,2-dilauroyl-sn-glycero-3-phosphatidylcholine (diC14:0PC, DMPC), 1,2-dipalmitoyl-sn-glycero-3-phosphatidylcholine (diC16:0PC, DPPC), 1,2-distearoyl-sn-glycero-3-phosphatidylcholine (diC18:0PC, DSPC), mixed acyl chain phosphatidylcholines: 1-palmitoyl-2-oleoyl-sn-glycero-3-phosphatidylcholine (C16:0-18:1PC, POPC) and 1-stearoyl-2-oleoyl-sn-glycero-3-phosphatidylcholine (C18:0-18:1PC, SOPC), and branched acyl chain phosphatidylcholine: 1,2-diphytanoyl-sn-glycero-3-phosphatidylcholine (di4MEC16:0PC, DPhyPC) were purchased from Avanti Polar Lipids (Alabaster, AL) and used without further purification. Up to 60 mg of each lipid was mixed with 1.5 ml D2O (99.9% pure,
Chalk River Laboratories) or 18 MΩcm H2O (Millipore), and temperature cycled through the
Unilamellar vesicles (ULVs) were then prepared from this dispersion at temperatures above the main phase transition of each lipid using an Avanti mini-extruder fitted with two 0.25 ml air-tight syringes. MLVs were extruded through two polycarbonate filters with pore diameters of 500 Å, producing ULVs with diameters ~600 Å [35]. The most “rigid” lipid (DSPC) was pre-extruded using two 2000 Å diameter filters to form large ULVs [36]. Finally, samples were diluted with D2O or H2O to the desired external contrast condition (i.e. 100%, 70% and 50%
D2O in the case of neutron contrast variation experiments, and 100% H2O in the case of X-ray
scattering experiments). The total lipid concentration of all ULV samples was ~20 mg/ml, guaranteeing sufficient water between ULVs and eliminating the possibility of any inter-particle interactions [35].
Small-angle X-ray scattering
X-ray data were taken at the Cornell High Energy Synchrotron Source (CHESS) G-1 station. A 1.18 Å wavelength ( ) incident X-ray beam of dimensions 0.24 x 0.24 mm2
was detected using a 1024 x 1024 pixel array FLICAM charge-coupled device (CCD), with 6λ.78 m linear dimension pixels. The sample-to-detector distance (SDD) was 423.6 mm, as determined using silver behenate (d-spacing of 58.367 Å). Samples were contained in 1.5 mm quartz capillaries placed in a temperature controlled, multi-position sample holder. 2D images were de-zingered using two consecutive 10 sec exposures, and corrected using calibration files supplied by CHESS. Data sets were normalized using the incident beam intensity as measured by an ion chamber. Background scattering resulting from water and air scatter was subtracted according to the procedure described in [35]. An additional linear function was used to correct for an unaccountable rise in background scattering similarly to [37], while the use of an absorption
correction was found unnecessary (see Appendix). A typical curve of scattering form factors determined by 2 ) ( ) (q I q q F (1) is shown in Fig. 1A.
Small-angle neutron scattering
Neutron scattering data were taken at the NG-3 and NG-7 stations [38] located at the National Institute of Standards and Technology (NIST) Center for Neutron Research (NCNR), and at the CG-3 Bio-SANS instrument [39] located at the Oak Ridge National Laboratory (ORNL) Center for Structural Molecular Biology (CSMB). 6 Å wavelength neutrons were selected using a mechanical velocity selector, with an energy dispersion of 12.5, 11.5 and 14.5 % (FWHM), respectively. Multiple sample-to-detector distances (i.e. 1.3, 5 and 13.2 m at NG-3; 2, 5 and 15.3 m at NG-7; 2.5 and 15.3 m at CG-3) were used, resulting in a total scattering vector [q=4π/ sin(θ), where is the wavelength and 2θ is the scattering angle] of 0.003 < q < 0.3 Å-1. Data were collected using two-dimensional 3He position-sensitive detectors with a 5 mm x 5 mm resolution (640 x 640 mm2 at NIST, and a 1 x 1 m2 at ORNL). Samples were taken up in standard 1 mm path length quartz (banjo) cells. Finally, acquired 2D images were corrected and reduced into 1D scattering curves using software supplied by NIST [40] and ORNL, while no absorption correction was applied (see Appendix). Fig. 1B shows typical neutron scattering form factors calculated using Eq. 1.
The SDP model was developed by [12] and is graphically depicted in Fig. 1C-E. Briefly, the component groups are chosen on the basis that each group has the same functional form for all the different contrast conditions [i.e. X-ray (Fig. 1C) and neutron (Fig. 1D) scattering density profiles]. For example, carbonyl and glycerol groups are described by a single Gaussian (CG), the phosphate and part of the choline (CH2CH2N) by another Gaussian (PCN), and the remaining
choline (3xCH3) by yet another Gaussian (CholCH3). In effect, three Gaussians are used to
describe the PC headgroup. The error function represents the total hydrocarbon region (i.e. sum of CH2, CH and CH3 groups). CH and CH3 groups are each described by a single Gaussian,
which are then subtracted from the error function to obtain the CH2 distribution. The water
distribution is not defined by any particular function, but is instead calculated based on the complementarity requirement, whereby all of the probabilities add up to one. In this way, the model captures all of the features of the different scattering density profiles (SDPs) while satisfying the spatial conservation principle. Therefore, the volume probabilities (Fig. 1E) of the component groups in the SDP model sum up to unity at each point z along the bilayer normal [12].
From Fig. 1 it is obvious that neutrons and X-rays are sensitive to different parts of the bilayer. For example, in the case of X-rays the electron dense phosphate groups contrast very well with the less electron dense hydrocarbon region. Thus, X-ray data are well suited for the refinement of the lipid headgroup and hydrocarbon chains. On the other hand, the high neutron scattering length density of D2O (often used in neutron experiments instead of H2O in order to
increase the scattering contrast between the bilayer and solvent, and to reduce background) permits neutron scattering to accurately determine the total bilayer thickness, and consequently, lipid area. Based on the amount and quality of experimental data included in the analysis, we estimate the uncertainty of the various structural parameters to be about 2% [34].
Although the SDP model is designed to obtain structure from X-ray and neutron scattering data, the primary description is in terms of volume probability distributions (Fig. 1E). Lipid area A then follows from the volume probability of the water distribution, which gives the Gibbs dividing surface between the water and the lipid. In particular, the mean position of the water distribution is defined by the equality of the integrated water probabilities to the left of the Gibbs dividing surface and the integrated deficit of water probabilities to its right (see hatched areas in Fig. 1E). In other words, the Gibb‟s dividing surface is equivalent to Luzzati‟s division of two component systems consisting of water and lipid [11].
Results
X-ray scattering form factors for the different lipid bilayers studied were measured in H2O, while
neutron scattering form factors were determined at three different contrast conditions (i.e. 100, 70 and 50% D2O). These bilayers were measured at four different temperatures (i.e. 20, 30, 50
and 60oC), which in the case of some lipids covered both gel (data not shown) and liquid-crystalline phases. As a function of increasing temperature, the bilayer structural parameters, which depend on the interplay between increasing lipid volume [volume thermal expansivity:
V V T
V 1
, where Π suggests a constant pressure], increasing lipid area [area thermal
expansivity:A
1 A A T
)], and decreasing bilayer thickness [thickness thermal contractivity:D
1 D D T
], changed linearly. Thermal coefficients are determined from the slopes of the linear functions used to fit the various temperature dependent data. Uncertainties are estimated from the chi-squares, and include both the variance due to the assigned uncertainties and the weighted squares of the residuals, i.e.
2 1 1 1 2 2 2 2
n c kx y n i i i n i , (2)where σi is the uncertainty of parameter yi at point xi, and k and c are the coefficients of the linear
function. This way, the fits to the data with the fewest number of points also posses the largest uncertainties.
1,2-dilauroyl-sn-glycero-3-phosphatidylcholine (diC12:0PC, DLPC)
The thickness and lipid area of DLPC bilayers as a function of temperature are given in Fig. 2. They were obtained through the simultaneous analysis of X-ray and neutron ULV data. In the case of 30oC bilayers, ULV neutron and X-ray scattering form factors were refined using X-ray data previously obtained from stacks of oriented (ORI) bilayers [41]. In doing so, we are able to further evaluate the robustness of our method. While ULV data provide the strongest scattering signal at the low and mid q range, ORI samples allow us to extend the form factors up to q=0.82 Å-1
, thus increasing the resolution of our real space reconstruction. Bilayer profiles obtained from these two approaches (see Fig. S1 and S3 in the Supplementary Material) show that the largest differences are observed in the widths of the terminal methyl groups. However, it is obvious from Fig. 2 that the inclusion of the ORI data in our analysis did not alter area/lipid or the thickness of DLPC bilayers at 30oC.
The gel-to-fluid transition temperature of DLPC at ~ -1oC [24, 25, 42] is well below the range of temperatures examined in this study, placing all of our DLPC bilayers (i.e. 20, 30, 50 and 60oC) well into the fluid phase. All the scattering form factors are consistent with fluid phase bilayers (see the Supplementary Material) and show only small variations with changing temperature. These variations correspond to the linear changes taking place due to increasing
lipid volume and area/lipid as a function of increasing temperature, and the concomitant decrease in bilayer thickness. From the slopes of the structural data plotted as a function of temperature (Fig. 2), the corresponding thermal coefficients are determined and are listed in Tab. 1-3 (see also Tab. S1 for detailed results).
1,2-dimyristoyl-sn-glycero-3-phosphatidylcholine (diC14:0PC, DMPC)
The thickness and lipid area of DMPC bilayers as a function of temperature are given in Fig. 3 (also Tab. 1-3). Similar to what was done with DLPC bilayers (Fig. 2), the ULV neutron and X-ray scattering form factors were reanalyzed using X-X-ray data previously obtained from ORI stacks of DMPC bilayers at 30oC [41]. Although the scattering statistics are again improved in the high q region (see Fig. S6 in Supplementary Material), the resulting bilayer parameters differ negligibly whether or not the ORI data are used (Fig. 3).
The gel-to-fluid transition temperature for DMPC bilayers is reported to be between ~23 and ~24oC [14, 24, 25, 42]. As a result, we only have three liquid crystalline DMPC bilayer data sets (Fig. 3). The thermal thickness contractivity and area expansivity are evaluated from the slopes of the linear fits to the data (Fig. 3). A complete list of bilayer structural parameters for liquid crystalline DMPC bilayers can be found in Tab. S2 of the Supplementary Materials section.
1,2-dipalmitoyl-sn-glycero-3-phosphatidylcholine (diC16:0PC, DPPC) and 1,2-distearoyl-sn-glycero-3-phosphatidylcholine (diC18:0PC, DSPC)
DPPC and DSPC have main transition temperatures of ~41-42oC and ~54-55oC, respectively [14, 24, 25, 42, 43]. Thus we only collected two sets of liquid crystalline data of DPPC bilayers and one set of DSPC bilayers. In the case of DPPC, previously obtained X-ray ORI data from liquid
crystalline bilayers at 50oC [12] are analyzed for comparison – similar to what was done for DLPC and DMPC bilayers. Although the inclusion of the ORI data affects the scattering form factors in the higher q region (compare Fig. S10 and S11), the differences in real space data are again negligible (Fig. 4).
The various bilayer thicknesses and lipid areas for liquid crystalline DPPC and DSPC bilayers, as a function of temperature, are shown in Fig. 4 and Tab. 1-3. The thermal thickness contractivity and area expansivity are evaluated from the slopes of the linear fits to the DPPC data, only. A complete list of bilayer structural parameters for liquid crystalline DPPC and DSPC bilayers can be found in Tab. S3 of the Supplementary Materials section.
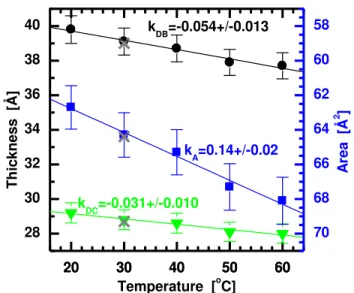
1-palmitoyl-2-oleoyl-sn-glycero-3-phosphatidylcholine (C16:0-18:1PC, POPC)
POPC bilayers undergo a gel-to-liquid crystalline phase transition around -2oC [43]. As such, all of the data shown in Fig. 5 are of liquid crystalline POPC bilayers. It is interesting to note the decreased number of lobes observed in the X-ray scattering form factors at 30oC (see Fig. S14 of the Supplementary Matterials). Although the ORI data are available up to q=0.8 Å-1, they are essentially of zero amplitude beyond q=0.6 Å-1 – the result of a rather smooth scattering density profile with no discernable real space features smaller than 10 Å. In many ways this result justifies the use of only analyzing ULV data, which cover the entire range of useful scattering. Not surprisingly, there are virtually no differences between the two results (i.e. ULV data vs. combined ULV and ORI data) shown in Fig. 5.
We had some difficulty in fitting the 20oC POPC X-ray scattering form factors (see Fig. S15 of the Supplementary Material), but the fits to the remaining data were excellent. Moreover, the temperature dependence data of POPC bilayer structural features, shown in Fig. 5, are consistent with the data obtained from the other bilayers studied (Figs. 2 – 4).
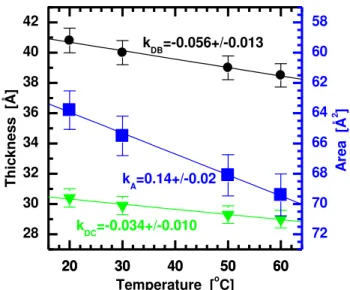
1-stearoyl-2-oleoyl-sn-glycero-3-phosphatidylcholine (C18:0-18:1PC, SOPC)
Compared to POPC bilayers, SOPC bilayers have a slightly higher main transition temperature i.e. ~ 6oC [43]. Liquid crystalline SOPC bilayers were studied at four different temperatures and the structural data resulting from the SDP analysis are shown in Fig. 6. Similar to the data already presented, DB and DC decrease linearly as a function of temperature, while values for A
increase. The data are shown in Tab. 1-3.
Similar to the POPC data, 20 oC SOPC X-ray scattering form factors show a small “lift off” in the two low-q minima (see Fig. S20 of Supplementary Material). The observation of non-zero minima is indicative of an asymmetric bilayer scattering profile [44]. Although single lipid bilayers are expected to be symmetric in the fluid phase, it is possible that lipids with longer and stiffer hydrocarbon chains are more prone to forming asymmetric bilayers when close to their melting temperature. Overall, this asymmetry is minor, and is only seen in the X-ray and not the neutron scattering form factors.
1,2-diphytanoyl-sn-glycero-3-phosphatidylcholine (di4MEC16:0PC, DPhyPC)
DPhyPC is a lipid with branched hydrocarbon chains (3,7,11,15-tetramethylhexadecanoic). Compared to unsaturated hydrocarbon chain lipids, DPhyPC‟s saturated chains are less susceptible to photo-oxidation and degradation, yet it readily forms biologically relevant fluid phase bilayers[45]. DPhyPC‟s geltofluid phase transition temperature is thought to be around -120oC [46], thus all of our measurements were conducted using liquid crystalline bilayers (Fig. 7).
DPhyPC experimental data were easily fit using the SDP model (see Fig. S24-S28 in the Supplementary Material). Similar to the other results presented here, data were obtained using
ULVs, while previous X-ray data from ORI samples [47] were included in the case of 30oC – as was done for some of the other bilayers. The inclusion of ORI data is in excellent agreement with structure data obtained from ULVs only (Fig. 7). The most pronounced differences between ULV data and ULV data combined with ORI data are observed in the high q region, where an extra lobe is seen in the scattering form factors that include the higher resolution ORI data (see Fig. S24). In real space, this affects structural parameters that X-rays are especially sensitive to (i.e. DHH), or those that correspond to finer bilayer details, where increased spatial resolution is
required (see Tab. S7 in the Supplementary Material). Not surprisingly, therefore, the exclusion of ORI data yields real space structural data of lower spatial resolution and/or decreased sensitivity to bilayer features especially discernable by X-ray scattering. An example of this is the small value of DH1 (the distance from the phosphate to the interface of the hydrocarbon
region; i.e. 2DH1=DHH-2DC) at 20oC. We believe this value is most likely the result of an artifact
of the analysis in that, it is rather insensitive to the intrabilayer parameters when high resolution ORI data are not taken into account. On the other hand, the neutron scattering data make the SDP analysis very robust when it comes to determining the overall bilayer structural parameters (see Fig. 7 and Tab. 1-3).
Discussion and Conclusions
It is well known that the bilayer structure formed by lipid aggregates is due to the hydrophobic effect [48], whereby non-polar molecules aggregate in such a fashion as to exclude water. Lipid bilayers thus form spontaneously and the area/lipid is determined by the balance between changes in entropy and enthalpy. As the lipid‟s hydrocarbon chains are unable to hydrogen bond with water, they disrupt the hydrogen bonding network between water molecules – the
magnitude of this disruption is directly related to the length of hydrocarbon chains [49]. Similarly, van der Waals attractive forces between the hydrocarbon tails that contribute to decreasing lipid area depend directly on lipid chain length. On the other hand, increase in lipid area is caused by the increased probability of trans-gauche isomerization that happens to increase with chain length [42] and temperature. As a result, the equilibrium area/lipid at the bilayer-water interface is dictated by the fine balance of the forces that minimize the system‟s total free energy. It is thus not surprising that lipids with different length hydrocarbon chains and degree of unsaturation form bilayers with different thicknesses and lipid areas – it is worth noting that rotational isomerization depends on the absolute temperature rather than a reduced lipid temperature, which has no effect on the lipid‟s first order main transition [9]. Importantly then, is that key membrane parameters used to describe lipid-lipid and lipid-protein interactions are compared at the same absolute temperature.
The effect of temperature on fluid bilayers
Not surprising, the bilayer structural parameters A, DB, DC differ among the various lipids and
also vary as a function of temperature. It is however reasonable to expect that these parameters vary with temperature in a similar fashion for all of the different lipids. The reason for this is that trans-gauche rotational isomerization has, among the other intrabilayer interactions, the strongest thermal dependence and affects, to a great extent, the thermal behavior of the various bilayer parameters. For example, the values for area thermal expansivity (TA), bilayer thickness thermal contractivity (TDB) and hydrophobic thickness thermal contractivity ( ) for the different DCT lipids show only a small temperature dependence (see Tab. 1-3), a result of our analysis having being performed well away from each lipid‟s gel phase (i.e. deep into the fluid phase). Near the
phase transition temperature, however, there are significant subcritical bilayer fluctuations taking place (e.g. [50-52]) that can evoke more substantial temperature dependencies.
The experimental uncertainties were evaluated by considering two contributions, that of the expressed structural parameter itself, as well as the linear function‟s slope uncertainty that was used to fit that particular parameter (see Fig. 2-7). As a result, the fits to data with the fewest number of experimental points (e.g. temperature dependence of DPPC) contain the largest uncertainties (see Eq. 2). Despite some large uncertainties, however, the temperature dependencies of the evaluated structural parameters suggest some interesting behavior. It seems that in terms of increased lipid area due to increased temperature (i.e. kA in Fig. 2-7), disaturated
chain lipids (i.e. DLPC, DMPC, DPPC, and DSPC) behave similarly, while the addition of methyl groups (i.e. DPhyPC) to hydrocarbon chains alter their behavior noticeably. However, an even larger effect is caused by the addition of a double bond (i.e. POPC and SOPC). This observed decreased temperature dependence of a bilayer‟s area/lipid can be attributed to the existing disorder caused by multiple methyl groups or a double bond contributing significantly to an enhancement of thermal fluctuations with increasing temperature. Similar behavior has been observed by coarse-grained MD simulations. For example, the inclusion of one double bond decreased the kA=ΔA/ΔT slope by almost 30% [53], a value in good agreement with our ~26%
change.
In comparing our present results with previously published NMR data of saturated chain lipids [30] and X-ray results obtained from the di-monounsaturated DOPC lipid [33], the NMR and X-rayprevious data suggest that temperature has a much more pronounced effect on lipid area than observed in here. This discrepancy between the different studies can, in part, be attributed to differences in the absolute values of A, which seem to generally be larger when determined from standalone X-ray scattering experiments [12]. Nevertheless, our molecular area
expansivity values kA vary between 0.14 Å2/deg for mixed chain lipids and 0.1λ Å2/deg for
saturated lipids, in disagreement with the 0.21 Å2
/deg value reported for DOPC by Pan et al. [33] and the ~0.27 Å2
/deg value reported for saturated lipids by [30]. Similarly, a larger lipid area expansivity for fluid DMPC bilayers was obtained by Needham and Evans [54] using giant ULVs and micropipette aspiration. However, Needham and Evans noted that their technique was sensitive to the apparent area of the vesicles and not the actual membrane area. Because of local membrane undulations present in stress-free giant ULVs, the apparent and true local areas may be very different. Moreover, such undulations are affected by temperature and may be much more pronounced near the chain melting temperature ([50-52]. On the other hand, our results are in good agreement with the X-ray measurements by Costigan et al. [55], where they determined kA=0.21 Å2/deg and TA=0.0032 deg
-1
for DMPC bilayers.
The effect of hydrocarbon chain on fluid bilayers
Unlike the case where temperature only profoundly affects the probability of trans-gauche isomerization, changes to a lipid‟s hydrocarbon chain length can affect all of the above-discussed intrabilayer interactions (i.e. hydrophobic effect, van der Waals interactions, and trans-gauche isomerization). The equilibrium lipid area is then the result of the fine balance between all of these interactions. Interestingly, our results suggest that there are differences between the chain length dependencies for saturated and mixed chain lipids. For example, at a given temperature a decrease in lipid area as a function of increased saturated fatty acid chain length is observed (Fig 8a). This implies a smaller increase of the entropic contribution resulting from rotational isomerization (i.e. chain disorder), compared to the hydrophobic and van der Waals interactions in saturated chain lipids. In agreement with NMR [30] and simulations [53], our data imply that
longer saturated hydrocarbon chains have an increasingly larger chain-chain van der Waals attractive energy, resulting in smaller lateral areas.
The situation, however, is dramatically different for lipids that contain one monounsaturated (oleoyl) fatty acid chain in the sn-2 position. Area/lipid increases upon the addition of two CH2 groups for all temperatures studied (Fig. 8a). It is worth noting that this
increase is about 3 times larger than the decrease we observed with saturated chain lipids, clearly demonstrating the importance that chain disorder has on area/lipid. In addition, compared to fully saturated chain lipid bilayers, bilayers formed by lipids with one monounsaturated chain (as well as those having two monounsaturated chains; [34] exhibit larger areas/lipid at each of the given temperatures (Tab. 1 and Fig. 8a). The bilayer thicknesses, on the other hand (Tab. 2 and 3, and Fig. 8b and 8c), are comparable to bilayers made of medium length saturated hydrocarbon chains, such as DPPC. This may be explained in terms of the cis-double bond perturbing the hydrocarbon chain packing. This is known to have a greater effect in lowering the main transition temperature than, for example, decreasing the length of the fatty acid chains [56]. Importantly, the extent of bilayer perturbation is known to depend on the double bond‟s position along the hydrocarbon chain, and is most pronounced when placed in the middle of the hydrocarbon chain [34, 56].
An effect similar to the addition of a cis-double bond on bilayer transition temperature and bilayer structural properties (i.e. increased chain disorder and area per lipid) can be achieved by methyl substitution - also depends on where along the fatty acid chain the methyl group is placed [56]. In the case of DPhyPC that contains four methyl groups along each of its hydrocarbon chains, we observe an approximate 20 Å2
increase in area per lipid (see Fig. 9). Also, for a given temperature DPhyPC‟s chains are between 3 and 4 Å shorter than DPPC‟s (see Tab. 1-3). These intrinsic properties of DPhyPC bilayers have previously raised the question
regarding its suitability in biophysical studies [47]. We extend this discussion by reporting on DPhyPC‟s thermal coefficients. Although the area expansivity T
A
is the smallest of all of the lipids studied here, this can be attributed to the much larger area/lipid rather than the weaker temperature dependence. A comparison of molecular area expansivities kA suggests that the
thermal dependence for trans-gauche isomerization experienced by DPhyPC bilayers is in-between bilayers made of saturated chain lipids and those comprised of mixed chain lipids (see Fig. 2-7). The data presented here may thus aid in clarifying DPhyPC‟s suitability for biomimetic studies.
Lipid area in fluid bilayers
Figure 9 summarizes areas/lipid for the various fluid bilayers at 30oC. Note that the data points for lipids with higher transition temperatures (i.e. DPPC and DSPC) were extrapolated from fluid phase values using the appropriate thermal coefficients for area expansion (Tab. 1-3). This method of analysis reiterates the notion that such comparisons should be carried out at the same absolute temperature. Importantly, the evidence for an extended linear dependence of areas as a function of chain length corroborates our previous statement that, in the case of saturated fatty acid liquid crystalline PC bilayers, van der Waals forces are the determining factor of lateral lipid area.
The data depicted in Fig. 9 also reveals the effect that fatty acid unsaturation has on lipid area. As discussed, the presence of a cis-double bond perturbs the packing of the hydrocarbon chains, which results in increased chain disorder and a concomitant increase in lipid lateral area. Interestingly, the addition of two methylene groups to mixed chain lipids results in an increased area/lipid (blue symbols in Fig. 9), in contrast to the decrease experienced by saturated
hydrocarbon chain lipids (black symbols in Fig. 9). This again suggests that rotational isomerization has a much more pronounced effect on lipid areas of mixed chain lipid bilayers than attractive van der Waals interactions. However, this behavior changes with the position of the double bond along the fatty acid chain. Previously published data by Kučerka et al. [34] showed both increasing and decreasing lipid lateral areas in di-monounsaturated PCs (green symbols in Fig. 9). This non linear behavior was explained in terms of double bond position. Lipids with double bonds fixed relative to the methyl terminus (i.e. ω10) can be fitted with a negative slope linear function - similar to that for saturated lipids. On the other hand, lipids with the double bonds fixed with respect to the PC headgroup (i.e. 9-cis) are fitted with a positive slope linear function - similar to the mixed chain lipids (with 9-cis double bond) reported here. From this we can conclude that bilayer thermodynamics for unsaturated lipids are determined by the double bond‟s position.
Comparing our current results of saturated and mixed chain lipids with previously reported areas for di-monounsaturated lipids [34], one can easily appreciate the profound effect that the first double bond has on lipid area. For example, of the increased area/lipid experienced by the substitution of two monounsaturated (e.g. DOPC) for two saturated (e.g. DSPC) fatty acid chains of same length, the addition of the first monounsaturated chain (e.g. POPC) accounts for between 70% and 80%. This result is in good agreement with a previous X-ray study that reported a 68% increase in area/lipid after the introduction of the first monounsaturated fatty acid chain [32].
We also compared our area/lipid values to previously published results. Lipid areas found in the literature vary considerably and depend, to a great extent, on the experimental technique used to obtain them. Substantial differences have been noted when utilizing standalone neutron and X-ray scattering data, compared to when they are jointly refined [12]. For example, DOPC‟s
lipid area had been overestimated by about 10% when standalone X-ray data was used to determine its value. This can be seen in Fig. 9 whereby our present lipid areas are compared with some of the earlier results for di-monousaturated chain lipid bilayers [25, 33], mixed chain lipid bilayers [7, 28, 32], and fully saturated chain lipid bilayers [25]. As mentioned, the discrepancies are, for the most part, due to the utilization of limited data sets. It should also be pointed out that data for saturated lipid bilayers obtained from standalone X-ray scattering experiments [27, 29] and/or NMR experiments [28, 30] show much better agreement with our present results. Although the absolute areas/lipid are better obtained using our joint refinement method, perhaps a more important message is that the relative changes in lipid areas observed in the different bilayers (Fig. 9) seem to be consistent irrespective of the technique used to obtain them.
Area/lipid is often used as the key parameter when assessing the validity of MD simulations. Not unlike the disparate experimental results for lipid areas, published MD simulations (though not as numerous), have also resulted in a wide range of areas/lipid [57]. Consequently, many simulations have opted to fixing the area/lipid in order to achieve better agreement with experiment. Our present results can then enable this approach of simulating membrane structure and dynamics by providing them with the appropriate lipid area values [13], which have in turn been obtained utilizing models guided by simulation results. It is obvious, then, that this way of experimentally obtained lipid areas are also model dependent – as is the case here. It has been proposed that a good test for the validity of MD simulations is to compare them to experimentally obtained scattering density profiles [57]. However, even these are calculated based on some assumptions. A better assessment of simulations is to compare them to “raw” experimental data (e.g. in form of scattering form factors), as suggested recently [58]. Our experimentally obtained scattering form factors shown in Figs. S1 to S28 thus again provide a basis for the synergy between experiment and simulation, whereby the simulation results guide
the development of more realistic models, and experimental data aid in the development of more accurate MD force fields.
To conclude, we have determined a number of structural parameters pertaining to fluid phase bilayers of three different classes of PC bilayers, at a series of temperatures. Structural parameters such as area/lipid, bilayer thickness and hydrocarbon chain thickness were determined through the simultaneous analysis of small angle neutron and X-ray scattering data. Having determined accurate areas/lipid, we were then enabled to evaluate the lipid chain thermodynamics. While tTemperature was found to have the most profound effect with regard to rotational isomerizations for all lipids studied, while this was not true when it came to changes in hydrocarbon chain length affected bilayer dynamics differently for different lipids. Although chain disorder due to rotational isomerization still dominates in some of the unsaturated lipids, its influence is very much dependent on the double bond‟s position along the hydrocarbon chain. Finally, in the case of saturated hydrocarbon chain lipids, it is the attractive van der Waals chain-chain interactions that determine the area/lipid as a function of chain-chain length.
Acknowledgements
This work acknowledges a support of the Office of Biological and Environmental Research at Oak Ridge National Laboratory‟s (ORNL) Center for Structural Molecular Biology (CSMB) through the utilization of facilities supported by the U.S.Department of Energy, managed by UT-Battelle, LLC under contract No. DE-AC05-00OR2275, facilities of the National Institute of Standards and Technology (NIST) supported in part by the National Science Foundation under agreement No. DMR-0944772, and the Cornell High Energy Synchrotron Source (CHESS),
which is supported by the National Science Foundation and the National Institutes of Health/National Institute of General Medical Sciences under National Science Foundation award DMR-0225180. JK is supported by ORNL‟s Laboratory Directed Research and Development (LDRD) program.
Appendix
Absorption correction
The use of an appropriate absorption correction is necessary when analyzing data from oriented
(ORI) stacks of bilayers [37]. X-rays scattered at small q (proportional to θ as
sin 4
) have, on
average, longer path lengths within the ORI samples than those scattered at higher q, i.e. X-ray scattered at low q are absorbed more than X-rays scattered at higher q (Fig. A1a). The angular dependence of the absorption correction was calculated (Fig. A2) assuming a 10 m thick sample with an absorption length xa=2.5 mm. Using this as our basis, the absorption at q=0.1 Å-1 is
almost 1.5 times greater than at q=1 Å-1 (Fig. A2).
Similarly, the absorption correction can be evaluated for unilamellar vesicles (ULVs). However, the difference between the two sample geometries (i.e. ORI and ULV) is such that, for ULVs the path length, and thus the absorption factor, increases with the increasing q (see Fig. A1b). Quantitatively, absorption is expressed by the coefficient and is inversely proportional to the absorption length xa. By definition, dl is the attenuation of the beam through an infinitesimal
sheet of thickness dl at a path length l from the sample surface, which results in the scattering intensity expressed as [59] l e I l I( ) 0 . (A1)
The path lengths for the two geometries shown in Fig. A1 are defined as
sin 2x lreflection (A2a) and 2 cos x t x ltransmission , (A2b)
where x can assume any value from 0 up to the total sample thickness t. Equation A1 is then integrated along these path lengths over the entire thickness t. The resultant expression for the angular dependence of the scattered intensity due to sample absorption is then written as:
sin 2 exp 1 2 sin ) ( 0 a a reflection x t t x I I (A3a) and
t x x t t x I I a a a on transmissi 2 cos 1 2 cos exp 1 2 cos exp 1 2 cos 2 cos ) ( 0 . (A3b)The absorption correction is then applied to correct the experimentally measured scattering intensities.
Figure A2 compares the normalized absorption corrections as a function of scattering vector q for typical X-ray scattering from ORI samples, X-ray scattering from ULVs, and neutron scattering from ULVs. It is obvious that the absorption correction is negligible in the case of ULVs.
Reference List
1. Lee, A.G., How Lipids Affect the Activities of Integral Membrane Proteins, Biochim. Biophys. Acta 1666[1-2] (2004) 62-87.
2. Balgavý, P., Gallová, J., Karlovská, J., Kotalová, M., Kučerka, N., Murugova, T., Teixeira, J., and Uhríková, D. Why and How to Measure Lipid Bilayer Thickness? (Leon V. Berhardt), (2010) pp.439-450, Hauppauge, NY.
3. Karlovská, J., Uhríková, D., Kučerka, N., Teixeira, J., Devínsky, F., Lacko, I., and Balgavý, P., Influence of N-Dodecyl-N,N-Dimethylamine N-Oxide on the Activity of Sarcoplasmic Reticulum Ca(2+)-Transporting ATPase Reconstituted into Diacylphosphatidylcholine Vesicles: Effects of Bilayer Physical Parameters, Biophys. Chem. 119[1] (2006) 69-77.
4. Harroun, T.A., Heller, W.T., Weiss, T.M., Yang, L., and Huang, H.W., Experimental Evidence for Hydrophobic Matching and Membrane-Mediated Interactions in Lipid Bilayers Containing Gramicidin, Biophys. J. 76[2] (1999) 937-945.
5. Worcester, D.L. and Franks, N.P., Structural Analysis of Hydrated Egg Lecithin and
Cholesterol Bilayers. II. Neutrol Diffraction, J. Mol. Biol. 100[3] (1976) 359-378.
6. Kučerka, N., Perlmutter, J.D., Pan, J., Tristram-Nagle, S., Katsaras, J., and Sachs, J.N., The Effect of Cholesterol on Short- and Long-Chain Monounsaturated Lipid Bilayers As Determined by Molecular Dynamics Simulations and X-Ray Scattering, Biophys. J. 95[6] (2008) 2792-2805.
7. Pabst, G., Rappolt, M., Amenitsch, H., and Laggner, P., Structural Information From Multilamellar Liposomes at Full Hydration: Full Q-Range Fitting With High Quality X-Ray Data, Phys. Rev. E. Stat. Phys. Plasmas. Fluids Relat Interdiscip. Topics. 62[3 Pt B] (2000) 4000-4009.
8. McIntosh, T.J. and Simon, S.A., Hydration Force and Bilayer Deformation: a Reevaluation, Biochemistry 25[14] (1986) 4058-4066.
9. Nagle, J.F. and Tristram-Nagle, S., Structure of Lipid Bilayers, Biochim. Biophys. Acta 1469[3] (2000) 159-195.
10. Kučerka, N., Nagle, J.F., Feller, S.E., and Balgavý, P., Models to Analyze Small-Angle Neutron Scattering From Unilamellar Lipid Vesicles, Phys. Rev. E. Stat. Nonlin. Soft. Matter Phys. 69 [5 Pt 1] (2004) 051903.
11. Luzzati, V. and Husson, F., The Structure of the Liquid-Crystalline Phases of Lipid-Water Systems, The Journal of Cell Biology 12[2] (1962) 207-219.
12. Kučerka, N., Nagle, J.F., Sachs, J.N., Feller, S.E., Pencer, J., Jackson, A., and Katsaras, J., Lipid Bilayer Structure Determined by the Simultaneous Analysis of Neutron and X-Ray Scattering Data, Biophys. J. 95[5] (2008) 2356-2367.
13. Klauda, J.B., Kučerka, N., Brooks, B.R., Pastor, R.W., and Nagle, J.F., Simulation-Based Methods for Interpreting X-Ray Data From Lipid Bilayers, Biophys. J. 90[8] (2006) 2796-2807.
14. Nagle, J.F. and Wilkinson, D.A., Lecithin Bilayers. Density Measurement and Molecular Interactions, Biophys. J. 23[2] (1978) 159-175.
15. Koenig, B.W. and Gawrisch, K., Specific Volumes of Unsaturated Phosphatidylcholines in the Liquid Crystalline Lamellar Phase, Biochim. Biophys. Acta 1715[1] (2005) 65-70.
16. Uhríková, D., Rybár, P., Hianik, T., and Balgavý, P., Component Volumes of Unsaturated Phosphatidylcholines in Fluid Bilayers: a Densitometric Study, Chem. Phys. Lipids 145[2] (2007) 97-105.
17. Engelman, D.M., Surface Area Per Lipid Molecule in the Intact Membrane of the Human Red Cell, Nature 223[5212] (1969) 1279-1280.
18. Mathai, J.C., Tristram-Nagle, S., Nagle, J.F., and Zeidel, M.L., Structural Determinants of Water Permeability Through the Lipid Membrane, J. Gen. Physiol 131[1] (2008) 69-76.
19. Nagle, J.F., Mathai, J.C., Zeidel, M.L., and Tristram-Nagle, S., Theory of Passive Permeability Through Lipid Bilayers, J. Gen. Physiol 131[1] (2008) 77-85.
20. Cantor, R.S., Lateral Pressures in Cell Membranes: A Mechanism for Modulation of Protein Function, The Journal of Physical Chemistry B 101[10] (1997) 1723-1725.
21. Benz, R.W., Castro-Roman, F., Tobias, D.J., and White, S.H., Experimental Validation of Molecular Dynamics Simulations of Lipid Bilayers: a New Approach, Biophys. J. 88[2] (2005) 805-817.
22. Anezo, C., de Vries, A.H., Holtje, H.D., Tieleman, D.P., and Marrink, S.J., Methodological Issues in Lipid Bilayer Simulations, J. Phys. Chem. B 107[35] (2003) 9424-9433.
23. Sachs, J.N., Petrache, H.I., and Woolf, T.B., Interpretation of Small Angle X-Ray
Measurements Guided by Molecular Dynamics Simulations of Lipid Bilayers, Chem. Phys. Lipids 126[2] (2003) 211-223.
24. Cullis, P.R. and Hope, M.J. Physical Properties and Structural Roles of Lipids in Membranes (Dennis E. Vance and Jean E. Vance), (1985) pp.25-72.
25. Lewis, B.A. and Engelman, D.M., Lipid Bilayer Thickness Varies Linearly With Acyl Chain Length in Fluid Phosphatidylcholine Vesicles, J. Mol. Biol. 166[2] (1983) 211-217.
26. McIntosh, T.J. and Simon, S.A., Area Per Molecule and Distribution of Water in Fully Hydrated Dilauroylphosphatidylethanolamine Bilayers, Biochemistry 25[17] (1986) 4948-4952.
27. Nagle, J.F., Zhang, R., Tristram-Nagle, S., Sun, W., Petrache, H.I., and Suter, R.M., X-Ray Structure Determination of Fully Hydrated L Alpha Phase
Dipalmitoylphosphatidylcholine Bilayers, Biophys. J. 70[3] (1996) 1419-1431.
28. Koenig, B.W., Strey, H.H., and Gawrisch, K., Membrane Lateral Compressibility Determined by NMR and X-Ray Diffraction: Effect of Acyl Chain Polyunsaturation, Biophys. J. 73[4] (1997) 1954-1966.
29. Petrache, H.I., Tristram-Nagle, S., and Nagle, J.F. , Fluid Phase Structure of EPC and DMPC Bilayers, Chem. Phys. Lipids 95[1] (1998) 83-94.
30. Petrache, H.I., Dodd, S.W., and Brown, M.F., Area Per Lipid and Acyl Length Distributions in Fluid Phosphatidylcholines Determined by (2)H NMR Spectroscopy, Biophys. J. 79[6] (2000) 3172-3192.
31. Balgavý, P., Dubničková, M., Kučerka, N., Kiselev, M.A., Yaradaikin, S.P., and Uhríková, D., Bilayer Thickness and Lipid Interface Area in Unilamellar Extruded 1,2-Diacylphosphatidylcholine Liposomes: a Small-Angle Neutron Scattering Study, Biochim. Biophys. Acta 1512[1] (2001) 40-52.
32. Kučerka, N., Tristram-Nagle, S., and Nagle, J.F. , Structure of Fully Hydrated Fluid Phase Lipid Bilayers With Monounsaturated Chains, J. Membr. Biol. 208[3] (2005) 193-202.
33. Pan, J., Tristram-Nagle, S., Kučerka, N., and Nagle, J.F., Temperature Dependence of Structure, Bending Rigidity, and Bilayer Interactions of
Dioleoylphosphatidylcholine Bilayers, Biophys. J. 94[1] (2008) 117-124.
34. Kučerka, N., Gallová, J., Uhríková, D., Balgavý, P., Bulacu, M., Marrink, S.J., and Katsaras, J., Areas of Monounsaturated Diacylphosphatidylcholines, Biophys. J. 97[7] (2009) 1926-1932.
35. Kučerka, N., Pencer, J., Sachs, J.N., Nagle, J.F., and Katsaras, J., Curvature Effect on the Structure of Phospholipid Bilayers, Langmuir 23[3] (2007) 1292-1299.
36. Kučerka, N., Pencer, J., Nieh, M.P., and Katsaras, J., Influence of Cholesterol on the Bilayer Properties of Monounsaturated Phosphatidylcholine Unilamellar Vesicles, Eur. Phys. J E 23[3] (2007) 247-254.
37. Liu, Y. New Method to Obtain Structure of Biomembranes Using Diffuse X-Ray Scattering: Application to Fluid Phase DOPC Lipid Bilayers., Carnegie Mellon University, (2003).
38. Glinka, C.J., Barker, J.G., Hammouda, B., Krueger, S., Moyer, J.J., and Orts, W.J., The 30 m Small-Angle Neutron Scattering Instruments at the National Institute of Standards and Technology, J. Appl. Cryst. 31 (1998) 430-445.
39. Heller, W.T., Lynn, G.W., Urban, V.S., Weiss, K., and Myles, D.A.A., The Bio-SANS Small-Angle Neutron Scattering Instrument at Oak Ridge National Laboratory, Neutron News 19[2] (2008) 22-23.
40. Kline, S.R., Reduction and Analysis of SANS and USANS Data Using IGOR Pro, J. Appl. Cryst. 39[6] (2006) 895-900.
41. Kučerka, N., Liu, Y., Chu, N., Petrache, H.I., Tristram-Nagle, S., and Nagle, J.F., Structure of Fully Hydrated Fluid Phase DMPC and DLPC Lipid Bilayers Using X-Ray Scattering From Oriented Multilamellar Arrays and From Unilamellar Vesicles, Biophys. J. 88[4] (2005) 2626-2637.
42. Cevc, G. and Marsh, D., Phospholipid Bilayers. Physical Principles and Models.,[5] (1987).
43. Avanti Polar Lipids (2011) http://www.avantilipids.com/.
44. Kučerka, N., Nieh, M.P., and Katsaras, J., Asymmetric Distribution of Cholesterol in
Unilamellar Vesicles of Monounsaturated Phospholipids, Langmuir 25[23] (2009) 13522-13527.
45. Wu, Y., He, K., Ludtke, S.J., and Huang, H.W., X-Ray Diffraction Study of Lipid Bilayer Membranes Interacting With Amphiphilic Helical Peptides: Diphytanoyl
Phosphatidylcholine With Alamethicin at Low Concentrations, Biophys. J. 68[6] (1995) 2361-2369.
46. Lindsey, H., Petersen, N.O., and Chan, S.I., Physicochemical Characterization of 1,2-Diphytanoyl-Sn-Glycero-3-Phosphocholine in Model Membrane Systems, Biochim. Biophys. Acta 555[1] (1979) 147-167.
47. Tristram-Nagle, S., Kim, D.J., Akhunzada, N., Kučerka, N., Mathai, J.C., Katsaras, J., Zeidel, M., and Nagle, J.F., Structure and Water Permeability of Fully Hydrated DiphytanoylPC, Chem. Phys. Lipids 163[6] (2010) 630-637.
48. Tanford, C. (1980) The Hydrophobic Effect: Formation of Micelles and Biological Membranes., John Wiley and sons, New York.
49. Yeagle, P. (1992) The Structure of Biological Membranes (Philip Yeagle), CRC Press, Boca Raton.
50. Mason, P.C., Nagle, J.F., Epand, R.M., and Katsaras, J., Anomalous Swelling in
Phospholipid Bilayers Is Not Coupled to the Formation of a Ripple Phase, Phys. Rev. E. Stat. Nonlin. Soft. Matter Phys. 63[3 Pt 1] (2001) 030902 .
51. Pabst, G., Amenitsch, H., Kharakoz, D.P., Laggner, P., and Rappolt, M., Structure and
Fluctuations of Phosphatidylcholines in the Vicinity of the Main Phase Transition, Phys. Rev. E. Stat. Nonlin. Soft. Matter Phys. 70[2 Pt 1] (2004) 021908.
52. Chu, N., Kučerka, N., Liu, Y., Tristram-Nagle, S., and Nagle, J.F., Anomalous Swelling of Lipid Bilayer Stacks Is Caused by Softening of the Bending Modulus, Phys. Rev. E. Stat. Nonlin. Soft. Matter Phys. 71[4 Pt 1] (2005) 041904.
53. Stevens, M.J., Coarse-Grained Simulations of Lipid Bilayers, J. Chem. Phys. 121[23 ] (2004) 11942-11948.
54. Needham, D. and Evans, E., Structure and Mechanical Properties of Giant Lipid (DMPC) Vesicle Bilayers From 20 Degrees C Below to 10 Degrees C Above the Liquid Crystal-Crystalline Phase Transition at 24 Degrees C , Biochemistry 27[21] (1988) 8261-8269.
55. Costigan, S.C., Booth, P.J., and Templer, R.H., Estimations of Lipid Bilayer Geometry in Fluid Lamellar Phases, Biochim. Biophys. Acta 1468[1-2] (2000) 41-54.
56. Lewis, R.N.A.H. and McElhaney, R.N. The Mesomorphic Phase Behavior of Lipid Bilayers (Philip Yeagle), (1992) pp.73-155, Boca Raton.
57. Poger, D. and Mark, A.E., On the Validation of Molecular Dynamics Simulations of Saturated and Cis-Monounsaturated Phosphatidylcholine Lipid Bilayers: A
Comparison With Experiment, Journal of Chemical Theory and Computation 6[1] (2009) 325-336.
58. Kučerka, N., Katsaras, J., and Nagle, J.F., Comparing Membrane Simulations to Scattering Experiments: Introducing the SIMtoEXP Software, J. Membr. Biol. 235[1] (2010) 43-50.
59. Als-Nielsen, J. and McMorrow, D. (2001) Elements of Modern X-Ray Physics, John Wiley & Sons, Ltd.
Table Captions
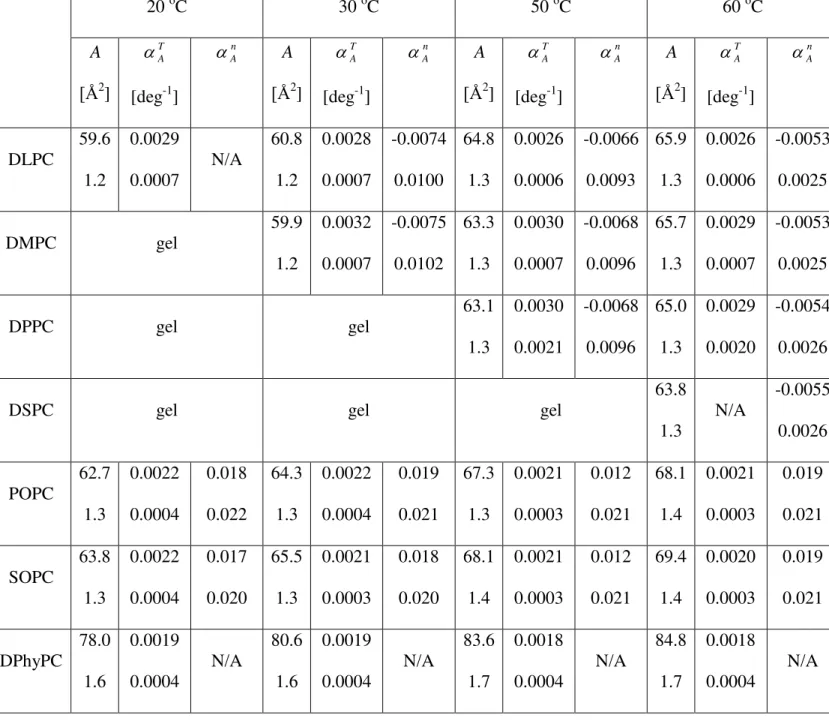
Tab. 1: Lipid area (A), thermal area expansivity (TA
1 A A T
), and area expansivity as a function of hydrocarbon chain length (An
1 A A n
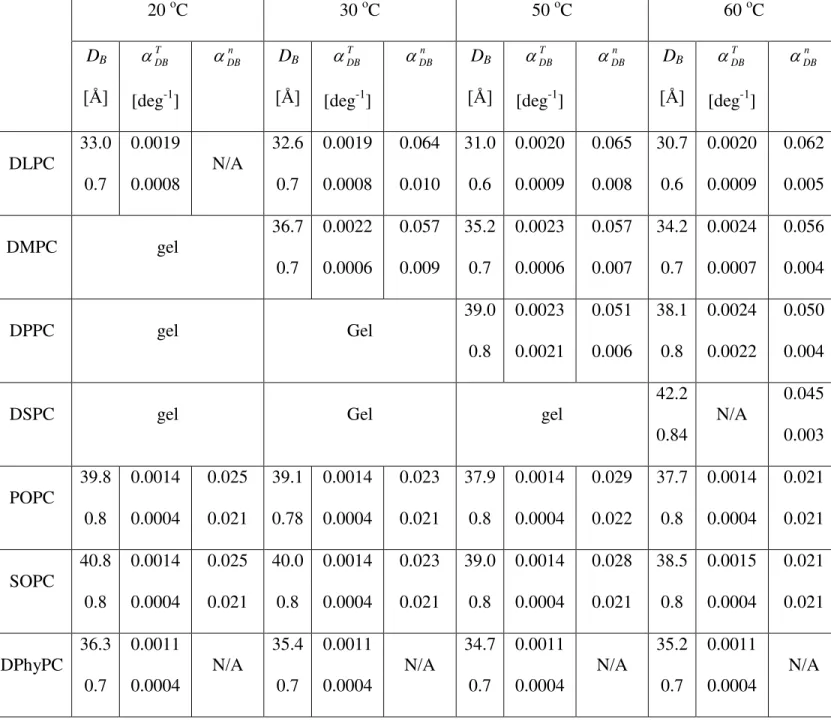
) for the various fluid bilayers studied. The uncertainties (+/-) shown below the main values are calculated according to Eq. 2.Tab. 2: Bilayer thickness (DB), its thermal contractivity (
DB
DB T
TDB 1
), and the
contractivity as a function of hydrocarbon chain length (DBn
1 DB
DB n
) for the various fluid bilayers studied. The uncertainties (+/-) shown below the main values are calculated according to Eq. 2.Tab. 3: Hydrocarbon region thickness (2DC), its thermal contractivity
(
DC
DC T
T
DC 1
), and the contractivity as a function of hydrocarbon chain length ( n
DC
DC n
DC 1
) for various fluid bilayers studied. The uncertainties (+/-) shown below the main values are calculated according to Eq. 2.
Figure Captions
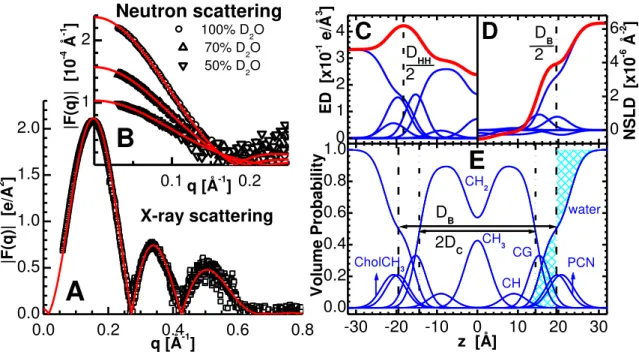
Figure 1: An illustration of lipid bilayer structure determination through the simultaneous analysis of X-ray and neutron scattering data obtained from POPC bilayers at 30oC. Graphs on the left show the experimental X-ray (A) and contrast varied neutron (B) scattering form factors (points), together with the best fits to the data (solid lines). The scattering density profile (SDP) model of a bilayer in real space is shown on the right, where the top panels show electron densities (ED) (C) and neutron scattering length densities (NSLD) (D) of the various lipid component distributions, including the total scattering density (thick lines). Panel (E) shows volume probability distributions, where the total probability is equal to 1 at each point across the bilayer. The definition of the Gibb‟s dividing surface is demonstrated for the interface between the lipid bilayer and the water phase (effectively DB) - a point on the z axis where the integrated
areas (hatched) are equal.
Figure 2: Temperature dependence of DLPC bilayer thickness (black circles represent DB, and
green triangles represent 2DC) and lipid area (blue squares). For the most part, the data shown are
from the analysis of ULVs, while values denoted by the gray X symbols (30oC) are from the joint refinement of ULV and ORI samples.
Figure 3: Temperature dependence of DMPC bilayer thickness (black circles represent DB, and
green triangles represent 2DC) and area per lipid (blue squares). Data shown are from the
analysis of ULVs, while data denoted by the gray X symbols (30oC) are from the joint refinement of ULV and ORI samples.
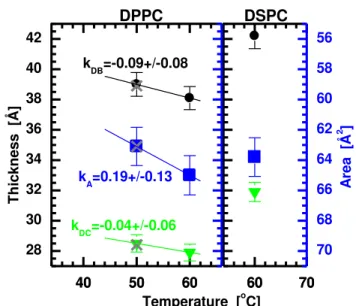
Figure 4: Temperature dependence of liquid crystalline DPPC and DSPC bilayer thickness (black circles represent DB, and green triangles represent 2DC) and lipid area (blue squares). Data
shown are from the analysis of ULV samples, while data denoted by the gray X symbols (50oC) are from the joint refinement of ULV and ORI DPPC samples.
Figure 5: Temperature dependence of liquid crystalline POPC bilayer thickness (black circles represent DB, and green triangles represent 2DC) and lipid area (blue squares). Data shown are
from the analysis of ULV samples, while data denoted by the gray X symbols (30oC) are from the joint refinement of ULV and ORI samples.
Figure 6: Temperature dependence of the bilayer thickness (black circles represent DB, and
green triangles represent 2DC) and lipid area (blue squares) of liquid crystalline ULV SOPC
bilayers.
Figure 7: Temperature dependence of liquid crystalline DPhyPC bilayer thickness (black circles represent DB, and green triangles represent 2DC) and lipid area (blue squares). Data shown are
from the analysis of ULVs, while data denoted by the gray X symbols (30oC) are from the joint refinement of ULV and ORI samples.
Figure 8: The effect of hydrocarbon chain length on lipid area (a), bilayer thickness (b) and hydrocarbon chain thickness (c) for saturated fatty acid chain lipids (solid symbols) and mixed chain lipids (open symbols) at four different temperatures. Data from saturated chain and mixed chain lipids have been offset (y-axis) for clarity of presentation.
Figure 9: Summary of area/lipid vs. hydrocarbon chain length for the various lipids studied at 30oC. In the case of m=0 (black squares), the fatty acid chains are fully saturated, while m=0.5 (blue squares) and m=1 (green circles) denote the presence of one and two monounsaturated fatty acid chains, respectively. The area/lipid for the branched fatty acid DPhyPC lipid is indicated by the gray square. All areas denoted by solid symbols (i.e. squares and circles) are obtained using 30oC data, while areas indicated by open squares are calculated from fluid phase data using the determined thermal area expansivities. Squares (both open and solid) correspond to current data, while solid circles are from previously published lipid areas that were determined using the SDP analysis [34]. Xs represent lipid areas from literature (see the text for references). When needed, the averaged molecular area expansion kA=0.167 Å2/deg was used to extrapolate the literature
data to 30oC.
Figure A1: Schematics of scattering geometries. (A) the reflection geometry utilized in ORI samples, and (B) the transmission geometry utilized in scattering from ULVs dispersed in water.
Figure A2: Absorption corrections evaluated using equations A3a and A3b for the scattering geometries described. X-ray scattering from ORI samples (xa=2.5 mm, t=0.01 mm and =1.18 Å)
is measured in reflection geometry, while both X-ray (xa=4 mm, t=1.5 mm and =1.18 Å) and
neutron (xa=9.5 mm, t=1 mm and =6 Å) scattering from ULV dispersions is measured in
transmission geometry. Solid lines denote q-ranges that are typically accessible by the given experiment.