Publisher’s version / Version de l'éditeur:
The Astrophysical Journal Supplement Series, 221, 1, 2015-10-29
READ THESE TERMS AND CONDITIONS CAREFULLY BEFORE USING THIS WEBSITE. https://nrc-publications.canada.ca/eng/copyright
Vous avez des questions? Nous pouvons vous aider. Pour communiquer directement avec un auteur, consultez la
première page de la revue dans laquelle son article a été publié afin de trouver ses coordonnées. Si vous n’arrivez pas à les repérer, communiquez avec nous à PublicationsArchive-ArchivesPublications@nrc-cnrc.gc.ca.
Questions? Contact the NRC Publications Archive team at
PublicationsArchive-ArchivesPublications@nrc-cnrc.gc.ca. If you wish to email the authors directly, please see the first page of the publication for their contact information.
NRC Publications Archive
Archives des publications du CNRC
This publication could be one of several versions: author’s original, accepted manuscript or the publisher’s version. / La version de cette publication peut être l’une des suivantes : la version prépublication de l’auteur, la version acceptée du manuscrit ou la version de l’éditeur.
For the publisher’s version, please access the DOI link below./ Pour consulter la version de l’éditeur, utilisez le lien DOI ci-dessous.
https://doi.org/10.1088/0067-0049/221/1/13
Access and use of this website and the material on it are subject to the Terms and Conditions set forth at
The ACS Fornax cluster survey. XI. catalog of globular cluster
candidates
Jordán, Andrés; Peng, Eric W.; Blakeslee, John P.; Côté, Patrick;
Eyheramendy, Susana; Ferrarese, Laura
https://publications-cnrc.canada.ca/fra/droits
L’accès à ce site Web et l’utilisation de son contenu sont assujettis aux conditions présentées dans le site LISEZ CES CONDITIONS ATTENTIVEMENT AVANT D’UTILISER CE SITE WEB.
NRC Publications Record / Notice d'Archives des publications de CNRC:
https://nrc-publications.canada.ca/eng/view/object/?id=97b7c17d-a9ef-40b9-be32-0d7bc285458d https://publications-cnrc.canada.ca/fra/voir/objet/?id=97b7c17d-a9ef-40b9-be32-0d7bc285458dTHE ACS FORNAX CLUSTER SURVEY. XI. CATALOG OF GLOBULAR CLUSTER CANDIDATES
*Andrés Jordán1,2, Eric W. Peng3,4, John P. Blakeslee5, Patrick Côté5, Susana Eyheramendy2,6, and Laura Ferrarese5 1
Instituto de Astrofísica, Facultad de Física, Pontificia Universidad Católica de Chile, Av. Vicuña Mackenna 4860, 7820436 Macul, Santiago, Chile
2
Millennium Institute of Astrophysics, Av. Vicuña Mackenna 4860, 7820436 Macul, Santiago, Chile
3
Department of Astronomy, Peking University, Beijing 100871, China
4
Kavli Institute for Astronomy and Astrophysics, Peking University, Beijing 100871, China
5
Herzberg Astronomy and Astrophysics, National Research Council, 5071 West Saanich Road, Victoria, BC V9E 2E7, Canada
6
Departmento de Estadi ́stica, Facultad de Matemáticas, Pontificia Universidad Católica de Chile, Av. Vicuña Mackenna 4860, 7820436 Macul, Santiago, Chile
Received 2015 September 3; accepted 2015 September 28; published 2015 October 29
ABSTRACT
We present catalogs of globular cluster (GC) candidates for 43 galaxies from the ACS Fornax Cluster survey, a program designed to carry out imaging of early-type members of the Fornax cluster using the Advanded Camera for Surveys (ACS) on board the Hubble Space Telescope. The procedure to select bona fide GC candidates from the full list of detections is based on model-based clustering methods, similar to those adopted for a survey of 100 galaxies in the Virgo cluster, the ACS Virgo Cluster Survey. For each detected source, we measure its position, magnitudes in the F475W (≈Sloan g) and F850LP (≈Sloan z) bandpasses, half-light radii obtained by fitting point-spread function-convolved King models to the observed light distribution, and an estimate of the probabilty pGC that each cataloged source is a GC. These measurements are presented for 9136 sources, of which 6275 have
pGC 0.5, and are thus likely GCs.
Key words:catalogs – galaxies: elliptical and lenticular, cD – galaxies: star clusters: general Supporting material:machine-readable table
1. INTRODUCTION
Globular Clusters (GCs) are among the oldest baryonic structures in the universe, which has led to their use as tracers of the assembly of the galaxies to which they are usually bound. Observationally, they are attractive tracers due to their compactness and luminosity: a typical GC has a half-light radius of ≈3 pc and a luminosity of ≈105Le, with
well-characterized distributions around these values (e.g., Jordán et al.2005,2007b).
The largest repository of GCs in the local universe is the Virgo Cluster at a distance of »16.5 Mpc (Mei et al. 2007; Blakeslee et al.2009), followed by the much more compact and less rich Fornax cluster at ≈20 Mpc (Blakeslee et al. 2009). The ACS Virgo and Fornax Cluster Surveys (Côté et al.2004; Jordán et al.2007a)had as one of their major aims the detection and characterization of the GC populations around 100 early-type galaxies in Virgo and 43 in Fornax (these surveys will be referred to as ACSVCS and ACSFCS, respectively, in what follows). Observations were carried out with the Advanced Camera for Surveys (ACS) on board the Hubble Space Telescope (HST). ACS makes it possible to detect 90% of the GC population that fell within the ACS field of view for each of the targeted galaxies in a single HST orbit, and to do so in two bands: F475W (≈Sloan g) and F850LP (≈Sloan z). In the case of Virgo, the ACSVCS detected 20,375 spatially resolved sources around their target galaxies, of which 12,763 were considered to be bona fide GC candidates, approximately two orders of magnitude more than the GC population in our Galaxy. Such a massive census of GCs in the local universe in two bands was made possible by the large improvements in
sensitivity that ACS delivered over its predecessor, the Wide Field Planetary Camera 2, which had already achieved great advances in the study of GC systems around selected galaxies in Virgo.
In this paper, we present a catalog of 9136 spatially resolved sources detected around the target early-type galaxies of the ACSFCS, complementing the catalog of 20,375 sources presented previously for the Virgo sample by Jordán et al. (2009). For each detected source, we present estimates of its position, its magnitudes in the F475W and F850LP bandpasses, and its half-light radii by fitting a point-spread function (PSF)-convolved King model to the observed light distribution. The catalog presented here was used in previous papers studying various properies of the GC systems of the ACSFCS target galaxies, namely, their half-light radii (Masters et al. 2010), luminosity functions (Villegas et al. 2010), color–magnitude relations (Mieske et al. 2010), and color gradients (Liu et al.2011).
2. GC CATALOGS
The detection, selection, and characterization of the sources presented in this paper has been throughly documented in previous publications. The data reduction procedures and rough initial culling of ACSFCS sources are detailed in Jordán et al. (2007a). These procedures were in turn devised to be homogeneous with respect to those adopted in ACSVCS and are described in Jordán et al. (2004). All of the sources that satisfy the rough initial culling belong mainly to three populations: foreground (Milky Way) stars, background galaxies, and GCs.
For completeness, here we briefly describe our adopted procedure to select bona fide GC candidates from those sources that satisfy the initial selection criteria; a full, detailed account
The Astrophysical Journal Supplement Series, 221:13 (5pp), 2015 November doi:10.1088/0067-0049/221/1/13
© 2015. The American Astronomical Society. All rights reserved.
*
Based on observations with the NASA/ESA Hubble Space Telescope obtained at the Space Telescope Science Institute, which is operated by the Association of Universities for Research in Astronomy, Inc., under NASA contract NAS 5-26555.
is given in Jordán et al. (2009). We begin by describing the measurements upon which the selection is based.
1. Magnitudes in the F475W and F850LP bandpasses, denoted in what follows by g475 and z850, respectively. We measured aperture magnitudes and model magnitudes obtained by fitting King (1966)models convolved with the PSF. Aperture magnitudes were measured with SExtractor (Bertin & Arnouts 1996) as described in Jordán et al. (2004), with aperture corrections applied as described in Section 3 of Jordán et al. (2009). Model magnitudes were obtained using the procedure described in the Appendix of Jordán et al. (2005), with aperture corrections applied as described in Section 3 of Jordán et al. (2009).
2. Half-light radii measured as described in Jordán et al. (2005, 2007a). We estimated half-light radii in the g475 and z850 bands, denoted by rh g,475 and rh, z850,
respec-tively, and defined the half-light radius of each souce rhto
be the straight average of the g475- and z850-band measurements, i.e.,rhº0.5(rh z,850+rh g,475).
The first step was to eliminate all of the sources that were consistent with being point sources by imposing the condition
>
rh 0. 0096,or ≈0.2 ACS pixels. All of the sources that meet this condition are cataloged in this paper.7
Having eliminated the unresolved sources, we were left with the task of separating GCs from background clusters. For that purpose, we modeled the observed distribution of sources in the
z850−rhplane as a mixture model with two components. The
GC component, dGC, is assumed to be distributed as
m p s s m = - -´ ⎡ ⎣ ⎢ ⎢ ⎤ ⎦ ⎥ ⎥ d z r z g r , 1 2 exp 22.8 2 , 1 h rh h rh GC 850 850 2 2 gc
(
)
(
)
(
)
( )where σ = 1.3 mag8 and ggc is an empirically determined
distribution for rh. The value of 22.8 for the mean GC z850 magnitude was chosen to be 0.1 magnitudes fainter than the one we used for Virgo based on the mean difference of the GC luminosity function means for the Virgo and Fornax galaxies reported in Ferrarese et al. (2000).9The only free parameter of dGCis the mean half-light radiusm ;rh the rationale for assuming
this distribution is detailed in Section 2.1.1 of Jordán et al. (2009). The background galaxy component is a fixed distribution dcont(z850,rh)which was constructed using control
fields as described in Jordán et al. (2009). The full model of the joint ditribution of sources for a given galaxy in the ACSFCS
sample is then given by
m = m + -⎡⎣ ⎤⎦ M z r f f d z r f d z r , , , 1 , . 2 h rh h rh h 850 GC GC GC 850 GC cont 850
(
)
(
)
(
)
( ) ( )Here, fGCand 1−fGCare the fractions of the sample that are
expected to be GCs and background galaxies (contaminants), respectively. We estimate the two parameters{m frh, GC}in our model using the Expectation–Maximization algorithm as detailed in Jordán et al. (2009). Once the parameters have been estimated, for each source we can calculate the probability pGCof being a GC via the assignment
m m = + -p f d z r f d z r f d z r , , 1 , , 3 h h rh h GC GC GC 850 rh GC GC 850 GC cont 850
(
)
(
)
(
)
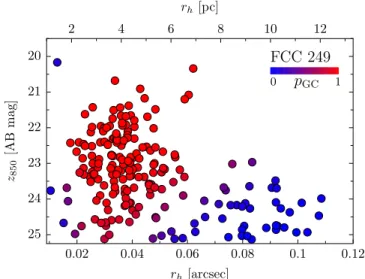
( ) ( ) and, given that there are just two components, the correspond-ing probability pcontof it being a contaminant is given simplyby pcont = -1 pGC.In a final step, pGCº1is assigned to all of the sources satisfying z < 23 mag and 1.5 pc < rh<4 pc, as
we want to consider these sources as bona fide GC candidates regardless of the exact value of pGCreturned by the algorithm. Due to the high level of contamination of faint extended objects, we also set pGC = 0 for z850>25.25mag and rh > 10 pc. For illustration purposes, Figure 1 shows the
resolved sources around the E0 galaxy FCC 249 in the rh–z850 plane, with points color coded according to the values of pGC
assigned by the algorithm.
Table1 presents for each ACSFCS galaxy the parameter estimates of the mixture model described by Equation (2). In Table 2, we present our full catalog of resolved sources for all of the galaxies in ACSFCS10; a Hess diagram in the
Figure 1. Resolved sources around the early-type galaxy FCC 249 (NGC 1419) plotted in the rh–z850 plane. Points are color coded based on their
estimated probabilty of being a globular cluster pGCaccording to the color bar
shown in the figure.
7
In Jordán et al. (2009), it is stated that the cataloged sources for ACSVCS are all those which satisfy the rough initial culling detailed in Jordán et al. (2004), but this is incomplete as an additional cut in rh, similar to the one
described here, was also applied before cataloging.
8
In Jordán et al. (2006,2007b) we found that the dispersion of the GC luminosity function when modeled by a Gaussian depends systematically on the galaxy luminosity, with σ ≈ 1.4 for giant early-types and decreasing to σ ≈ 0.8 for the faintest members in the ACSVCS sample. We kept a single value of σ = 1.3 in this work to maintain homogeneity with the selection procedure adopted in ACSVCS. Additionally, we want to include in our selection procedures the faint galaxies which have small numbers of GCs.
9
Based on the ACSFCS data we present in this work, we later updated this value to 0.2 ± 0.04 (Villegas et al.2010).
10
We note that for FCC 213 (NGC 1399) the catalog presented here corresponds only to objects present in the imaging acquired as part of the ACSFCS, but there is a set of ACS observations in the F606W filter that allows estimation of sizes for GCs at larger galactocentric radii than those cataloged in this work (Puzia et al.2014).
rh–z850 plane for all of the cataloged sources is shown in Figure2. The first column in Table2is the galaxy identifier, primarily taken from the Fornax Cluster Catalog (FCC; Ferguson1989), except for IC 2006 and NGC 1380, which were not in the footprint of the FCC. Columns (2) and (3) give the R.A. α (J2000) and decl. δ (J2000) of each source, and column (4) gives the projected distance to the center of the host galaxy in arcseconds. Columns (5) and (6) give the total King model magnitude and the total magnitude inferred from a 0 2 aperture for the z850 band. These magnitudes have been dereddened, as described in Section 5.1 in Jordán et al. (2007a), and have had aperture corrections applied as described in Section 3 of Jordán et al. (2009). Columns (7) and (8) give the corresponding quantities for the g475band. Columns (9) and (10) give the best-fit half-light radii of the PSF-convolved King (1966) models in arcseconds for the
z850 and g475 bands, respectively. The uncertainties do not include systematic uncertainties arising from the PSF modeling, which can be estimated to be of the order of ≈0 005 (see Jordán et al. 2005). In order to convert the half-light radii to physical units, we can use the SBF distances to our galaxies presented in Blakeslee et al. (2009). Column (11) gives the value of pGCfor each source.
Column (12) gives the adopted value of E(B − V) taken from the DIRBE maps of Schlegel et al. (1998). Finally, columns (13) and (14) give the galaxy plus “sky” back-ground in counts s−1 present under each source in the g
475 and z850bands, respectively. These quantities are necessary to estimate the expected survey completeness at the position of each source using the data presented in Tables 2 and 3 of
Jordán et al. (2009), which are also applicable to the ACSFCS.
3. SUMMARY
We have presented the results of our photometric and structural parameter measurements for 9136 spatially resolved sources which satisfy the rough selection procedures described Jordán et al. (2007a). For each cataloged source, we measure its position, g475 and z850 magnitudes, and half-light radii. We estimate the probability for each source to be a GC using a model-based mixture model and find that 6275 sources are likely to be GCs lying within the ACS field of view around our target galaxies.
Previously, we presented a similar catalog for 100 galaxies in the Virgo cluster (Jordán et al. 2009). In combination, the ACSVCS and ACSFCS catalogs present measurements of the magnitudes, positions, and half-light radii for over 19,000 likely GCs in the two most prominent galaxy clusters in the local universe (D 25 Mpc). The catalogs are constructed in a very homogeneous fashion and can be directly joined as a single catalog of resolved sources around 143 Virgo and Fornax galaxies. In terms of the numbers of likely GCs cataloged, new wide-field, ground-based surveys of nearby structures such as the Next Generation Virgo Survey (Ferrarese et al.2012; Durrell et al.2014)will soon provide larger yields and better photometric characterization, but the combined ACSFCS and ACSFCS GC catalogs remain unique in providing size estimates thanks to the resolving power of HST. As such, it should provide a very useful compliment to spectroscopic studies of GCs with the next generation ground-based telescopes, whose light-gathering power should allow the measurement of internal velocity dispersions for interesting numbers of sources and for which the half-light radii presented here will be very useful to be able to provide mass estimates.
Support for program GO-10217 was provided through a grant from the Space Telescope Science Institute, which is operated by the Association of Universities for Research in Astronomy, Inc, under NASA contract NAS5-26555. A.J. and S.E. acknowledge support from the Ministry of Economy, Development, and Tourismʼs Millennium Science Initiative
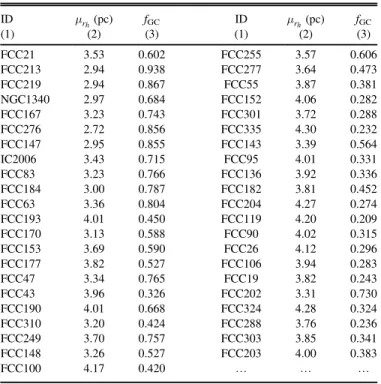
Table 1
Maximum-likelihood Parameters of Mixture Model
ID mrh(pc) fGC ID mrh(pc) fGC (1) (2) (3) (1) (2) (3) FCC21 3.53 0.602 FCC255 3.57 0.606 FCC213 2.94 0.938 FCC277 3.64 0.473 FCC219 2.94 0.867 FCC55 3.87 0.381 NGC1340 2.97 0.684 FCC152 4.06 0.282 FCC167 3.23 0.743 FCC301 3.72 0.288 FCC276 2.72 0.856 FCC335 4.30 0.232 FCC147 2.95 0.855 FCC143 3.39 0.564 IC2006 3.43 0.715 FCC95 4.01 0.331 FCC83 3.23 0.766 FCC136 3.92 0.336 FCC184 3.00 0.787 FCC182 3.81 0.452 FCC63 3.36 0.804 FCC204 4.27 0.274 FCC193 4.01 0.450 FCC119 4.20 0.209 FCC170 3.13 0.588 FCC90 4.02 0.315 FCC153 3.69 0.590 FCC26 4.12 0.296 FCC177 3.82 0.527 FCC106 3.94 0.283 FCC47 3.34 0.765 FCC19 3.82 0.243 FCC43 3.96 0.326 FCC202 3.31 0.730 FCC190 4.01 0.668 FCC324 4.28 0.324 FCC310 3.20 0.424 FCC288 3.76 0.236 FCC249 3.70 0.757 FCC303 3.85 0.341 FCC148 3.26 0.527 FCC203 4.00 0.383 FCC100 4.17 0.420 K K K
Note. Key to columns—(1) Galaxy ID; (2) mean half-light radius of GC component (assuming D = 20 Mpc); (3) estimated fraction of the total sample of the GC component. The corresponding quantity for the contaminants component, fcontis given by fcont º -1 fGC.
Figure 2. Hess diagram in the rh–z850 plane for all sources cataloged in
this work.
3
Table 2
Photometric and Structural Catalog of Sourcesa,b
ID α (J2000) δ (J2000) dgal( ) mz mz,ap mg mg,ap rh z, rh,g pGC E(B − V) bz bg
(1) (2) (3) (4) (5) (6) (7) (8) (9) (10) (11) (12) (13) (14) 21 50.6728957 −37.2095599 5.075 22.144 ± 0.204 22.332 ± 0.091 23.922 ± 0.152 23.917 ± 0.097 0.0774 ± 0.0241 0.0671 ± 0.0152 0.81 0.021 10.1850 7.9620 21 50.6745804 −37.2101309 6.549 23.284 ± 0.134 23.230 ± 0.132 24.958 ± 0.299 24.919 ± 0.113 0.0271 ± 0.0063 0.0254 ± 0.0095 0.97 0.021 4.5010 3.5840 21 50.6722922 −37.2105599 9.040 21.575 ± 0.034 21.532 ± 0.031 22.681 ± 0.021 22.649 ± 0.019 0.0334 ± 0.0035 0.0365 ± 0.0016 1.00 0.021 4.7960 3.8120 21 50.6745959 −37.2109056 9.265 20.737 ± 0.028 20.705 ± 0.024 21.793 ± 0.038 21.773 ± 0.034 0.0193 ± 0.0042 0.0218 ± 0.0038 1.00 0.021 3.0480 2.4190 21 50.6718051 −37.2105049 9.663 20.913 ± 0.090 20.883 ± 0.033 21.985 ± 0.034 21.988 ± 0.032 0.0329 ± 0.0065 0.0383 ± 0.0045 1.00 0.021 4.7660 3.7840 21 50.6712169 −37.2100478 9.710 22.130 ± 0.079 22.111 ± 0.063 23.728 ± 0.126 23.689 ± 0.054 0.0491 ± 0.0073 0.0237 ± 0.0063 1.00 0.021 5.1170 4.1070 21 50.6751601 −37.2054202 11.314 18.697 ± 0.009 18.639 ± 0.009 20.058 ± 0.017 20.028 ± 0.011 0.0126 ± 0.0021 0.0123 ± 0.0014 0.01 0.021 3.3880 2.6960 21 50.6768338 −37.2061849 11.608 20.976 ± 0.025 20.940 ± 0.018 22.845 ± 0.027 22.803 ± 0.026 0.0333 ± 0.0023 0.0272 ± 0.0021 1.00 0.021 3.8160 3.1540 21 50.6779378 −37.2076265 11.925 22.727 ± 0.382 22.681 ± 0.062 24.016 ± 1.524 23.978 ± 0.053 0.0205 ± 0.0070 0.0299 ± 0.0062 1.00 0.021 3.1970 2.5620 21 50.6782065 −37.2086042 12.383 21.715 ± 0.031 21.675 ± 0.034 23.058 ± 0.035 23.031 ± 0.036 0.0142 ± 0.0029 0.0158 ± 0.0029 0.38 0.021 2.6340 2.1580 21 50.6697109 −37.2097413 12.923 22.549 ± 0.246 22.486 ± 0.062 23.195 ± 0.047 23.176 ± 0.042 0.0186 ± 0.0063 0.0251 ± 0.0034 1.00 0.021 3.5530 2.9190 21 50.6759959 −37.2050817 13.363 23.521 ± 0.167 23.520 ± 0.131 24.861 ± 0.682 25.119 ± 0.255 0.0641 ± 0.0145 0.0818 ± 0.1709 0.27 0.021 2.9890 2.4380 21 50.6740764 −37.2121389 13.491 20.383 ± 0.936 20.409 ± 0.040 21.657 ± 0.260 21.642 ± 0.045 0.0068 ± 0.0046 0.0130 ± 0.0042 0.03 0.021 2.0680 1.6280 21 50.6692610 −37.2093767 13.739 19.078 ± 0.017 19.126 ± 0.007 20.374 ± 0.023 20.420 ± 0.010 0.0472 ± 0.0016 0.0476 ± 0.0007 0.83 0.021 3.1500 2.5470 21 50.6707108 −37.2054256 14.056 22.765 ± 0.195 22.735 ± 0.057 24.041 ± 0.062 24.005 ± 0.057 0.0308 ± 0.0121 0.0369 ± 0.0087 1.00 0.021 1.9190 1.6080 21 50.6768231 −37.2115322 14.087 17.353 ± 0.020 17.335 ± 0.014 18.581 ± 0.011 18.572 ± 0.011 0.0266 ± 0.0022 0.0291 ± 0.0018 1.00 0.021 1.6800 1.2960 21 50.6688347 −37.2083051 14.501 22.060 ± 0.066 22.109 ± 0.032 23.174 ± 0.145 23.411 ± 0.041 0.0746 ± 0.0052 0.0812 ± 0.0197 0.69 0.021 2.5300 2.1020 21 50.6786708 −37.2099702 14.824 22.394 ± 0.353 22.332 ± 0.029 23.573 ± 0.031 23.533 ± 0.031 0.0114 ± 0.0050 0.0179 ± 0.0046 0.46 0.021 1.8010 1.4670 21 50.6785854 −37.2105139 15.464 22.436 ± 0.039 22.377 ± 0.012 23.722 ± 0.523 23.706 ± 0.101 0.0163 ± 0.0023 0.0230 ± 0.0126 1.00 0.021 1.6050 1.2640 Notes. Key to columns—(1) Galaxy identifier; (2)–(3) J2000 R.A. (α) and decl. (δ) in decimal degrees; (4) Galactocentric distance in arcseconds; (5) z850-band model magnitude obtained from the best-fit
PSF-convolved King model and an aperture correction as per Equation (9) in Jordán et al. (2009); (6) z850-band average correction aperture magnitude inferred from a 0 2 aperture and an aperture correction as per Equation
(10) in Jordán et al. (2009); (7) same as (5) but for the g475band; (8) same as (6) but for the g475band; (9)–(10) best-fit half-light radii measured in the z850 and g475bands, respectively; (11) probability that the source is a
GC according to the maximum-likelihood estimate of our asumed mixture model (see Section2in this work and in Jordán et al.2009); (12) foreground E(B − V) assumed for this source. The corrections for foreground reddening were taken to beAg=3.634E B( -V)andAz =1.485E B( -V) in the g and z bands, respectively (see Jordán et al.2004); (13) background in the z850band (counts s−1); (14) background in the g475band
(counts s−1). a
Table2is presented in its entirety as supplemental material. A portion is shown here for guidance regarding its form and content.
b
Table2present the structural and photometrical catalog of all ACSFCS sources that satisfy the selection criteria presented in Section 2.6 in Jordán et al. (2004), modified as described in Section 5.1 of Jordán et al. (2007a), and that have rh>0 0096. To select a sample of bona fide GCs the sources should be restricted to those havingpGC0.5.
(This table is available in its entirety in machine-readable form.)
4 The Astrophysical Journal Supplement Series, 221:13 (5pp ), 2015 November Jordán et al.
through grant IC120009, awarded to The Millennium Institute of Astrophysics, MAS. A.J. acknowledges additional support from BASAL CATA PFB-06.
REFERENCES
Bertin, E., & Arnouts, S. 1996,A&AS,117, 393
Blakeslee, J. P., Jordán, A., Mei, S., et al. 2009,ApJ,694, 556
Côté, P., Blakeslee, J. P., Ferrarese, L., et al. 2004,ApJS,153, 223
Durrell, P. R., Côté, P., Peng, E. W., et al. 2014,ApJ,794, 103
Ferguson, H. C. 1989,AJ,98, 367
Ferrarese, L., Côté, P., Cuillandre, J.-C., et al. 2012,ApJS,200, 4
Ferrarese, L., Ford, H. C., Huchra, J., et al. 2000,ApJS,128, 431
Jordán, A., Blakeslee, J. P., Côté, P., et al. 2007a,ApJS,169, 213
Jordán, A., Blakeslee, J. P., Peng, E. W., et al. 2004,ApJS,154, 509
Jordán, A., Côté, P., Blakeslee, J. P., et al. 2005,ApJ,634, 1002
Jordán, A., McLaughlin, D. E., Côté, P., et al. 2006,ApJL,651, L25
Jordán, A., McLaughlin, D. E., Côté, P., et al. 2007b,ApJS,171, 101
Jordán, A., Peng, E. W., Blakeslee, J. P., et al. 2009,ApJS,180, 54
King, I. R. 1966,AJ,71, 64
Liu, C., Peng, E. W., Jordán, A., et al. 2011,ApJ,728, 116
Masters, K. L., Jordán, A., Côté, P., et al. 2010,ApJ,715, 1419
Mei, S., Blakeslee, J. P., Côté, P., et al. 2007,ApJ,655, 144
Mieske, S., Jordán, A., Côté, P., et al. 2010,ApJ,710, 1672
Puzia, T. H., Paolillo, M., Goudfrooij, P., et al. 2014,ApJ,786, 78
Schlegel, D. J., Finkbeiner, D. P., & Davis, M. 1998,ApJ,500, 525
Villegas, D., Jordán, A., Peng, E. W., et al. 2010,ApJ,717, 603
5