Publisher’s version / Version de l'éditeur:
Journal of Applied Polymer Science, 102, 4, pp. 3391-3399, 2006-11-15
READ THESE TERMS AND CONDITIONS CAREFULLY BEFORE USING THIS WEBSITE. https://nrc-publications.canada.ca/eng/copyright
Vous avez des questions? Nous pouvons vous aider. Pour communiquer directement avec un auteur, consultez la première page de la revue dans laquelle son article a été publié afin de trouver ses coordonnées. Si vous n’arrivez pas à les repérer, communiquez avec nous à [email protected].
Questions? Contact the NRC Publications Archive team at
[email protected]. If you wish to email the authors directly, please see the first page of the publication for their contact information.
NRC Publications Archive
Archives des publications du CNRC
This publication could be one of several versions: author’s original, accepted manuscript or the publisher’s version. / La version de cette publication peut être l’une des suivantes : la version prépublication de l’auteur, la version acceptée du manuscrit ou la version de l’éditeur.
For the publisher’s version, please access the DOI link below./ Pour consulter la version de l’éditeur, utilisez le lien DOI ci-dessous.
https://doi.org/10.1002/app.21556
Access and use of this website and the material on it are subject to the Terms and Conditions set forth at
Very high modulus high-density polyethylene and high-modulus
polypropylene obtained by solid-state roll drawing
Ajji, A.; Dumoulin, M. M.
https://publications-cnrc.canada.ca/fra/droits
L’accès à ce site Web et l’utilisation de son contenu sont assujettis aux conditions présentées dans le site LISEZ CES CONDITIONS ATTENTIVEMENT AVANT D’UTILISER CE SITE WEB.
NRC Publications Record / Notice d'Archives des publications de CNRC:
https://nrc-publications.canada.ca/eng/view/object/?id=84e0cbbd-f768-438c-abf0-015e18b0249a https://publications-cnrc.canada.ca/fra/voir/objet/?id=84e0cbbd-f768-438c-abf0-015e18b0249aSolid-State Roll Drawing
A. Ajji, M. M. Dumoulin
Industrial Materials Institute, National Research Council Canada, 75 De Mortagne, Boucherville, Quebec, Canada J4B 6Y4
Received 26 April 2004; accepted 14 September 2004 DOI 10.1002/app.21556
Published online in Wiley InterScience (www.interscience.wiley.com).
ABSTRACT: This article describes results obtained with a process developed for rolling and drawing simultaneously polymer profiles in the solid state. Solid-state roll drawing has the advantage of being continuous, which allows rela-tively high production rates and the generation of high deformation ratios with some degree of biaxial orientation. The roll-drawing process allows the extent of biaxial orien-tation to be controlled by the adjustment of the tension and compression loads applied to the polymers, in particular semicrystalline thermoplastics. Some experimental results obtained with a four-station roll-drawing apparatus are pre-sented, particularly on high-density polyethylene (HDPE) and polypropylene. The effect of process parameters, such as the gap between the rolls and tension, are discussed.
Aspects discussed also include relaxation; structure devel-opment in terms of orientation and crystallinity as a function of draw ratio (); as a function of process parameters; and finally, mechanical and thermal properties as a function of . Moduli as high as 25 GPa in the longitudinal direction and about 4 GPa in the transverse direction were obtained with successively rolled, initially thick, HDPE profiles. © 2006 Government of Canada. Exclusive worldwide publication rights in the article have been transferred to Wiley Periodicals, Inc. J Appl Polym Sci 102: 3391–3399, 2006
Key words:mechanical properties; orientation; polyethyl-ene (PE); poly(propylpolyethyl-ene) (PP)
INTRODUCTION
The formation of thermoplastic polymers below their melting temperature has been studied for the past 30 years. The induction of high degrees of molecular orientation is clearly the motivation, which in turn will yield significantly modified physical and mechanical properties. The ultra-high-modulus polymer products produced this way, particularly in view of their low density, could fill a niche not attainable by conven-tional structural materials, such as composites and metals, which could overcome the latter’s shortcom-ings, including weight, limited recyclability, variable fiber/matrix adhesion, and poor corrosion resistance. For example, steel is about eight times denser than polyethylene (PE). In fact, the specific modulus, that is, the ratio of the modulus to density, is significantly higher for highly oriented polymers than for metals in general.
Oriented polymers can have very interesting prop-erties from mechanical, impact, optical, and barrier points of view. The first developments in highly
ori-ented polymers were carried out on fibers in the 1970s, which resulted in the commercialization of Kevlar (aromatic polyamide) and Spectra (PE) fibers with tensile moduli and strengths in the vicinity of 200 and 3 GPa, respectively. Both fibers are presently used commercially in various applications. The extension of this approach to the production of larger parts, such as sheets, rods, pipes, and other shapes, is possible through solid-state deformation processes.
Melt-processing operations typically involve large deformations. However, the short relaxation times in the melt do not allow these strains to result in signif-icant molecular orientation in the final solid products. The formation of polymer products in the solid state, on the other hand, due to the very long relaxation time involved, allows high degrees of orientation to be retained in the solid part. Various solid-state forming processes have been explored over the years, includ-ing extrusion, die drawinclud-ing, roll drawinclud-ing, and com-pression.
The roll drawing of polymeric materials has been used to improve their mechanical and optical proper-ties through orientation. The roll drawing of semicrys-talline polymers [e.g., PE, polypropylene (PP), poly-methylene oxide or polyoxypoly-methylene (POM)] has successfully produced high-modulus sheets.1–5 How-ever, the examination of the process and its applica-tion to engineering polymers has been limited. Magill
Correspondence to: A. Ajji ([email protected]).
Journal of Applied Polymer Science, Vol. 102, 3391–3399 (2006) © 2006 Government of Canada. Exclusive worldwide publica-tion rights in the article have been transferred to Wiley Peri-odicals, Inc.
and coworkers6,7studied the structure–property
rela-tionships in rolltruded polymers by measuring the mechanical properties in all three directions of several rolltruded polymers: PP, polyvinylidene fluoride (PVDF), and propylene/ethylene block copolymers. They found that mechanical property enhancement not only occurred in the principal draw direction but also in the transverse and normal directions. Tensile and compressive tests allowed the observation of de-formation bands, anisotropic yielding, and ductile-to-brittle transitions.
Higashida et al.8studied the mechanical properties
of uniaxially and biaxially rolled PE and PP sheets. They found that the tensile strength of the rolled PP sheet, initially elongated by 5 in draw direction and then by 1.5 in the transverse direction, reached almost 100 MPa, a value that was three times as large as that of the initial material in all directions in the plane. This combination of deformations was necessary to get substantially the same rolling elongation in both di-rections: the uniaxially rolled sheets actually thick-ened and shrank somewhat when reheated for biaxial rolling, and the second rolling elongation was, in fact, higher than 1.5. The tendency of molecular orientation corresponded with the tensile strength characteristics of the uniaxially and biaxially rolled sheets. The de-gree of crystallinity of the rolled sheets decreased with increasing rolling elongation.
Chaffey et al.9 compared two orienting techniques
for stiffening PP: rolling and die drawing. Billets of PP were either drawn at 145°C through a tapered slotted die to reduction ratios (R’s) of 2.2, 5.1, and 7.6 or rolled between rolls 65 mm in diameter at 120°C to R’s of 2–5. Drawing increased the crystallinity, as determined from differential scanning calorimetry, density, and wide-angle X-ray diffraction; it disrupted the original PP structure and developed an oriented crystalline structure. Wide-angle X-ray diffraction pole figures showed that both die drawing and rolling oriented the molecular chain axis nearly parallel to the machine direction and the b axis perpendicular to the drawing plane. This approximate uniaxial symmetry was con-firmed by ultrasonic measurements of the stiffness matrix. In tensile and falling-dart impact tests, sam-ples failed by delaminating in the drawing plane. Al-though stresses were applied to the material in quite different ways in die drawing and in rolling, the ge-ometry of deformation in both was similar, close to plane strain.
Morawiec et al.10 reported that it is often observed
that cavitation, due to the plastic deformation of crys-talline polymers, can be suppressed in the process of rolling due to the compressive stress component. To obtain highly oriented polymeric materials, they used unidirectional rolling in a channel formed on the cir-cumference of one roll with another roll, having the thickness matching the depth of the channel. The
side-walls of the channel on one roll constituted the side constraints, whereas the other roll worked like a plunger in a channel-die. Rolling with side constraints is cavity-free and is advantageous over conventional rolling, channel-die compression, and solid-state ex-trusion because it gives the possibility of obtaining relatively thick and infinitely long highly oriented shapes or profiles in a fast and continuous manner. However, no biaxial orientation can be obtained. A few examples of rolling with a rate 4.23 m/min of PP and high-density polyethylene (HDPE) shapes were reported. The tensile strength of the rods rolled to a compression ratio of 5.4 – 6.6 with a final cross section of 10 –12 mm approached 200 MPa for both polymers. The oriented rods of PP and HDPE demonstrated high and sharp textures produced in HDPE by the activity of (100) [001], (010) [001], and (100) [010] crystallo-graphic slips, whereas in PP (010) [001],(110) [001], and (100) [001] slip systems were active. In addition to those slips, twinning modes were active on unloading. The authors concluded that an appropriate combina-tion of rolling rate, temperature, and initial thickness of the rolled bar, as well as the molecular weight of the polymer, would apparently lead to rods with higher strength.
In a more recent series of studies, Bartczak and coworkers11–13 rolled with side constraints thick
HDPE and PP samples (12.5 mm thick) and studied the structure and properties of such deformed sam-ples. They found that the macromolecular chains were highly oriented along the rolling direction, and at high rolling rates, (310) twinning took place because of tensile stress across the bars caused by strain recovery on unloading. For samples deformed to a draw ratio () of 8.3, the ultimate strength exceeded 180 MPa, whereas the unoriented material exhibited a strength of merely 15 MPa. Because of the highly ordered la-mellar structure of the rolled material, the tensile de-formation of the bars along the rolling direction was reversible to a large extent. The oriented bars of PE also demonstrated a very high toughness, especially in the direction of side constraints. Most of the delivered energy was consumed during specimen bending rather than fracture. In contrast to the tensile proper-ties, there was an optimum around 5, for which the impact strength was the highest [similar observations were noted for PP and poly(ethylene terephtha-late)14 –17 and in a review by Galeski18]. Dynamic
me-chanical measurements showed that rolling to a high strains (⬎6) produced not only a well-developed ori-entation of the crystalline component but also a high orientation and transverse ordering of the amorphous phase, which led to the anisotropy of the material properties in the loading direction/constraint direc-tion plane, perpendicular to the rolling direcdirec-tion.
For PP, Bartczak et al. found that deformation pro-cesses by compression in a channel die and by rolling
with side constraints proceeded in very similar fash-ions (plane strain conditfash-ions) and resulted in materials of similar orientations and mechanical properties.13
The difference between the two processes was that rolling caused the destruction of the lamellar structure at a higher strain than compression. Dynamic mechan-ical measurements showed that rolling to a high strain produced not only a well-developed orientation of the crystalline component but also a high orientation and transverse ordering of the amorphous phase, which led to transverse anisotropy, as observed for HDPE. The elastic modulus (E) and ultimate strength mea-sured along the rolling direction increased with in-creasing deformation ratio. For samples deformed to a deformation ratio of 10.4, the ultimate strength reached 340 MPa. The oriented PP also demonstrated a high impact toughness, especially in the direction of side constraints. In contrast to the tensile properties, there was an optimum deformation ratio of around 5, for which the impact strength was the highest, also as observed for HDPE.
Some other studies involved particularly ultra high molecular weight PE,19 where similar deformations
mechanisms as in HDPE were observed for plane strain compressed samples. In particular, it was found that crystalline orientation developed at lower ’s, as compared with HDPE. It also showed a greater resis-tance to deformation and a large elastic recovery.19
In all of these studies, only relatively thin sheets were used (up to 12.5 mm thick). In this article, the solid-state roll drawing of HDPE and PP is discussed. The effect of processing conditions on the production of oriented profiles was investigated for profiles of two different initial thicknesses, 10 and 32 mm. The produced profiles were characterized from both the mechanical and orientation points of view.
EXPERIMENTAL Materials
HDPE and PP thick and flat profiles (Fabco Company, Montreal, Canada) were used for this study. No mo-lecular characteristics were available for the pure res-ins. For HDPE, initial thicknesses of 10 and 32 mm were used, whereas for PP, only 10 mm thick profiles
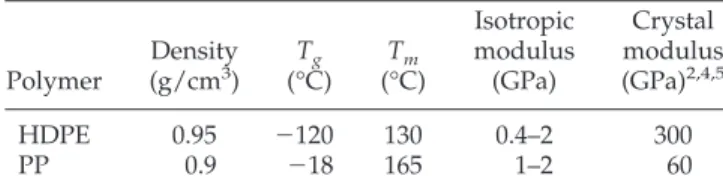
were tested. Table I lists some properties for the HDPE and PP.
Roll drawing
The roll-drawing apparatus consisted of a series of four oil-heated pairs of rolls preceded and followed by controlled temperature tunnels. A schematic of the process, illustrating only two rolling stations, is shown in Figure 1. Roll drawing was performed at 110°C. Profile and roll speeds, gaps between the rolls, tension and compression at the last station, , and tempera-ture were monitored during processing. The draw ratio in the length direction (l) was determined by the
measurement of the distance between two ink marks before and after the process and after complete cooling of the samples to room temperature.
In a first series of experiments, flat profiles (⬃ 1 cm ⫻ 10 cm) of HDPE were prepared by extrusion and then stored for later use in roll drawing. Roll drawing was carried out in a continuous mode with the four rolling stations in series. A second series of experi-ments was conducted to maximize the achievable . This series was carried out in a discontinuous mode with only two rolling stations. The HDPE profiles were thicker (⬃32 mm thick) and were roll drawn in multiple passes through these two rolling stations.
Crystallinity
The crystallinity of the samples with different ’s was determined from differential scanning calorimetry measurements. The crystallinity was calculated as the ratio of the enthalpy measured under the melting peak of the oriented material to that of the corresponding fully crystalline material. The enthalpy of melting of completely crystalline materials was taken as 280 J/g for PE and 209 J/g for PP.20
Figure 1 Schematics of the solid-state roll-drawing process. (1and 2represent the speed of the rolls.)
TABLE I
Some Characteristics of the Polymers Used
Polymer Density (g/cm3) (°C)Tg (°C)Tm Isotropic modulus (GPa) Crystal modulus (GPa)2,4,5 HDPE 0.95 ⫺120 130 0.4–2 300 PP 0.9 ⫺18 165 1–2 60
Tg⫽ glass-transition temperature; Tm⫽ melting
Birefringence
Birefringence measurements were made at room tem-perature with a refractometer in combination with a polarizer to measure the refractive index of the sam-ples in different directions. The contact liquid used was 1-bromonaphthalene, with a refractive index of about 1.63 (well above that of PE). The light source used was a sodium light with a wavelength of 0.5896 m. The second moment of the orientation function (f) was calculated from the birefringence results (⌬n) ac-cording to the following equation (with uniaxial de-formation assumed to a first approximation):
f ⫽3共cos 2兲 ⫺1 2 ⫽ ⌬n ⌬nmax ⌬nmax⫽⌬nc o⫹ 共1 ⫺ 兲⌬n a o
where is the average angle between the chain axis and the draw direction, is the crystalline fraction, and ⌬ncoand ⌬naoare the absolute birefringences for the
crystalline and amorphous phases, respectively.
IR spectroscopy
IR dichroism measurements were made on a Nicolet 170SX Fourier transform infrared (FTIR) spectrometer (Thermoelectron Corp., Madison, WI) at a resolution of 4 cm⫺1in the reflection mode with a low-angle (11°) specular reflection accessory from Spectra-Tech, Inc. (Shelton, CT). Each spectrum was the result of an accumulation of 128 scans. A front-surface gold mirror was used as reference. Drawn samples were mounted with the draw direction perpendicular to the plane of incidence. The beam was polarized by means of a wire-grid polarizer (ZnSe substrate) from Spectra-Tech. Spectra were measured at two orthogonal po-larizations (parallel and perpendicular to the draw direction) without a change in the sample position. The Kramers–Kronig transformation was performed with the commercial software Spectra Calc from Ga-lactic Industries Corp. (Salem, NH), with their Ma-claurin’s series algorithm to perform the integration. The details of the calculations of the dichroic ratio and band assignments are published elsewhere.21,22 f was
calculated according to the equation:
f ⫽D ⫺ 1 D ⫹ 2
2 3 cos2␣ ⫺1
where D is the dichroic ratio (ratio of the parallel to the perpendicular absorbencies) of a vibration corre-sponding to a transition moment making an angle ␣. with the chain axis. The wave number regions of 720 –730 and 1440 –1473 cm⫺1 were considered be-cause they were strong enough to avoid any
uncer-tainties. Only the plane of the rolled sheets were char-acterized (i.e., the machine–transverse (MT) plane), and if any transverse orientation was present, the net effect reduced the MT orientation. The region charac-terized included contributions from both the crystal-line and amorphous regions.23,24
Mechanical properties
The mechanical properties, in the tensile mode, were measured with an Instron tensile tester (Grove City, PA) at room temperature on standard ASTM samples. The drawing speed used for the tests was 5 cm/min, and the longitudinal modulus was determined with an extensometer and averaged over six tests. The transverse results were averaged over three tests with-out with an extensometer.
Thermal conductivity (k)
Directional k was measured with a Mathis Instruments
k probe (Fredericton, Canada), which measures the
directional k in the transient mode without alteration of the samples. The results were averaged over five tests.
RESULTS Process results
The most important factor in solid-state orientation of polymers is the maximum achievable draw ratio (m).
This parameter controls the resulting improvement in properties, as illustrated in Figure 2, which shows the tensile modulus as a function of . The data were gathered from the literature from various authors.25,26
As shown in the graph, the higher the was, the higher the stiffness (and strength) of the oriented ma-terial was. Generally, in our experiments, values in the range of 10 were easily obtained for HDPE (as was also the case for PP). In some cases, a larger was
Figure 2 Tensile modulus as a function of for HDPE, from refs. 15 and 16.
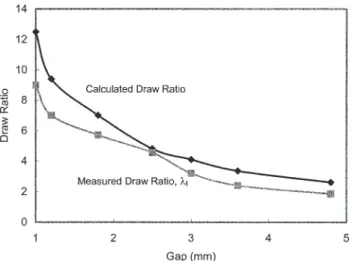
achieved at some point in the process. However, some relaxation and elastic recovery occurred because the deformation was performed at temperatures above the glass-transition temperature of the material, which led to a decrease in of up to 1. For the large defor-mations, differences between the measured and cal-culated draw ratio (c) could sometimes be on the
order of 4 –5.1Figure 3 shows this difference between c and the measured as a function of the gap be-tween the rolls for a typical experiment carried out with HDPE profiles initially 10 mm thick with a con-stant width. The two different ’s plotted were l
(measured), defined as the profile’s final length di-vided by the initial length, and c, defined as the ratio
of the initial profile thickness over the gap between the rolls. Figure 3 shows that lwas systematically lower
than c, an indication that the energy applied to the
material through the roll-drawing process did not en-tirely result in plastic flow. Some of the energy was stored as elastic deformation and recovered as the profile emerged from the rolls.
Similar process data is shown in Figure 4 in terms of various experimental values of plotted as a function of the calculated one. In addition to l, computed
from the puller speed (the ratio of the final puller speed to the initial profile speed) and computed from the profile speed (the ratio of final over initial speed of the profile) are also shown. The data system-atically fell below the diagonal line, confirming the large elastic recovery effects occurring during the pro-cess. In addition, during the trials, the rolls speed was always systematically higher than the profile’s speed, indicating that slippage occurred between the rolls and the deforming material, as shown in Figure 5.
It was possible to overcome the elastic recovery phenomenon by the application of tensile force on the profile emerging from the rolls. Tension, applied through the drawing rolls by increasing their speed, had a significant effect. This is illustrated in Figures 6 and 7. For the same moderate gap between the rolls (e.g., 1.7 mm; Fig. 6.), if low tension values were used, l was lower than t, which indicates that the
defor-mation in the length direction was smaller than in the thickness direction. This was possible because some
Figure 3 as a function of the gap between the rolls.
Figure 4 Experimental as a function of c. The broken
line is a guide for the eye. The full line is the diagonal.
Figure 5 Roll speed and profile speed for different ’s.
Figure 6 Effect of tension on the measured ’s during the roll drawing of HDPE (gap ⫽ 1.7 mm).
deformation took place in the width direction (larger widths were produced), which thus caused some de-gree of biaxial orientation. Larger applied tensions significantly affected lbut had very little effect on the
thickness . At some point, the thickness and l’s were
the same, with the width remaining constant under these conditions. If the tension was increased further, l became larger, and the width of the profile de-creased. The control of tensile force was, therefore, a very important feature of the roll-drawing process. It allowed the achievement of three distinct modes of operation, illustrated as three regions on Figure 6. Zone 1 was characterized by significant biaxial defor-mation, whereas planar deformation took place in zone 2. In zone 3, tension was high enough to cause the deformation to become uniaxial, and necking may have occurred under certain conditions.
For small gaps, however (e.g., 1.00 mm; Fig. 7), the orientation was much larger and could not be com-pensated by tension to achieve different deformation modes. This was due to both the stiffness of the ori-ented profile at a low rolls gap and the slippage be-tween the rolls when the final rolls speed was in-creased.
mvalues attained in this series of experiments were around 8 –9 because of practical constraints in the experimental set-up. However, it is known that higher values can be achieved for polyolefins. Thus, a new series of experiments was planned in an attempt to increase .
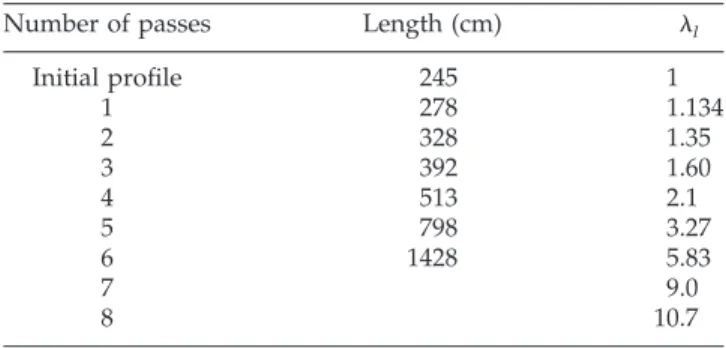
HDPE profiles with an average thickness of approx-imately 32 mm were roll drawn in a discontinuous mode (with only two roll stations and multiple passes). Table II presents the results from a typical test in terms of the resulting at each roll-drawing pass. The ’s reported are in the length direction. Most of the biaxial orientation occurred in the initial deforma-tion steps. Over the course of the tests, machieved at
the test temperature (110°C) was 12.5 in the length direction and 2.2 in the width direction, which yielded
a total deformation of about 27.5. It was not possible to obtain a planar deformation because the loads re-quired were beyond the capabilities of the rolling equipment.
Crystallinity and birefringence
Crystallinity results for HDPE of 10 mm initial thick-ness are presented in Figure 8. A decrease in crystal-linity was first observed at low ’s, up to about 3, followed by a constant increase in crystallinity for higher ’s. This behavior could be explained by the deformation process imposed on the polymer: starting from a spherulitic structure for the crystalline phase, the first stages of deformation did involve a slight deformation of the spherulites followed by their de-struction to yield the structure that was the final struc-ture of the polymer at high deformation ratios. Annis et al.27 showed in a small-angle neutron-scattering study on blends of deuterated and protonated PE that in a range of 1–3, the scattering intensity at a zero angle decreased significantly, indicating a partial melting of the crystalline phase followed by crystalli-zation under stress. Above a of 3, this intensity was almost constant, indicating no further change (or melt-ing). In another study,28involving a detailed
morpho-Figure 7 Effect of tension on the measured ’s during the roll drawing of HDPE (gap ⫽ 1.0 mm).
Figure 8 Crystallinity of roll-drawn HDPE as a function of .
TABLE II
Typical Results from a Discontinuous Drawing of a Thick HDPE Profile
Number of passes Length (cm) l
Initial profile 245 1 1 278 1.134 2 328 1.35 3 392 1.60 4 513 2.1 5 798 3.27 6 1428 5.83 7 9.0 8 10.7
logical investigation of cold-drawn PE materials by Raman spectroscopy and other techniques, a large decrease in the Raman orthorhombic crystallinity was observed. These results suggested an ill-defined or-thorhombic crystalline structure with dislocations and disrupted crystals formed by cold drawing, probably as a result of molecules being pulled through the crystals. The temperature was confirmed as an impor-tant factor in the determination of the crystalline phase recovery of the orthorhombic crystallinity.28 Some other works in literature support the idea of crystallographic slips as the way of rearrangement of the crystalline morphology.29 Basically, it is thought that melting may occur for shear deformations and probably tensile ones, but crystallographic slips occur in compressive deformation.
The results obtained for birefringence between the machine and transverse directions are shown in Fig-ure 9. A constant increase as a function of was observed, except for the last , for which a decrease was observed. This may have been due to an increase in the transverse orientation, which would have had a net effect as a decrease in the MT orientation. A similar behavior was observed from the FTIR results, dis-cussed later. f was determined with a value of 0.063 for the intrinsic birefringence.30The results are presented in Figure 10 together with those obtained from FTIR for the vibrations of 1460 –1473 (␣ ⫽ 79°) and 720 –730 cm⫺1 (␣ ⫽ 90°). Different results were obtained for f.
These could be explained by the different contribu-tions involved in each case. Birefringence results com-prise contributions from both the crystalline and amorphous phases. On the other hand, FTIR results can depict the behavior of either phase, depending on the vibration selected. We readily concluded that the contribution of the crystalline phase in the FTIR re-sults was larger than the weight average of this phase.23,24 In fact, for the 720 –730 cm⫺1 region, the band at 720 had both crystalline (b axis) and amor-phous contributions, whereas the 730-cm⫺1band was due only to crystalline phase (a axis). For the 1460 – 1473-cm⫺1 region, the first part was due to a combi-nation from crystalline phase (b axis) and amorphous phase, whereas the end part of it was due to the crystalline phase only (a axis). It has also been re-ported that the 1460 –1473-cm⫺1vibration region was more sensitive to the crystalline phase than the 720 – 730-cm⫺1 region.23,24 Despite these differences, the three curves showed overall similar behavior.
Figure 9 Birefringence as a function of for HDPE.
Figure 10 f obtained from birefringence and FTIR for
HDPE.
Figure 11 Longitudinal tensile modulus as a function of for roll-drawn HDPE and PP.
Figure 12 Longitudinal tensile strength as a function of for roll-drawn HDPE and PP.
Mechanical properties
The mechanical properties are presented in Figures 11 and 12 in terms of the tensile modulus and strength, respectively, along with earlier results31 for PP for
comparison purposes. Figure 11 shows that over the range of studied here, the modulus for PP and HDPE followed the same dependency as a function of . As shown in Figure 12, the tensile strength showed similar behaviors for both polymers, but the curves in this case did not superimpose. In its isotropic state, PP displayed higher a tensile strength than HDPE, and this difference became accentuated as the polymers were oriented. Moduli and tensile strengths above 10 GPa and 250 MPa, respectively, were readily obtained for the HDPE and PP profiles that were initially 10 mm thick. These values enabled us to consider these materials for new structural applications.
The mechanical properties obtained during the se-ries of experiments conducted with the 32 mm thick profiles are presented in Table III, and some of them are shown in Figure 11. The results include modulus and strength values in the machine and transverse directions. Modulus values in excess of 25 GPa and strengths of 280 MPa in the machine direction were achieved. This performance was achieved without a loss in the transverse properties, which in fact, were improved due to the biaxial orientation. A transverse modulus of 3 GPa and a transverse strength of 3 5 MPa were obtained, which were almost double the values obtained for this HDPE in the isotropic state (1.7 GPa in modulus and 22 MPa in strength). The longitudinal modulus seemed to be higher for the same lthan the
ones reported from literature (Fig. 1). This may have been due to the triaxial orientation nature of the roll-drawn samples and the compressive deformation in-stead of a tensile deformation, which had an incidence on the developed crystalline morphology as discussed previously.
Thermal Conductivity (k)
k is also very sensitive to orientation, crystallinity, and
crystal perfection.32,33The results obtained for the
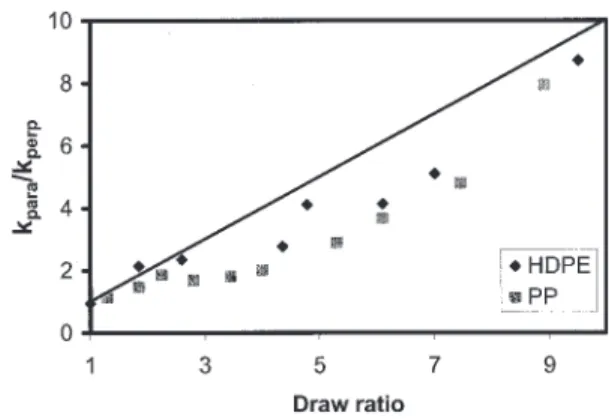
roll-drawn HDPE and PP are presented in Figure 13 in terms of the ratio of the thermal conductivities in the
parallel (k㛳) and perpendicular directions (k⬜; k㛳/k⬜) as
a function of . A slight decrease in k⬜was observed. However, the largest effects (increases) were observed in the draw direction. As shown in Figure 13, k㛳/k⬜
was similar or lower than . For uniaxially drawn rubbers, up to a of 4, k㛳/k⬜ is equal to .32,33 The
difference in behavior observed here might have been due to the slight differences in biaxial orientation ob-served in the roll-drawn samples.
Interestingly, the increase in k㛳/k⬜as a function of
did not level off, contrary to other properties such as birefringence, which showed a plateau at high ’s (generally above about 5). Different models have been used to relate k of oriented polymers to properties of intrinsic constituents (crystalline and amorphous phases). An approach using the aggregate model, sim-ilarly to the models used for E, has been examined32,33
and a similar behavior between k and E was observed (a linear relationship was found for PE).
CONCLUSIONS
A number of semicrystalline polymers were roll drawn with a pilot four-station roll-drawing facility. The results are presented here for HDPE and PP. The results show that roll drawing induced significant in-creases in crystallinity, molecular orientation, and most importantly, mechanical properties. Significant tension had to be applied on the profiles during the drawing process to control the extent of biaxial orien-tation and strain recovery. Moduli as high as 25 GPa in the longitudinal direction and about 3.5 GPa in the transverse direction were obtained with initially thick HDPE profiles.
References
1. Ajji, A.; Dumoulin, M. M. In Solid Phase Processing of Poly-mers; Ward, I. M.; Coates, P. D.; Dumoulin, M. M., Eds.; Hanser: Munich, 2000; Vol. 1, Chapter 7.
2. Ward, I. M. Adv Polym Sci 1985, 70, 1.
Figure 13 k㛳/k⬜as a function of for roll-drawn HDPE
and PP.
TABLE III
Mechanical Properties for Roll-Drawn Thick HDPE Profiles (32 mm)
Modulus (GPa) Tensile strength (MPa) Machine direction Transverse direction Machine direction Transverse direction 9.2 19.4 3.00 280.0 39.2 11.8 25.7 3.30 280.0 35.0 12.5 20.1 3.55 300.0 29.1
3. Yang, J.; Chaffey, C. E.; Vancso, G. J. Plast Rubber Compos Proc Appl 1994, 21, 201.
4. Zachariades, A. E.; Porter, R. S. The Strength and Stiffness of Polymers; Marcel Dekker: New York, 1983.
5. Zachariades, A. E.; Porter, R. S. High Modulus Polymers; Marcel Dekker: New York, 1988.
6. Berg, E. M.; Sun, D. C.; Magill, J. H. Polym Eng Sci 1989, 29, 715. 7. Sun, D. C.; Berg, E. M.; Magill, J. H. Polym Eng Sci 1990, 30, 635. 8. Higashida, Y.; Watanabe, K.; Kikuma, T. ISIJ Int 1991, 31, 655. 9. Chaffey, C. E.; Taraiya, A. K.; Ward, I. M. Polym Eng Sci 1997,
37, 1774.
10. Morawiec, J.; Bartczak, Z.; Kazmierczak, T.; Galeski, A. Mater Sci Eng A 2001, 317, 21.
11. Bartczak, Z. J Appl Polym Sci 2002, 86, 1396.
12. Bartczak, Z.; Morawiec, J.; Galeski, A. J Appl Polym Sci 2002, 86, 1405.
13. Bartczak, Z.; Morawiec, J.; Galeski, A. J Appl Polym Sci 2002, 86, 1413.
14. Chapleau, N.; Mohanraj, J.; Ajji, A.; Ward, I. M. Polymer 2005, 46, 1956.
15. Mohanraj, J.; Chapleau, N.; Ajji, A.; Duckett, R. A.; Ward, I. M. Polymer 2005, 46, 1967.
16. Mohanraj, J.; Chapleau, N.; Ajji, A.; Duckett, R. A.; Ward, I. M. J Appl Polym Sci 2003, 88, 1336.
17. Mohanraj, J.; Chapleau, N.; Ajji, A.; Duckett, R. A.; Ward, I. M. Polym Eng Sci 2003, 43, 1317.
18. Galeski, A. Prog Polym Sci 2003, 28, 1643.
19. Boontongkong, Y.; Cohen, R. E.; Spector, M.; Bellare, A. Polymer 1998, 39, 6391.
20. Wunderlich, B. Polym Eng Sci 1978, 18, 431.
21. Cole, K. C.; Gue`vremont, J.; Ajji, A.; Dumoulin, M. M. Appl Spectrosc 1994, 48, 1513.
22. Gue`vremont, J.; Ajji, A.; Cole, K. C.; Dumoulin, M. M. Polymer 1995, 36, 3385.
23. Cole, K. C.; Ajji, A. In Solid Phase Processing of Polymers; Ward, I. M.; Coates, P. D.; Dumoulin, M. M., Eds.; Hanser: Munich, 2000; Chapter 3.
24. Desper, C. R. J Appl Polym Sci 1969, 13, 169.
25. Ward, I. M. In Solid Phase Processing of Polymers; Ward, I. M.; Coates, P. D.; Dumoulin, M. M., Eds.; Hanser: Munich, 2000; Chapter 5.1.
26. Lemstra, P. J.; Bastiaansen, C. W. M.; Peijs, T.; Jacobs, M. J. N. In Solid Phase Processing of Polymers; Ward, I. M.; Coates, P. D.; Dumoulin, M. M., Eds.; Hanser: Munich, 2000; Chapter 5.3. 27. Annis, B. K.; Strizak, J.; Wignall, G. D.; Alamo, R. G.;
Mandelk-ern, L. Polymer 1996, 37, 137.
28. Lagaron, J. M.; Dixon, N. M.; Reed, W.; Pastor, J. M.; Kip, B. J. Polymer 1999, 40, 2569.
29. Galeski, A.; Bartczak, Z.; Argon, A. S.; Cohen, R. E. Macromol-ecules 1992, 25, 5705.
30. Pietralla, M. J Polym Sci Polym Phys Ed 1982, 20, 1193. 31. Ajji, A.; Legros, N.; Dumoulin, M. M. Adv Perform Mater 1998,
5, 117.
32. Greig, D. In Development in Oriented Polymers; Ward, I. M., Ed.; Applied Science: Essex, England, 1982; Vol. 1.
33. Mergenthaler, D. B.; Pietralla, M.; Roy, S.; Kilian, H. G. Macro-molecules 1992, 25, 3500.