Publisher’s version / Version de l'éditeur:
Vous avez des questions? Nous pouvons vous aider. Pour communiquer directement avec un auteur, consultez la première page de la revue dans laquelle son article a été publié afin de trouver ses coordonnées. Si vous n’arrivez pas à les repérer, communiquez avec nous à PublicationsArchive-ArchivesPublications@nrc-cnrc.gc.ca.
Questions? Contact the NRC Publications Archive team at
PublicationsArchive-ArchivesPublications@nrc-cnrc.gc.ca. If you wish to email the authors directly, please see the first page of the publication for their contact information.
https://publications-cnrc.canada.ca/fra/droits
L’accès à ce site Web et l’utilisation de son contenu sont assujettis aux conditions présentées dans le site LISEZ CES CONDITIONS ATTENTIVEMENT AVANT D’UTILISER CE SITE WEB.
15th International Symposium on Unmanned Untethered Submersible Technology [Proceedings], 2007
READ THESE TERMS AND CONDITIONS CAREFULLY BEFORE USING THIS WEBSITE. https://nrc-publications.canada.ca/eng/copyright
NRC Publications Archive Record / Notice des Archives des publications du CNRC :
https://nrc-publications.canada.ca/eng/view/object/?id=6a311b66-9ad2-44f2-9c9a-260c9a73bce8 https://publications-cnrc.canada.ca/fra/voir/objet/?id=6a311b66-9ad2-44f2-9c9a-260c9a73bce8
Archives des publications du CNRC
This publication could be one of several versions: author’s original, accepted manuscript or the publisher’s version. / La version de cette publication peut être l’une des suivantes : la version prépublication de l’auteur, la version acceptée du manuscrit ou la version de l’éditeur.
Access and use of this website and the material on it are subject to the Terms and Conditions set forth at
Working towards ice profiling using underwater gliders: operational experience in Western Greenland (69°13?17? N 51°5?40?W)
Working Towards Ice Profiling Using Underwater Gliders:
Operational Experience In Western Greenland
(69°13’17” N 51°5’40”W)
Ralf Bachmayer Brad de Young David M. Holland
Institute for Ocean Technology Physics and Physical Oceanography
Courant Institute of Mathematical Sciences National Research Council
Canada Memorial University New York University St. John’s, NL A1B 3T5 St. John’s, NL A1B 3X7 New York, NY 10012
Canada Canada USA
Ralf.Bachmayer@nrc.ca bdeyoung@physics.mun.ca holland@cims.nyu.edu
Abstract
This paper reports on the operational experience using a Slocum underwater
glider in mouth of the Ilulissat Fjord, Western Greenland.
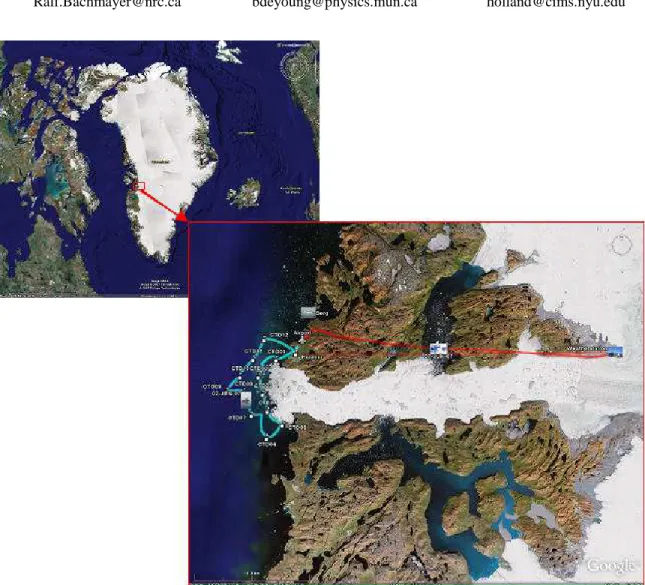
The goals of this year’s deployment were to determine the feasibility of using a Figure 1: Deployment area at the Ilulissat Fjord, Greenland. Tracks at the mouth of the Fjord connect CTD stations; single track to the glacier face is Helicopter path to the weather station.
glider in partially ice-covered waters. We conducted a series of water profiling missions to a depth of up to 150m, revealing some interesting features in the water column.
Furthermore the feasibility of using gliders to profile icebergs using an upward looking sonar was partially demonstrated. In the absence of a dedicated ice-profiling sonar the glider’s altimeter was modified on site to perform this mission.
Both types of missions were successfully concluded, i.e. the glider was retrieved, and gave some valuable insight for future deployments.
1 Introduction
The ice front in Ilulissat fjord has been retreating quite dramatically for more then ten years. Many other Northern Hemisphere glaciers are also showing relatively sudden changes in movement making this very much more than simply a local issue (Joughin et al. 2004). Two possible explanations have been offered for the observed changes in glacier movement, both tied to regional and global warming (Thomas et al. 2003). The first is related to increases in air temperatures, which have been observed in Greenland, leading to enhanced surface melting. The melt water is presumed to reach the base of the glacier and leading to acceleration of the glacier. Another possibility is that increased ocean water temperatures, which are observed outside of Ilulissat fjord have led to increased melting at the base of the glacier in the fjord. This project is designed to address the second hypothesis, that ocean warming is primarily responsible for the observed changes in glacial dynamics.
Because of the permanent ice cover in the fjord, no measurements of temperature, depth and salinity have been made inside the fjord since the late 19th century
(Hammer 1883). Until now, the bathymetry of the fjord has been unknown, although it is assumed that there exists a 200m deep sill at the mouth of fjord, blocking the exit of large icebergs, which then sit grounded on the sill and block the outflow of the brash iceberg ice. Thus for much of the year the entire fjord is covered with a mixture of iceberg ice and sea-ice. There are also no previous records about the bathymetry inside the fjord, but it was assumed to drop off to as much as 1000m below sea level towards the head of the fjord.
This initiative had several broad goals. The first was to establish a permanent autonomous meteorological station near the face of the glacier. The second was to make depth and water property measurements in the fjord, from the mouth to the head. The third goal was to make water property and velocity measurements just outside the mouth of the fjord. As ice conditions inside the fjord can change quite rapidly the field plans had to be kept flexible in order to accommodate these fast changing operational conditions.
A core operational plan for sampling was developed based upon the average ice-conditions that have been observed over the past few years (see Fig. 1). The oceanographic instruments available for sampling include a CTD for vertical profiling, a portable depth sounder, an ADCP for water velocity measurements and a Slocum electric glider for spatial water property measurements. A fourth, somewhat independent goal of the work, was to use the glider to make underwater profile measurements of selected icebergs. While this environment is particularly challenging, the potential for gliders to provide water property data, and data on icebergs, is quite significant. The remainder of this article will be concerned
with the use of a glider during this field experiment.
2 Glider Deployment
2.1 Ballasting and testing of glider
Underwater gliders are driven by a buoyancy engine that allows the glider to change its weight in water from negative to positive and vice versa. This change in weight together with a set of attached wings allows the glider to move in a saw tooth pattern through the water column. The capacity for the SLOCUM glider to change its weight is +/-250cm3 or +/-0.5% of its total displacement. This puts severe limitations on the capabilities of gliders to overcome large density differences in the water column. The density difference of
approximately 2.5% between fresh and salt water is of great concern for operations at the mouth of a glacier fed fjord.
Due to operational constraints the glider had to be prepared for operations “out-of-the-box” in Newfoundland. We used a best estimate of the seawater density and temperature in the operational area and trimmed the glider accordingly to an average density of 1025 kg/m3. Prior to launch the water density estimate had been confirmed by ship based CTD measurements.
Before commencing fully autonomous operations in this new environment we went through a sequence of tethered missions, in which the glider was attached to a small float on a thin neutrally buoyant 30m rope. During these first test missions
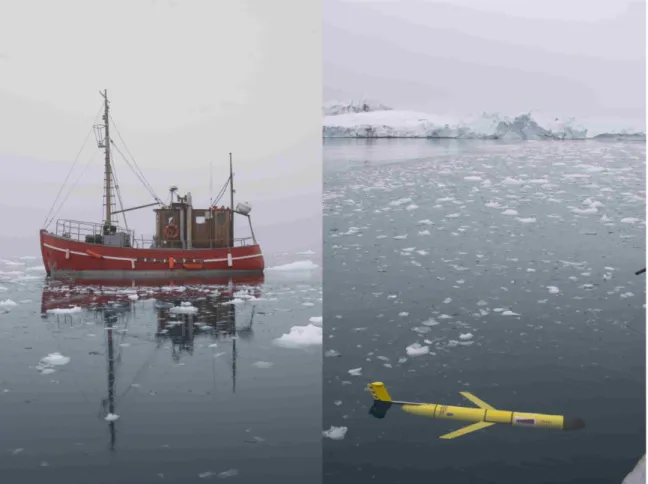
Figure 2: Vessel Clane (left) used for glider operations, CTD and ADCP measurements. Slocum Electric glider (right) at the surface.
proper dive performance and functionality of the software safeguards was established. Due to the unknown strength and direction of subsurface currents and the proximity (100’s of meters) of large and small icebergs the attached float also allowed us to follow the gliders path and if necessary “manually abort” the mission. Launch and recovery was done using the Vessel Clane, Fig. 2 and a Zodiac tender.
Another concern for operations was fast moving brash ice on the surface. Areas that were previously ice-free became rapidly covered with brash ice (O(30min)). During our test missions however we established the glider is able to “break” through the thin brash and establish reliable communication using its Iridium or RF radio connection. Magnetic declination at the area of operation was about 35°W and did not seem to interfere with glider operations.
2.2 CTD profiling
Figure 3: Temperature and Salinity plot for four dives.
The main task for the glider operations was to establish a safe, low risk envelop of operations in this environment. While we were satisfied with the test results from tethered operations in terms of flight and navigational performance, the threat of fast moving brash and the proximity of icebergs was interfering with autonomous
operations on the scale of hours or even days. The presence of large variations in direction and strength of underwater currents was obvious from the relative motion of different ice patches. These complications restricted the missions to single yo missions in ice-free areas.
Figure 4: Salinity-depth and Temperature-depth plot for the two deep dives (up and down cast).
Instead of using the usual waypoint navigation mode, we chose to fly the gliders in a local coordinate system, i.e. the origin at the current glider surface location. The glider successfully concluded a number of 50m dives before descending to 150m. During these operations the glider managed to break through some brash ice moving in and the biggest threat was a speedboat passing close to the glider while on the surface.
Data from these dives revealed an interesting water column-structure that shows high spatial variability of the water near the mouth of this fjord. Fig. 3 and Fig. 4 shows some of the data collected from these dives. The differences between the dives as seen in the data occur on a spatial scale of 100’s of meters emphasizing the importance and need for not only vertical but also horizontal sampling in such a complex system.
2.3 Iceberg profiling
Iceberg profiling is of great interest for iceberg drift predictions and for iceberg management, i.e. iceberg towing operations. Knowing the underwater shape and geometry is important both for drift modelling and for risk assessment when oil facilities, or other bottom mounted systems, are present, We wanted to take advantage of the enormous number of icebergs present in the area. They provided the first real opportunity to test the feasibility of using an underwater glider to obtain a coarse iceberg profile.
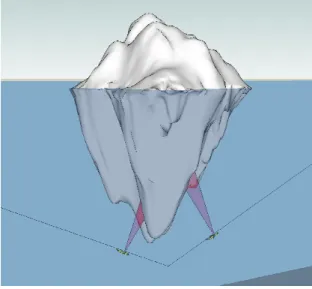
2.3.1 The Plan
The concept as illustrated in Fig. 5 was to fly a glider with an upward looking single beam sonar under a free-floating iceberg. The glider could perform several crosses under the berg and build up a coarse map of the submerged side of the berg. The plan was to use a modified ice profiling sonar from ASL Environmental Sciences as an independent payload sensor on the glider. However the modifications to the sonar and the development of the associated software for the glider took
longer than expected and the instrumentation package was not ready in time for this deployment.
2.3.2 The Modifications
Due to the unavailability of the sonar the plan had to be modified. The Slocum glider has a downward looking altimeter with a detection range of up to 100m. The sonar is build to point forward from the vertical with a fixed angle of nominally 26°, see Fig. 6. Since the gliders are usually flown at a default pitch angle of 26°, the reported ranges from the sonar during the downward flight correspond to the vertical distance from a sonar target, i.e. the ocean floor. To change the altimeter from downward looking to upward looking the sonar head was rotated by 180°, see Fig. 6. While the mechanical changes were straightforward, the software changes proved to be challenging. Since the sonar is embedded in the glider control software and changing the software in the field was not an option the glider had to be tricked to turn on the sonar and to record the data without reacting to the recorded altitudes. Setting the turn-around-altitude to a small value was expected to accomplish this task. The glider trajectory was to be selected such that it never would get closer than that distance from a sonar target.
Figure 5: Iceberg profiling using an underwater glider with profiling single beam sonar.
Figure 6: Modified Slocum glider without nose cap. Altimeter is shown upward looking.
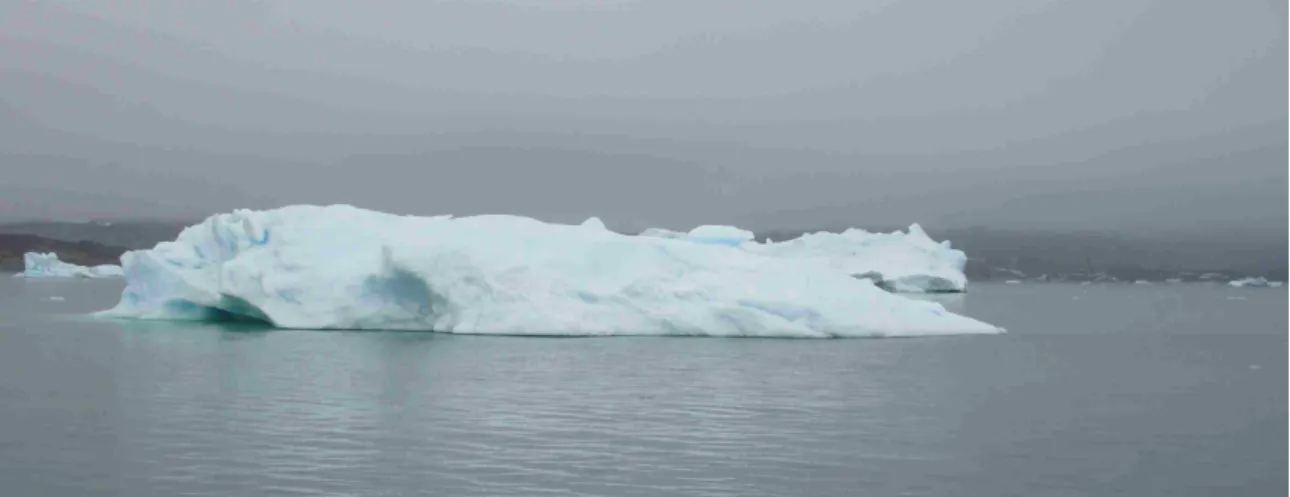
2.3.3 The Berg
In order to accommodate the changes to the glider configuration an iceberg of a suitable size had to be selected. The requirements for the test were that it had to be a berg that was free floating with sufficient open water around it. The water depth around the iceberg had to exceed 100m in order to perform a single yo (down-up motion) underneath the berg without the risk of a sea-floor collision. Figure 7 shows the iceberg that was chosen. The iceberg was estimated to have between 12000-15000t of displacement and a maximum waterline length of 30m. The planned mission for the glider was to glide to a depth of 90m towards a waypoint southeast of the launch location. Launch point and path were chosen to make use of a southeasterly current in the area and to safely clear the estimated maximum draft of about 60m (El-Tahan et al., 1982).
2.3.4 The Mission
The glider started its dive to a depth of 90m but turned around prematurely to get trapped under the iceberg at a depth of 15.4m (see Fig. 8). The glider was sitting underneath the berg and was being pushed along the current and finally surfaced on the other side of the berg. After looking at
the sonar records and the glider log file it was established that: The sonar had gotten valid returns from the water surface, see Fig. 8 (bottom), that were sufficiently long not to trigger the bottom avoidance as planned, however at some point the glider received a number of sonar ranges it didn’t consider valid and decided based on the last good range and its own increasing depth that the bottom must be close and decided to turn around, which caused the glider to get stranded under the iceberg. The glider then detected that it was stuck moving up vertically and attempted to dive again, however do some yet underdetermined reason is did not start to dive even with negative buoyancy. This triggered a stuck vertically on the way down behaviour that set the water-depth to the current glider depth resulting in getting stuck until the sonar picked up good ranges and the glider was able to dive again, clearing the iceberg and surfacing on the other side.
Figure 8 shows a brief summary of the dive path with the “exact” depth of the iceberg along the path of the glider.
Figure 7: Iceberg chosen for profiling experiment. Dimensions (approx.): L 30m x W 15m x H 4m (above waterline).
2.4 Lessons learned and future
work
The use of underwater vehicles and in particular autonomous underwater vehicles, such as gliders has great potential for oceanographic research in this environment. Based on the insight gained from these first field trials, a set of necessary tools and algorithms have to be developed to conduct routine and possibly sustainable operations in partially and fully ice-covered regions. The development of algorithms that allow the vehicle to find open-water areas or areas of thin ice-cover (Fissel et al. 2002) are essential for successful operations. For fully ice-covered regions the biggest obstacle is reliable and accurate underwater navigation. Multi-path problems and acoustic shadowing in the fjord make it an
extremely challenging undertaking for acoustic navigation. Furthermore these large, slow moving icebergs, together with the associated occasional catastrophic events, such as overturning or breaking up, present magnificent challenges to underwater vehicle operations.
To conclude this section, since a system cannot be designed to deal with all eventualities in this harsh environment, one has to be prepared to lose the equipment. Cost of the equipment, launch and recovery and the value of the data become major factors that have to be put into the equation.
3 Acknowledgements
We gratefully acknowledge the support of Jack Foley from Memorial University, Denise Holland from New York University and the support staff from Veco Polar Figure 8: Glider path, depth in meters versus mission time in seconds. The glider started to dive but then turned around at 30m depth to stay under the iceberg until starting to dive again and surface.
Services. We would also like to thank the National Science Foundation, the Natural Sciences and Engineering Research Council of Canada and the National Research Council of Canada for supporting this project.
4 References
Hammer, R.R.J. 1883. Undersogelser ved Jakobshavn Isfjord og naermeste omegen I vinteren 1879-80. Meddr. Gronland, 4(1), 67 pp.
Joughin, I., W. Abdalati and M. Fahnestock. 2004. Large fluctuations in speed on Greenland’s Jakobshavn Isbrae Glacier. Nature 432, 608-610. doi: 10.1038/nature03130.
Thomas, R., W. Abdalati, E. Frederick, W. Krabill, S. Manizade and K, Steffen. 2003. Investigation of surface melting and dynamics thinning on Jakobshavn Isbrae, Greenland. J. Glaciol, 49, 231-239.
EL-Tahan, M., H. EL-Tahan. 1982. Estimation of iceberg draft. OCEANS 1982, Vol.14, 689- 695.
Fissel, D. B., j. R. Marko and H. Melling. 2002. Identifying Skylites” for AUV Operations under Pack Ice: Insights from Ice-draft Profiling by Moored Sonar. Proceedings OCEANS 2002, Biloxi, USA. October 2002.