Publisher’s version / Version de l'éditeur:
The Journal of Chemical Thermodynamics, 44, 1, pp. 13-19, 2011-08-27
READ THESE TERMS AND CONDITIONS CAREFULLY BEFORE USING THIS WEBSITE.
https://nrc-publications.canada.ca/eng/copyright
Vous avez des questions? Nous pouvons vous aider. Pour communiquer directement avec un auteur, consultez la
première page de la revue dans laquelle son article a été publié afin de trouver ses coordonnées. Si vous n’arrivez
Questions? Contact the NRC Publications Archive team at
[email protected]. If you wish to email the authors directly, please see the first page of the publication for their contact information.
NRC Publications Archive
Archives des publications du CNRC
This publication could be one of several versions: author’s original, accepted manuscript or the publisher’s version. / La version de cette publication peut être l’une des suivantes : la version prépublication de l’auteur, la version acceptée du manuscrit ou la version de l’éditeur.
For the publisher’s version, please access the DOI link below./ Pour consulter la version de l’éditeur, utilisez le lien DOI ci-dessous.
https://doi.org/10.1016/j.jct.2011.08.021
Access and use of this website and the material on it are subject to the Terms and Conditions set forth at
Molecular simulation of non-equilibrium methane Hydrate
Decomposition.
Bagherzadeh, S. Alireza; Englezos, Peter; Alavi, Saman; Ripmeester, John
A.
https://publications-cnrc.canada.ca/fra/droits
L’accès à ce site Web et l’utilisation de son contenu sont assujettis aux conditions présentées dans le site LISEZ CES CONDITIONS ATTENTIVEMENT AVANT D’UTILISER CE SITE WEB.
NRC Publications Record / Notice d'Archives des publications de CNRC:
https://nrc-publications.canada.ca/eng/view/object/?id=7d76d430-0601-4f36-9cb8-3983482c477e https://publications-cnrc.canada.ca/fra/voir/objet/?id=7d76d430-0601-4f36-9cb8-3983482c477e
Molecular Simulation of Non-equilibrium Methane Hydrate Decomposition
S. Alireza Bagherzadeh,aPeter Englezos,aSaman Alavi,*band John A. Ripmeester*b aDepartment of Chemical and Biological Engineering,
University of British Columbia, Vancouver, British Columbia V6T 1Z3 Canada and
bSteacie Institute for Molecular Sciences, National Research Council of Canada,
100 Sussex Dr., Ottawa, Ontario K1A 0R6 Canada
Contact Information:
E-mail: [email protected]; [email protected](PI) Phone: 1-613-993-2011
Abstract
We recently performed constant energy molecular dynamics simulations of the endothermic decomposition of methane hydrate in contact with water to phenomenologically study the role of mass and heat transfer in the decomposition rate [ Alavi, Ripmeester, J. Chem. Phys. 132 (2010) 144703]. We observed that, with the progress of the decomposition front temperature gradients are established between the remaining solid hydrate and the solution phases. In this work, we provide further quantitative macroscopic and molecule level analysis of the methane hydrate decomposition process with an emphasis on elucidating microscopic details and how they affect the predicted rate of methane hydrate decomposition in natural methane hydrate reservoirs. A quantitative criterion is used to characterize the decomposition of the hydrate phase at different times. Hydrate dissociation occurs in stepwise fashion with rows of sI cages parallel to the interface decomposing simultaneously. The correlations between decomposition times of subsequent layers of the hydrate phase are discussed.
Keywords: clathrate hydrate dissociation, methane hydrate, molecular dynamics, hydrate phase equilibrium.
1. Modeling Methane Hydrate Dissociation
Understanding the mechanism of methane hydrate decomposition under conditions similar to those of the hydrate sediments found on continental margins, under the ocean floor, and under the permafrost in the Arctic can assist in designing controlled methane recovery processes.[1-4] A sustained method of methane extraction from hydrate reservoirs is yet to be established as hydrates become unstable when heated or depressurized and this can lead to uncontrolled hydrate decomposition and catastrophic methane release. Opposing the uncontrolled decomposition of the hydrate is the endothermic nature of the hydrate crystal dissociation. Experimental calorimetric measurements show that methane structure I (sI) clathrate hydrate has a heat of dissociation per mole of released methane gas of 18.13 0.27 kJ/mol at 273 K and 101 kPa where the hydrate phase decomposes to ice and methane gas [5] and 54.4 1.4 kJ/mol at 292 K over a range of pressures up to 20 MPa where the hydrate decomposes to water and methane gas.[6] The difference between the two values agrees well with the latent heat of ice melting which is 6.01 kJ/mol H2O. In order to sustain the hydrate
decomposition process, a source of heat must be continually provided.
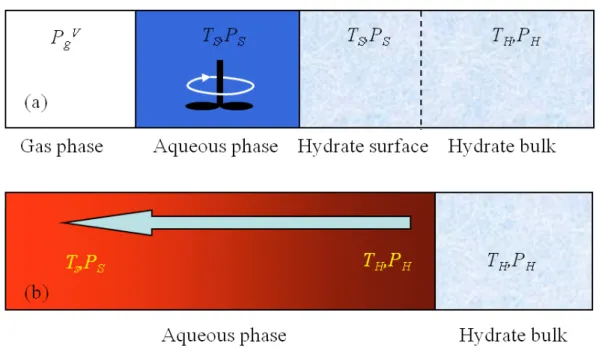
A class of macroscopic reservoir models for methane hydrate decomposition are based on the intrinsic reaction kinetics mechanism.[3,4,7-10] The macroscopic layout assumed in the intrinsic reaction kinetics mechanism is shown in Figure 1. The intrinsic kinetics model assumes that at the water-hydrate contact surface during hydrate decomposition, the solid hydrate and water phases have the same temperature TS. In the intrinsic kinetics
picture, if the temperature TS is higher than the equilibrium temperature TH at the phase
temperature ΔT = TS– TH drives the hydrate dissociation. The surface temperature TSis
maintained by thermostating the aqueous phase in contact with the hydrate surface. However, we know that solid hydrate does not exist at a temperature above its three-phase equilibrium curve, and having a superheated hydrate three-phase at TS with the over
temperature ΔT is not realistic. The intrinsic reaction kinetics mechanism treats the hydrate dissociation as being analogous to an isothermal gas-phase chemical reaction and assumes the hydrate decomposition rate, dnH/dt, is proportional to the difference in
methane gas fugacity between the solid methane hydrate phase, fhydrate (determined by
pressure PHin Figure 1), and the non-equilibrium water-methane mixture at the interface,
V g f (determined by pressure V g P in Figure 1), ) ( hydrate V g HS d H k A f f dt dn (1) where kdis the intrinsic rate constant for the hydrate decomposition and AHSis the hydrate
surface area per unit hydrate volume [10]. The hydrate decomposition is furthermore assumed to be an activated process with the decomposition rate constant having an Arrhenius-type temperature dependence with an activation energy of Eactwhich must be
provided before methane gas can be released from the hydrate, ) / exp( act 0 S d d k E RT k . (2)
In this model, the hydrate decomposition is not explicitly limited by heat or mass transfer to the interface which is assumed to occur at a rate faster than the activated hydrate decomposition processes. In practice, the rate of hydrate decompositions is measured in a stirred reactor. The decomposition rate is measured as a function of reactor stirring speed and when the rate no longer depends on this speed (at stirring speeds > 400 rpm), the
decomposition is assumed to be governed by the “intrinsic rate” i.e. absence of heat and mass transfer resistances. Thus, it is assumed that there is no thermal resistance between the aqueous and hydrate phases. One problem noted with the implementation of the intrinsic kinetics model is that the specific parameters associated with the model (such as the activation energy in Eq. (2)) are dependent on the specific laboratory set-up. The activation energy for the methane hydrate decomposition determined from fitting experimental data to the intrinsic kinetics equation is determined to be significantly higher (78 kJ/mol CH4) [8] than the heat of decomposition of the clathrate (54.4 kJ/mol).
Kinetic modeling where the intrinsic kinetics are coupled with heat transfer from the liquid water to the decomposing hydrate interface have been proposed.[2] However, the predictions are often not transferable to experimental set-ups other than those used to parameterize the formulas.
The assumed isothermal decomposition of the hydrate subject to an over temperature of ΔT in the intrinsic kinetics mechanism, however, is not consistent with the physics of the phase transition. In reality, unless the solid hydrate / aqueous solution / methane gas are at the three-phase equilibrium boundary, the temperature of the solid hydrate phase will be different from the aqueous phase it is in contact with. This is analogous to ice (with a maximum temperature of 0°C) being in contact with water at different temperatures under non-equilibrium conditions. The water in contact with the ice can be at different temperatures, but the ice will always be at a maximum temperature of 0°C prior to melting. The temperature gradient between the water phase in the environment and solid hydrate phases prevents us from modeling the non-equilibrium decomposition process in a manner analogous to an isothermal gas phase chemical reaction.
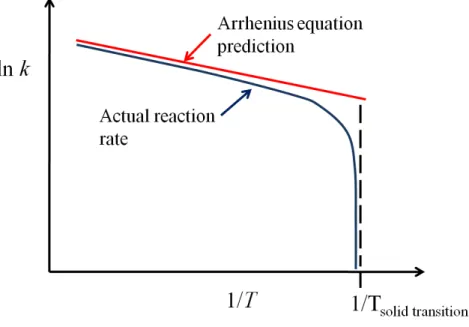
Although ice melting rates can superficially be fit to the Arrhenius equation, they show large deviations from linear ln(k) vs. 1/T behaviour upon approaching the melting point where the rate goes to zero and ln(k) asymptotically approaches infinity. [11] We postulate that similar behaviour will be observed in temperature-driven hydrate decomposition upon approaching the hydrate phase boundary.
We recently performed molecular dynamics simulations of the decomposition of methane hydrate in contact with aqueous phase at three temperatures. [12] A more realistic picture of the hydrate decomposition is provided by Figure 1(b) where the hydrate phase is maintained at a temperature of TH throughout the decomposition process
and the aqueous phase has a temperature gradient ranging from THat the hydrate surface
to TSin the bulk aqueous phase away from the hydrate. A pressure gradient may also be
established as methane gas is released at the hydrate surface and diffuses to the aqueous solution. With a change in pressure on the hydrate / aqueous system, the hydrate phase temperature may change from TH to some other temperature T (corresponding to the H
new pressure) on the phase boundary.
The microscopic (atomic scale) picture of the decomposing hydrate phase in contact with the aqueous phase is shown in Figure 3. The hydrate phase is shown in the middle of the figure and the decomposing hydrate surface in contact with the aqueous phase with methane gas can be observed in detail.
Previous computational studies of methane hydrate dissociation simulate the solid hydrate and water + methane gas phases under imposed isothermal conditions with molecular dynamics thermostats (usually within the modified Nosé-Hoover implementation).[13] The temperature of the hydrate + aqueous phase simulation box is
chosen at a value of TSwhich is larger than the equilibrium three-phase temperature TH
giving the hydrate an over temperature. In such simulations, temperature gradients cannot be established between the solid hydrate and neighboring water phase during clathrate decomposition as molecular velocities are readjusted at regular time intervals to maintain the temperature at the required value. In reality, for the endothermic hydrate decomposition, thermal gradients can slow the rate of further decomposition of the clathrate phase and heat transfer from the bulk liquid to the surface is required if clathrate decomposition is to continue. Imposing isothermal conditions on the simulation will not capture this effect. Experimentally, rigorously stirring the aqueous phase may remove some effects of the thermal gradient between the two phases, but due to the molecule-scale nature of the thermal gradient and no-slip boundary conditions, the temperature gradients will persist. English and Phelan recognize the limitation of isothermal simulations in realistically describing methane clathrate decomposition. [14]
The Gibbs’ phase rule states that the degrees of freedom, F, for a system with C components and P phases in a system are given by,
F = C – P +2. (3)
For a decomposing solid methane hydrate phase in contact with the saturated aqueous methane solution and gaseous methane phase, there is F = 2 – 3 + 2 = 1 degree of freedom. Having chosen the pressure of the decomposition, the temperature of equilibrium is predetermined and is not an independent variable. This means that if a sample of hydrate is put into contact with a thermostated aqueous phase at and arbitrary over-temperature TO and ambient pressure, the aqueous phase cannot be in thermal
decomposition must reflect the non-equilibrium nature of the system. Under these conditions, it would not be correct to use an equilibrium “intrinsic kinetics” picture for the decomposition of the hydrate phase since this model assumes the hydrate and aqueous phases are both at the over-temperature TO. The hydrate under these conditions would be
superheated, which does not correctly reflect the state of the hydrate in contact with water, which will also be on the hydrate/water phase boundary.
The above analysis motivated us to perform constant volume–constant energy (NVE) molecular dynamics simulations to explicitly observe the establishment of heat and mass transfer during clathrate hydrate decomposition. In the NVE simulations, the initial temperature of the hydrate + aqueous system is set at some value Ti, after which the
system is isolated and allowed to evolve without interference from a thermostat. We believe thermostated NpT or NVT simulations which “equilibrate” the temperature between the hydrate phase and the aqueous phase do not correctly simulate the hydrate decomposition process. These simulations are still one step far from reality since the initial temperature of the hydrate is still not equal to the value of THand the temperature
of the water and hydrate phases are considered equal. In MD simulations (as opposed to Monte Carlo simulations) we do not presently have a straightforward way of maintaining the aqueous and hydrate phases at different temperatures, particularly since the hydrate phase is decomposing and methane gas is being released into the aqueous phase. The present simulations do however demonstrate the establishment of temperature gradients and are a step towards greater realism in modeling the hydrate decomposition and its rate of occurrence. The goal is to gain a better phenomenological and semi-quantitative
understanding of the hydrate decomposition process starting with molecular scale concepts.
In our previous work, we focused on phenomenological aspects of the simulation of methane hydrate decomposition. Here we add further quantitative analysis of the methane hydrate decomposition and compare the results with the assumptions made in macroscopic reservoir models for the decomposition process.
2. Computational Methods
The details of the computational methods used in the analysis are given in our previous work.[12] The initial positions of the structure I clathrate hydrate oxygen atoms were taken from X-ray structural determination [15] with the hydrogen atom positioned by a Monte Carlo routine consistent with the ice rules [16] which minimize the dipole moment of the unit cell. The extended simple point charge (SPC/E) potential model [17] is used for water. Methane molecules are rigid with a C-H bond length of 1.0895 Å with Lennard-Jones parameters and electrostatic point charges for the carbon and hydrogen atoms chosen from the Murad-Gubbins potential.[18] Molecular dynamics simulations were performed with DL_POLY 2.17 [19] with an integration time step of 1 fs. An interatomic potential cutoff value of Rcutoff = 15.0 Å was used. Further details are provided
in Ref. [12].
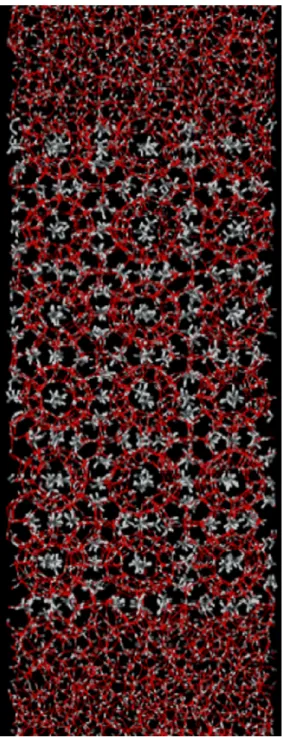
A 336 replica of the sI methane clathrate hydrate unit cell with full methane occupancy was exposed to two reservoirs of water with 1800 molecules on each cross section along the z-direction, see Figure 3. The water phases were equilibrated over the frozen hydrate phase surface in a NVT molecular dynamics simulation for 200 ps
followed by a further 200 ps NpT simulation at a pressure of 0.1 kbar (with frozen clathrate phase) allowing the water phase to equilibrate on the clathrate surface at the target temperature and pressure. Once water in the two-phase system was equilibrated at the four initial simulation temperatures of 273, 290, 300, and 310 K, simulations with methane hydrate phase molecules unfrozen are begun. To thermalize the molecules of the clathrate hydrate phase, the water and hydrate phases were equilibrated for a short time of 5 ps under NpT simulation conditions. The NVE clathrate hydrate and liquid water simulations are afterwards run for 400 ps. A typical methane clathrate hydrate – water interface at the beginning of the NVE simulation is shown in Figure 3. Note that the structure of the top and bottom of the hydrate phase at the beginning of the simulation are not identical.
3. Results and Discussion
Snapshots of the NVE simulation with an initial temperature of 310 K for times up to 350 ps after the beginning of the simulation are shown in Figure 4. From the simulations, after an initial induction period, the decomposition of rows of methane hydrate occur concertedly.[21,14] Prior to the decomposition of an entire row of cages from clathrate hydrate structure, cages can partially breakup, releasing the methane molecules into water. However, if the neighboring clathrate framework is intact, these molecules often return to the hydrate-water interface and hydrate cages are reconstructed around them. Due to the large entropy penalty, after an entire row of solid hydrate decomposes (for example in the 100 ps snapshot), the decomposition becomes irreversible. The large scale rearrangements of the water, hydrate, and methane phases that occur during the
decomposition of a row of solid hydrate phase can be the source of the large activation energy observed for the hydrate decomposition.
In snapshots after 150 ps where a layer of hydrate cages has dissociated, the methane gas released forms bubbles in the water phase which minimizes the hydrophobic water-methane interactions and reflects the low solubility of water-methane in water. The formation of the methane bubbles, as opposed to the continuous homogeneous diffusion of methane from the decomposing hydrate surface, can have a large affect on the nature of mass and heat transfer to the hydrate surface.
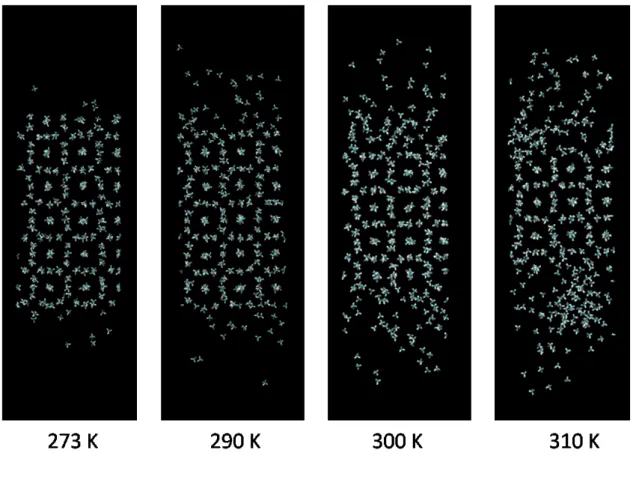
Snapshots of the methane molecules in simulations at the end of the simulations (400 ps) for the initial temperatures studied are shown in Figure 5. The hydrate phase is stable at 273 K, but considerable hydrate decomposition occurs for greater temperatures. The observation of hydrate decomposition, of course depends on the simulation time and the nature of the water potential used in the simulation.
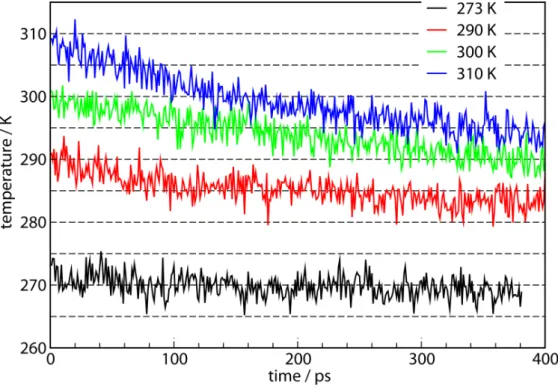
During the nonequilibrium hydrate decomposition in the NVE simulations, global temperatures and pressures are no longer defined. However, average system “temperature” can be defined based on the average kinetic energy of the molecules from all parts of the simulation cell. For each of the simulation shown in Figure 5, plots of the average temperature for the entire system as a function of the simulation time are shown in Figure 6. At each initial temperature, proportional to the amount of hydrate phase that decomposes, the overall system temperature drops. For the system with the initial temperature of 273 K where the hydrate decomposition is minimal, system temperature remains fairly constant. For the system with the initial temperature of 310 K, about half of the hydrate phase has decomposed by the end of the simulation and a temperature drop
of ~15 K is observed. The temperature decreases when kinetic energy of the molecules is consumed for the endothermic methane hydrate decomposition.
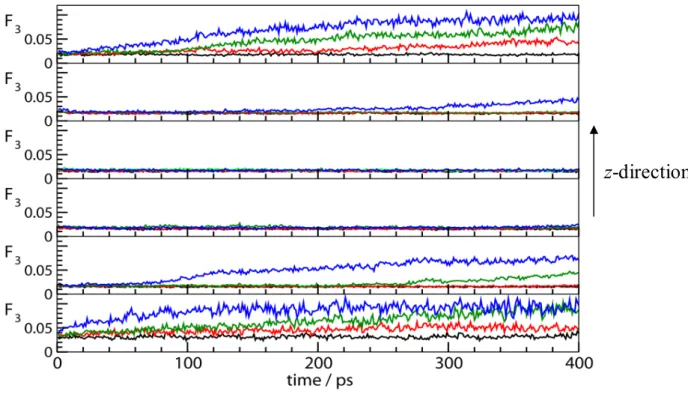
To quantitatively study the rate of hydrate phase dissociation for each simulation, we use the order parameter F3 [23-25] for different layers of the simulation cell in the
z-direction. The F3order parameter defined as F3i [|cosθjik|cosjik cos2
104.25
]2 j,kis an indication of the deviation of the positions of oxygen atoms in water triplets from the tetrahedral arrangement present in the solid phases of water (ice and hydrate). For an ordered clathrate hydrate phase, the order parameter is ~0.0, whereas for a disordered liquid water phase it is ~0.1. The change of the order parameter with time for the different simulations is given in Figure 7. We see that dissociation occurs relatively quickly in different layers of the hydrate phase, starting, of course, from the outermost layers in contact with the water phase. We also note that the next inner layer will not decompose until the outer dissociating hydrate layer has F3~0.07.
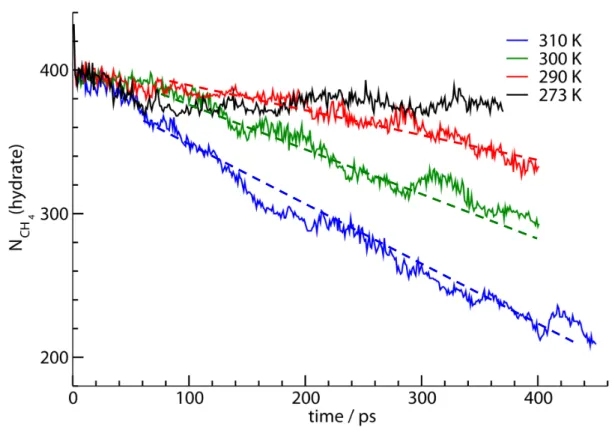
A criterion based on the Lindemann index [26] which measures the average displacement of molecules in the system relative to their initial position at t = 0 is used to characterize the motion of the methane molecules in different phases of the simulations cell. The diameter of the large structure I cages is ~8 Å. If a methane molecule moves less than 8 Å from its initial position at t = 0, it is considered it to be in the hydrate phase, otherwise the cage holding this methane molecule must have decomposed. The index N(hydrate; t) at each time counts the number of methane molecule that have been displaced less than the 8 Å size of the clathrate hydrate cage. The time variations of N(hydrate; t) at different times for the four simulations studied are shown in Figure 8. The hydrate dissociation criterion based on methane positions shown in Figure 9 is
consistent with the F3 order parameter which is based on the structure of the water
network of the hydrate phase. For example, after 100 ps in the 310 K simulation, both F3
values of the outer hydrate layers shown in Figure 7 and the N(hydrate; t) values in Figure 8 indicate a drop in the molecules in the hydrate phase.
The slopes of the N(hydrate; t) curves in Figure 8 give the rate of the hydrate dissociation, which is observed to decreases over time as the existing kinetic energy of the system is expended to provide for the hydrate heat of dissociation (see Figure 6). This has important implications on modeling of hydrate dissociation in reservoirs. The stepwise dissociation of the hydrate phase in Figure 8 is also consistent with Figures 4 and 7.
The quick initial drop in the number of methane molecules in the hydrate phase in the first 20 ps of the simulation is related to the dissociation of the surface cages seen on the upper left panel (0 ps) of Figure 4. The methane bubble formation event at 310 K shown in Figure 4 occurs 150 ps after the start of the simulation. This time is significantly later than the 20 ps time range of initial decomposition of the surface cages. The bubble formation therefore is not related to the initial release of methane molecules from the surface cages but due to the low solubility of methane in water.
In reality, hydrate dissociation occurs under constant pressure conditions and the release of methane gas may be faster than calculated here. However, we believe it is crucial not to impose the artificial thermostat constraints on the hydrate – liquid system and to maintain the non-equilibrium nature of the hydrate dissociation process in the simulation. For this reason, we perform NVE rather than NpT simulations which maintain the system at constant pressure.
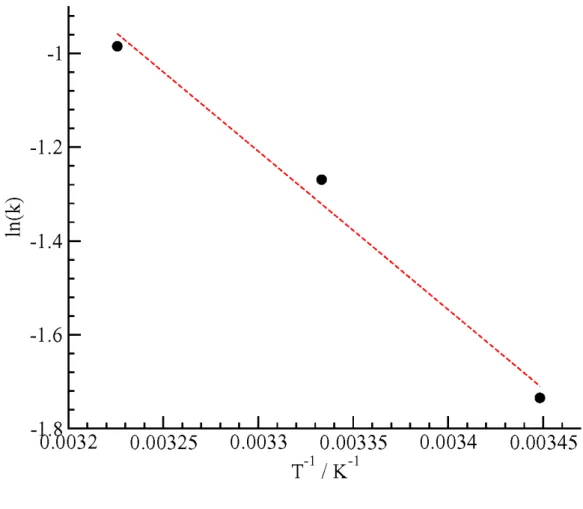
To illustrate some of the points discussed above, we notice that after the initial induction time of about 100 ps, hydrate decomposition rates, -dNCH4(t)/dt, can be
extracted from slopes of Figure 9 at temperatures between 273-310 K. The simulations of the hydrate decomposition at the different temperatures are performed under identical conditions. The hydrate dissociation rates obtained from the slopes of the dashed lines in Figure 8 are fit to an Arrhenius curve in Figure 9. However, the superficial linearity of the Arrhenius plot for the hydrate decomposition is not necessarily relevant to the dissociation mechanism as there is no real activation barrier to the hydrate dissociation, but rather mass and heat transfer barriers. It is the interconversion of kinetic to potential energy, mass flow, and heat flow which drives the dissociation kinetics, not an “intrinsic kinetic” barrier. English and Phelan [14] concluded that the activation energy required for the diffusional mass transfer of the guest increases with the size of the system. The apparent “activation energy” obtained from the Arrhenius plot would depend on the size of the system and the relative amounts of solid and liquid phases present. Furthermore, Myshakin et al. [27] observed no significant change in the ratio of small to large cages during decomposition, as also proved experimentally through NMR spectroscopy [28]. All of these evidences suggest that the assumption of hydrate decomposition reaction being “activated-controlled” may not be valid and should be reconsidered.
The decomposition rate for the 273 K simulation is effectively zero on the time scale of the simulations, and so we immediately see that it cannot be plotted in the Arrhenius plot along with the other “rate constants” of Figure 9. The other three “rate constants” however, superficially seem to give a linear Arrhenius plot and if simulations at other temperatures in this range are performed, a sufficiently linear plot may be obtained. From
the linear plot, we can extract a slope, which could then be considered equal to -Eact/R.
However, our analysis shows that this view point is not correct. On the one hand, the temperature range of the data is quite narrow, effectively only being 20 K (from 290 – 310 K). Within such a narrow temperature range, superficially linear 1/T plots can be drawn. Laidler [29] has shown; however, that in a narrow enough temperature range, linear plot with T or T2 can also be obtained. Furthermore, our analysis shows that the
temperature of the system is not uniform during the decomposition process and temperature gradients are established as the hydrate decomposes. The hydrate decomposition is a non-equilibrium process and cannot be modeled with an equilibrium rate theory.
4. Summary and Conclusions
From the results of the present simulations, we make several observations that are relevant to the proper modeling of the methane hydrate decomposition process in a reservoir. First, decomposition goes in a series of steps where rows of clathrate decompose one after another. Second, simultaneous release of methane gas from decomposing rows of the clathrate hydrate leads to the formation of methane micro-bubbles in the water phase. Third, as the clathrate cages decompose, temperature gradients of up to 20 K can be established across different segments of the solid hydrate and solution phases. These gradients can lead to substantial heat transfer effects between the aqueous phase and the hydrate surface.
The picture assuming isothermal hydrate and liquid phase conditions during the decomposition (see Figure 1(a)) is inconsistent with the nature of the first order methane
hydrate decomposition phase transition. The water and solid hydrate phases are not in thermal equilibrium during the dissociation and the process is not isothermal. Stirring the liquid phase will help in establishing a uniform temperature in the liquid phase, but due to no slip boundary conditions and the non-equilibrium nature of the melting process, temperature gradients will persist until all of the solid phase has melted. A more accurate way to model hydrate decomposition is to maintain the hydrate phase temperature at the equilibrium value at the phase boundary and let the aqueous phase temperature change as a result of heat transfer.
Diffusion of released methane gas from the hydrate surface is not homogenous and the solution phase will not necessarily remain isothermal over short time periods. Extracting an “activation energy” from the temperature dependence of the rate constant is problematic because the hydrate dissociation rate constant captures many non-equilibrium effects, including heat and mass transfer, during the decomposition process which makes it to be set up-dependent and non-transferable.
Hydrate dissociation can be superficially fit with rates that fit the Arrhenius behaviour, although the rates show large deviations from linear ln(k) vs. 1/T behaviour upon approaching the melting point where the rate goes to zero and ln(k) asymptotically approaches infinity.
The dependence of intrinsic kinetic parameters on the details of the experimental set up can also be understood in light of the results obtained above. One would expect the parameters to depend on the size of the system, the amount of hydrate present and the surface area (particle size) of the hydrate. As well, the intrinsic kinetic parameters cannot
be expected to have any fundamental meaning related to the physics of the phase transition.
Acknowledgments
We acknowledge Natural Resources Canada (NRCan) under the program “Gas Hydrates as a Canadian Energy Alternative” for partial funding of this research. The support of the National Research Council of Canada is gratefully acknowledged.
References
[1] G.J. MacDonald, The future of methane as an energy resource, Ann. Rev. Energy, 15 (1990) 1709-1728.
[2] A.V. Milkov, G.E. Claypool, Y.-J. Lee, W. Xu, G. R. Dickens, W.S. Borowski, and the Ocean Drilling Program Leg 204 Scientific Party, Geology, 31 (2003) 833-836. [3] Y. Masuda, M. Kurihara, H. Ohuchi, and T. Sato. A Field Scale Simulation Study on Gas Productivity of Formations Containing Gas Hydrates, Proc. 4th Int’l Conf. Gas Hydrates, Yokohama (2002), 40-46.
[4] H. Hong, M. Pooladi-Darvish, Simulation of depressurization for gas production from gas hydrate reservoirs, J. Can. Petroleum Technol. 44 (2005) 39-46.
[5] Y.P. Handa, Compositions, enthalpies of dissociation, and heat capacities in the range 85 to 270 K for clathrate hydrates of methane, ethane, and propane, and enthalpy of dissociation of isobutane hydrate, as determined by a heat-flow calorimeter, J. Chem. Thermodyn. 18 (1986) 915-921.
[6] A. Gupta, J. Lachance, E.D. Sloan Jr., Measurements of methane hydrate heat of dissociation using high pressure differential scanning calorimetry, C.A. Koh, Chem. Eng. Sci. 63 (2008) 5848-5853.
[7] H.C. Kim, P.R. Bishnoi, R.A. Heidemann, S.S.H. Rizvi, Kinetics of methane hydrate decomposition, Chem. Eng. Sci. 42 (1987) 1645-1653.
[8] M. Clark, P.R. Bishnoi, Determination of the Intrinsic Rate of Ethane Gas Hydrate Decomposition, Chem. Eng. Sci. 55 (2000) 4869-4883.
[9] M. Clarke, P. R. Bishnoi, Determination of the Intrinsic Rate of Gas Hydrate Decomposition Using Particle Size Analysis. Ann. NY Acad. Sci. 912 (2000) 556-563.
[10] A.K.M. Jamaluddin, N. Kalogerakis, P.R. Bishnoi, Modelling of decomposition of a synthetic core of methane gas hydrate by coupling intrinsic kinetics with heat transfer rates, Can. J. Chem. Eng. 67 (1989) 948-954.
[11] A.K. Galwey, D.B. Sheen, J.N. Sherwood, Should the melting of ice be represented as a solid state reaction?, Thermochim. Acta, 375 (2001) 161–167.
[12] S. Alavi, J. A. Ripmeester, “Nonequilibrium adiabatic molecular dynamics simulation of methane clathrate hydrate decomposition” J. Chem. Phys. 132 (2010) 144703.
[13] S. Nosé, A unified formulation of constant temperature molecular dynamics methods, J. Chem. Phys. 81 (1984) 511-520; W. G. Hoover, Canonical dynamics: Equilibrium phase-space distributions, Phys. Rev. A 31 (1985) 1695-1697; S. Melchionna, G. Ciccotti, B. L. Holian, Hoover NPT dynamics for systems varying in shape and size, Mol. Phys. 78 (1993) 533.
[14] N.J. English, G.M. Phelan, Molecular dynamics study of thermal-driven methane hydrate dissociation, J. Chem. Phys. 131 (2009) 074704.
[15] T.C. Mak, R.K. McMullan, Polyhedral clathrate hydrates. X. Structure of the double hydrate of tetrahydrofuran and hydrogen sulfide, J. Chem. Phys. 42 (1964) 2732.
[16] J.D. Bernal, R.H. Fowler, A theory of water and ionic solution, with particular reference to hydrogen and hydroxyl ions, J. Chem. Phys. 1 (1933) 515.
[17] H.J.C. Berendsen, J.R. Grigera, T.P. Straatsma, The missing term in effective pair potentials, J. Phys. Chem. 91 (1987) 6269-6271.
[18] S. Murad, K.E. Gubbins, in Computer Modeling of Matter, P. Lykos (Ed.) American Chemical Society, Washington D.C., 1978, p. 62.
[19] DLPOLY 2.17, T.R. Forester, W. Smith (Eds.), CCLRC, Daresbury Laboratory, 1995.
[20] a) D. Frenkel, B. Smit, Understanding Molecular Simulation, Academic, San Diego, 2000. b) M.P. Allen, D.J. Tildesley, Computer Simulation of Liquids, Oxford Science, Oxford, 1987.
[21] L.A. Báez, P.Clancy, Computer simulation of the crystal growth and dissolution of natural gas hydrates, Ann. N.Y. Acad. Sci. 715 (1994) 177-186.
[22] D. Katsuki, R. Ohmura, T. Ebinuma, H. Narita, Visual observation of dissociation of methane hydrate crystals in a glass micro model: Production and transfer of methane, J. App. Phys. 104 (2008) 083514.
[23] L. A. Báez, Ph.D. thesis, Cornell University, 1996.
[24] N.J. English, J.K. Johnson, C.E. Taylor, Molecular-dynamics simulations of methane hydrate dissociation, J. Chem. Phys. 123 (2005) 244503.
[25] P.M. Rodger, Methane hydrate: Melting and memory, Ann. N.Y. Acad. Sci. 912 (2000) 474-482.
[26]. F.A. Lindemann, Phys. Z. The calculation of molecular vibration frequencies, 11 (1910) 609-612.
[27] Myshakin EM, Jiang H, Warzinski RP, Jordan KD. Molecular Dynamics Simulations of Methane Hydrate Decomposition. The Journal of Physical Chemistry A. (2009);113(10):1913–1921
[28] Gupta, A.; Dec, S. F.; Koh, C. A.; Sloan, E. D. J. Phys. Chem. C (2007), 111, 2341 [29] K.J. Laidler, Development of the Arrhenius equation, J. Chem. Ed. 61 (1984) 494-498.
Figure 1. (a) The temperature and pressures of the gas, aqueous, and hydrate phase during hydrate decomposition according to the intrinsic kinetics mechanism. The pressure in the gas phase is shown as P , the temperature of the hydrate surface and gV aqueous phase in contact with it is Ts, the gas pressure in the aqueous phase and the the
hydrate surface are Ps, which correspond to the saturated aqueous phase pressure. Finally,
TH and PH are the internal temperature and pressure of the hydrate phase. The
temperature and pressure gradients are such that Ts > TH, and P <PgV S<PH, respectively.
(b) The temperature and pressure of the hydrate and aqueous phases during hydrate dissociation. The hydrate phase remains at a constant temperature, TH, and pressure, PH,
of the three-phase boundary. Temperature and pressure gradients are established in the aqueous phase as the endothermic hydrate dissociation removes heat from the vicinity of the hydrate phase. The simulations in this work use this latter picture. The initial temperature and pressure of the aqueous and hydrate phases are chosen as Ti and Pi.
During the adiabatic NVE simulations, the endothermic hydrate decomposition leads to the establishment of a temperature gradient between the “bulk” water phase and the water layer adjacent to the hydrate phase. The temperature of the hydrate phase remains at Ti
during the simulation. As methane gas is released into the aqueous phase, the pressure of the simulation box gradually increases.
Figure 2. Schematic of the deviation of the phase transition (such as ice melting or hydrate decomposition) reaction rates from the Arrhenius linear plot near the transition temperature. The logarithm of the rate constant goes to negative infinity at the exact transition temperature.
Figure 3. The initial setup of the solid methane hydrate phase in contact with water on both sides along the z-direction (verticle).
Figure 4: Snapshots of the interface of the methane hydrate and water phase at 310 K for times up to 350 ps. The dissociation of the rows of hydrate and the methane bubble formation in the water phase are observed. The dashed lines represent the approximate location of the hydrate – liquid interface.
Figure 5. The decomposition of the methane hydrate phase at four temperatures after 400 ps NVE simulations. Each snapshot is characterized by the initial temperature of the simulation.
Figure 6. The overall simulation box temperature for simulations starting at the values indicated in the legend. In cases where substantial solid hydrate dissociation has occurred, the temperature drop is large, up to 15 K.
Figure 7. The variation of the F3 order parameter for six hydrate layers along the
z-direction in the solid hydrate phase (cf. Figure 3) with time. The temperatures correspond to blue: 310 K; green: 300 K; red: 290 K; black: 273 K. The liquid water phase is characterized by F3 ~ 0.1. The top and bottom panels represent the hydrate layers in
contact with water.
Figure 8. The time variation of the number of methane molecules in the hydrate phase NCH4(hydrate, t) for different simulations. The initial temperature of each simulation is
indicated. Approximate dashed lines representing the decomposition are drawn at each temperature.
Figure 9. The “Arrhenius plot” for the relative rate constants of the hydrate decomposition from the simulation results shown in Figure 9. The temperature used in the x-axis corresponds to the initial temperature of the NVE simulations. The results are superficially linear, but the physical basis of an activated process does not hold for the hydrate decomposition process.