EUROPEAN ORGANISATION FOR NUCLEAR RESEARCH (CERN)
Submitted to: JHEP CERN-PH-2015-230
24th September 2018
Measurement of the production cross-section of a single top quark
in association with a W boson at 8 TeV with the ATLAS experiment
The ATLAS Collaboration
Abstract
The cross-section for the production of a single top quark in association with a W boson in proton–proton collisions at √s = 8 TeV is measured. The dataset corresponds to an integrated luminosity of 20.3 fb−1, collected by the ATLAS detector in 2012 at the Large Hadron Collider at CERN. Events containing two leptons and one central b-jet are selected. The Wt signal is separated from the backgrounds using boosted decision trees, each of which combines a number of discriminating variables into one classifier. Production of Wt events is observed with a significance of 7.7σ. The cross-section is extracted in a profile likelihood fit to the classifier output distributions. The Wt cross-section, inclusive of decay modes, is measured to be 23.0 ± 1.3(stat.)+3.2−3.5(syst.)±1.1(lumi.) pb. The measured cross-section is used to extract a value for the CKM matrix element |Vtb| of 1.01 ± 0.10 and a lower limit of 0.80 at the 95% confidence level. The cross-section for the production of a top quark and a W boson is also measured in a fiducial acceptance requiring two leptons with pT > 25 GeV and |η| < 2.5, one jet with pT > 20 GeV and |η| < 2.5, and EmissT > 20 GeV, including both Wtand top-quark pair events as signal. The measured value of the fiducial cross-section is 0.85 ± 0.01(stat.)+0.06−0.07(syst.)±0.03(lumi.) pb.
© 2018 CERN for the benefit of the ATLAS Collaboration.
Reproduction of this article or parts of it is allowed as specified in the CC-BY-4.0 license.
Contents
1 Introduction 2
2 The ATLAS detector and object reconstruction 4
3 Data and simulated samples 5
4 Event selection 7
5 Analysis 12
6 Systematic uncertainties 18
7 Results 19
7.1 Measurement of the inclusive cross-section 19
7.2 Constraints on | fLVVtb| and |Vtb| 24
8 Cross-section measurement inside a fiducial acceptance 25
8.1 Fiducial selection 25
8.2 Systematic uncertainties 25
8.3 Results 26
9 Conclusion 28
1 Introduction
The production of a single top quark at the Large Hadron Collider (LHC) proceeds via the weak interac-tion in the Standard Model (SM). The three main modes of single top-quark producinterac-tion are: t-channel, the exchange of a W boson between a light quark and a heavy quark; s-channel, via a virtual W boson; and Wt, the production of a top quark in association with a W boson. Single top-quark production de-pends on the top-quark coupling to the W boson, which is parameterised by the form factor fLVand the Cabibbo–Kobayashi–Maskawa (CKM) matrix element Vtb[1–3]. The cross-section for each of the three production modes is proportional to the square of | fLVVtb| [4,5]. Physics beyond the SM can contribute to the single top-quark final state and modify the production cross-sections [6,7] as well as the kinematic distributions, for example through a resonance that decays to Wt [8,9].
The production of single top quarks has been observed at the Tevatron proton–antiproton collider in the t-channel [10,11] and s-channel [12–14], as well as their combination [15–17]. The Wt process has a small expected cross-section at the Tevatron and was not observed. The t-channel mode has been observed by both the ATLAS [18,19] and CMS [20,21] collaborations at the LHC. The s-channel mode has not yet been measured at the LHC because of its small production cross-section [22]. Evidence for Wt production was reported by ATLAS [23] and CMS [24] in proton–proton (pp) collisions at 7 TeV. The observation of Wt production in pp collisions at 8 TeV has been reported by CMS [25].
Production of Wt events proceeds via b-quark-induced partonic channels such as gb → Wt → W−W+b. A leading-order (LO) Feynman diagram in the 5-flavour-number scheme (5FNS, considering the quarks u, d, s, c, and b in the initial state) is shown in Figure1. The presence of only a single b-quark in the final state
represents a distinctive feature with respect to the W+W−b¯bfinal state of top-quark pair (t¯t) production. The Wt final state contains an additional b-quark in higher-order Quantum Chromodynamics (QCD) correction diagrams in the 5FNS, as well as in the leading-order process in the 4-flavour-number scheme (4FNS, considering only the quarks u, d, s, c in the initial state), making it challenging to experimentally separate Wt production from t¯t production.
g
b
t
b
ℓ
−ℓ
+¯
ν
ν
W
+W
−Figure 1: Representative leading-order Feynman diagram for the production and decay of a single top quark in association with a W boson.
The theoretical prediction for the Wt production cross-section at to-leading order (NLO) with next-to-next-to-leading logarithmic (NNLL) soft gluon corrections is 22.37 ± 1.52 pb [26] at a centre-of-mass energy of √s =8 TeV for a top-quark mass of mt = 172.5 GeV [27]. In this calculation, the uncertainty on the theoretical cross-section accounts for the variation of the renormalisation and factorisation scale between mt/2 and 2mt and for the parton distribution function (PDF) uncertainties (using the 90% con-fidence level errors of the MSTW2008 NNLO PDF set [28]). This cross-section represents about 20% of the total cross-section for all single top-quark production modes at the LHC. A second theoretical pre-diction for the Wt production cross-section is 18.8 ± 0.8 (scale) ±1.7 (PDF) pb, computed at NLO with Hathor v2.1 [29,30]. The PDF uncertainties are calculated using the PDF4LHC prescription [31] with three different PDF sets (CT10, MSTW2008nlo68cl [28] and NNPDF2.3 [32]). The renormalisation and factorisation scales are set to 65 GeV and the b-quark from initial-state radiation is required to have a transverse momentum of less than 60 GeV.
This paper presents a measurement of the cross-section for Wt production in pp collisions at √s=8 TeV, based on the analysis of 20.3 fb−1of data collected by the ATLAS detector in 2012. The measurement is carried out in the dilepton final state shown in Figure1where each W boson decays to an electron or a muon and a neutrino (eν or µν). This analysis requires two opposite-sign high-transverse-momentum (pT) leptons (ee, eµ, µµ), missing transverse momentum (ETmiss), and one high-pTcentral jet, which is required to contain a b-hadron (b-jet). The main background to this signature is from t¯t production, with smaller backgrounds coming from dibosons (WW, WZ, ZZ), Z+jets, and events where one or both leptons are misidentified (fake-lepton events) or non-prompt. Control regions enriched in t¯t and other background events are also defined. Events in the t¯t-enriched regions fulfil the same lepton and missing transverse momentum requirements, and have exactly two jets, with one or both of the jets required to be identified as a b-jet. Events in the other background-enriched regions have one or two jets which are required to not be identified as b-jets. The backgrounds are estimated with simulation, except the non-prompt or fake-lepton background, which is estimated from data. Boosted decision trees (BDT) are used to optimise the discrimination between signal and background [33]. The cross-section is extracted using a profile likelihood fit of the BDT response. The background normalisation and the systematic uncertainties are constrained by simultaneously analysing phase-space regions with substantial Wt signal contributions and regions where the Wt contributions are negligible. The ratio of the measured cross-section to the
theoretical prediction (which assumes Vtb= 1) is used to extract a value of | fLVVtb|.
In the 5FNS, the Wt single top-quark process overlaps and interferes with t¯t production at NLO where diagrams involving two top quarks are part of the real emission corrections to Wt production [34, 35]. A calculation in the 4FNS scheme includes Wt and t¯t as well as non-top-quark diagrams [36] and the interference between Wt and t¯t enters already at tree level. A measurement of the cross-section inside a fiducial acceptance, designed to reduce the dependence on the theory assumptions, is also presented. The fiducial acceptance is defined using physics objects constructed of stable particles to approximate the Wt detector acceptance. The cross-section for the sum of Wt and t¯t production is measured in this fiducial acceptance.
This paper is organised as follows: Section 2 provides a brief overview of the ATLAS detector and the definition of physics objects. Section 3 describes the data and Monte Carlo samples used for the analysis. Section 4 describes the event selection and background estimation. Section 5 presents the procedure defined to discriminate the signal from the backgrounds using BDTs. The dominant systematic uncertainties are discussed in Section 6. Section7 presents the results for the inclusive cross-section measurement and for |Vtb| and discusses the impact of systematic uncertainties. Section 8 defines the fiducial acceptance and presents the fiducial cross-section measurement. Finally, a summary is presented in Section9.
2 The ATLAS detector and object reconstruction
The ATLAS detector [37] is a multi-purpose particle detector with a forward-backward symmetric cyl-indrical geometry and a near 4π coverage in solid angle.1 ATLAS comprises an inner detector (ID) surrounded by a thin superconducting solenoid providing a 2 T axial magnetic field, a calorimeter system and a muon spectrometer in a toroidal magnetic field. The ID tracking system covers the pseudorapidity range |η| < 2.5 and consists of silicon pixel, silicon microstrip, and transition radiation tracking detectors. The ID provides precise position and momentum measurements for charged particles and allows efficient identification of jets containing b-hadrons. Lead/liquid-argon (LAr) sampling calorimeters provide elec-tromagnetic (EM) energy measurements with high granularity up to |η|= 2.5. A hadron (steel/scintillator-tile) calorimeter covers the central pseudorapidity range (|η| < 1.7). The end-cap and forward regions are instrumented with LAr calorimeters for both the EM and hadronic energy measurements up to |η|= 4.9. The muon spectrometer surrounds the calorimeters. It consists of three large air-core toroid superconduct-ing magnet systems, separate trigger detectors and high-precision tracksuperconduct-ing chambers providsuperconduct-ing accurate muon tracking for |η| < 2.7 and muon triggering for |η| < 2.4.
A three-level trigger system [38] is used to select events. The first-level trigger is implemented in hard-ware and uses a subset of the detector information to reduce the event rate to less than 75 kHz. Two software-based trigger levels, Level-2 and the Event Filter, reduce the rate of Level-1 accepts to about 400 Hz on average.
1ATLAS uses a right-handed coordinate system with its origin at the nominal interaction point (IP) in the centre of the detector
and the z-axis along the beam pipe. The x-axis points from the IP to the centre of the LHC ring, and the y-axis points upwards. Cylindrical coordinates (r, φ) are used in the transverse plane, φ being the azimuthal angle around the z-axis. The pseudorapidity is defined in terms of the polar angle θ as η = − ln tan(θ/2). Angular separation is measured in units of ∆R ≡ p(∆η)2+ (∆φ)2.
Candidate events are characterised by exactly two leptons (ee, µµ, eµ), missing transverse momentum ETmiss due to the neutrinos from the leptonic decays of the two W bosons, and a b-jet originating from the top-quark decay. Electron candidates are reconstructed from energy clusters in the calorimeter which are matched to ID tracks [39]. Selected electrons must have ET > 25 GeV and |η| < 2.47, excluding the barrel/end-cap transition region of 1.37 < |η| < 1.52. A hit in the innermost layer of the ID is required, to reject photon conversions. Electron candidates are required to fulfil calorimeter-based and track-based isolation requirements in order to suppress backgrounds from hadron decays. The calorimeter transverse energy within a cone of size∆R = 0.2 and the scalar sum of track pTwithin∆R of 0.3 around the electron, in each case excluding the contribution from the electron itself, are each required to be smaller than ET -and η-dependent thresholds calibrated to give nominal selection efficiencies of 90% for prompt electrons from Z → ee decays.
Muon candidates are reconstructed by combining matching tracks reconstructed in both the ID and the muon spectrometer [40]. Selected muons have a pT > 25 GeV and |η| < 2.5. An isolation criterion [41] is applied in order to reduce background contamination from events in which a muon candidate is ac-companied by hadrons. The ratio of the sum of pT of additional tracks in a variable-size cone around the muon, to the pTof the muon [41], is required to be less than 0.05, yielding a selection efficiency of 97% for prompt muons from Z → µµ decays.
Jets are reconstructed using the anti-kt jet clustering algorithm [42] with a radius parameter of R = 0.4, using locally calibrated topological clusters as inputs [43]. Jet energies are calibrated using energy- and η-dependent correction factors derived from simulation and with residual corrections from in-situ meas-urements [44]. Jets are required to be reconstructed in the range |η| < 2.5 and to have pT > 20 GeV. To reduce the contamination due to jets from additional pp interactions in the same or neighbouring bunch crossings (pileup), tracks originating from the primary vertex must contribute a large fraction to the scalar sum of the pTof all tracks in the jet. This jet vertex fraction (JVF) [45] is required to be at least 50% for jets with pT < 50 GeV and |η| < 2.4.
To avoid double-counting objects in an event and to suppress leptons from heavy-flavour decays, overlaps between reconstructed objects are resolved in the following order: (1) jets overlapping with a selected electron within∆R of 0.2 are removed; (2) electrons that are within ∆R of 0.4 of a jet are removed; (3) events are rejected if a selected electron shares an ID track with a selected muon; and (4) muons that are within∆R of 0.4 of a jet are removed.
The identification of b-jets relies of the long lifetime of b-hadrons and the topological properties of sec-ondary and tertiary decay vertices reconstructed within the jet. A combination of multivariate algorithms is used to identify b-jets (b-tag) [46]. The b-tag algorithm has an average efficiency of 70% for b-jets from t¯tdecays and an average mis-tag rate of 0.8% [47,48] for light-quark jets.
The missing transverse momentum (EmissT ) is calculated as the magnitude of the vector sum over the energies of all clusters in the calorimeters, and is refined by applying object-level corrections to the contributions arising from identified electrons, muons, and jets [49].
3 Data and simulated samples
The dataset used for this analysis was collected at √s = 8 TeVin 2012 by the ATLAS detector at the LHC, and corresponds, after data quality requirements, to an integrated luminosity of 20.3 fb−1. Events are required to have fired either a single-electron or single-muon trigger. The electron and muon triggers
impose a pT threshold of 24 GeV, along with isolation requirements on the lepton. To recover efficiency for higher pTleptons, the isolated lepton triggers are complemented by triggers without isolation require-ments, but with pTthresholds of 60 GeV and 36 GeV for electrons and muons respectively.
Samples of signal and background events are simulated using various Monte Carlo (MC) generators, as summarised in Table 1. The generators used for the estimation of the modelling uncertainties are listed together with the reference simulation for the Wt signal and the t¯t background. In addition, PDFs used by each generator and the perturbative order in QCD of the respective calculations are provided. All simulation samples are normalised to theoretical cross-section predictions. A top-quark mass of 172.5 GeV is used [27].
Table 1: Monte Carlo generators used to model the Wt signal and the background processes at √s = 8 TeV. The samples marked with a † are used as alternatives for Wt or t¯t to evaluate modelling uncertainties. DR refers to the diagram-removal scheme and DS to the diagram-subtraction scheme to handle the overlap and interference between Wtand t¯t, as discussed in the text.
Process Generator PDF Normalisation
Wt Powheg-Box v1.0 CT10 + Pythia v6.426, DR CTEQ6L1 Wt† Powheg-Box v1.0 CT10 + Pythia v6.426, DS CTEQ6L1 22.37 pb Wt† Powheg-Box v1.0 CT10 (NLO+NNLL) + Herwig v6.520.2, DR CT10 Wt† MC@NLO v4.06 CT10 + Herwig v6.520.2, DR CT10 t¯t Powheg-Box v1.0 CT10 + Pythia v6.426 CTEQ6L1 t¯t† Powheg-Box v1.0 CT10 253 pb + Herwig v6.520.2 CT10 (NNLO+NNLL) t¯t† MC@NLO v4.06 CT10 + Herwig v6.520.2 CT10 WW, WZ, ZZ Alpgen v2.1.4 CTEQ6L1 88 pb + Herwig v6.520.2 CT10 (NLO)
Z(→ ee, µµ, ττ)+ jets Alpgen v2.1.4 CTEQ6L1 3450 pb
+ Pythia v6.426 CTEQ6L1 (NNLO)
The Wt events are simulated using the NLO generator Powheg-Box [50,51], interfaced to Pythia [52] for parton showering with the Perugia 2011C set of tuned parameters [53]. In the Powheg-Box event gener-ator, the CT10 [54] PDFs are used, while the CTEQ6L1 [55] PDFs are used for Pythia. The generation of Wtevents is performed in the 5FNS. The overlap and interference between Wt and t¯t is handled using the diagram-removal scheme (DR), where all doubly resonant NLO Wt diagrams are removed [56]. An addi-tional sample, generated with the diagram-subtraction scheme (DS), where the cross-section contribution from Feynman diagrams containing two top quarks is subtracted, is used to evaluate the uncertainty as-sociated with the modelling of the overlap between Wt and t¯t [56]. Two alternative samples are used to
determine theory modelling uncertainties: one using MC@NLO [57] and the other using Powheg-Box, both interfaced to Herwig [58], with Jimmy for underlying-event modelling [59].
The dominant and largely irreducible t¯t background is simulated with Powheg-Box, using the CT10 NLO PDF set, with parton showering and hadronisation performed with Pythia. The t¯tproduction cross-section is σt¯t= 253+13−15pb, computed at NNLO in QCD, including resummation of NNLL soft gluon terms [60–
66].
Smaller backgrounds arise from diboson and Z+jets production. The Alpgen LO generator [67], inter-faced to Herwig, is used to generate diboson events, with the CTEQ6L1 PDF set. Diboson events are normalised to the NLO prediction [68]. The Z+jets background is generated with Alpgen, interfaced to Pythia, with the CTEQ6L1 PDF set. The diboson estimate also accounts for lower cross-section diboson processes, including H → WW. The Z+jets events are normalised to the NNLO prediction [69].
The non-prompt or fake-lepton background arises from non-prompt electrons or muons from the weak decay of mesons events, or from events where one or both leptons are mis-identified. This background contribution includes the t-channel and s-channel single top-quark production modes. The normalisation and shape of the non-prompt or fake-lepton background is determined directly from data, using the matrix method [70]. In addition to events from the signal data sample (labelled as “tight” events), a second (“loose”) set enriched with fake leptons is defined by removing the lepton isolation requirement. Given the probabilities for real and fake leptons that already passed the loose selection to also pass the tight selection, the number of tight events with a fake lepton is determined from a linear system of equations. Generated events are passed through a simulation [71] of the ATLAS detector based on Geant4 [72] and reconstructed using the same procedure as for collision data. The alternative t¯t samples used to evaluate theory modelling uncertainties are instead processed with the ATLFAST-II [71] simulation, which em-ploys a parameterisation of the response of the electromagnetic and hadronic calorimeters, and Geant4 for the other detector components. The simulations also include the effect of multiple pp collisions per bunch crossing (pileup).
4 Event selection
The dilepton selection requires that each event has a high-quality reconstructed primary vertex, which must be formed from at least five tracks with pT > 0.4 GeV. Each selected event must contain exactly two isolated opposite-sign leptons (e, µ) that originate from the primary vertex, at least one of which must be associated with a lepton that triggered the event. In addition, since the Wt signature contains a high-pT quark from the top-quark decay, events are required to have either one jet or two jets.
Events from Z-boson decays (including Z → ee, Z → µµ, and Z → ττ with τ → e or µ) are sup-pressed through requirements on the invariant mass of the dilepton system as well as on EmissT and the pseudorapidity of the leptons+jet(s) system. Events containing same-flavour leptons (ee or µµ) are re-jected if the invariant mass of the lepton pair is between 81 GeV and 101 GeV. Events are also required to have EmissT > 40 GeV, with the threshold raised to 70 GeV if the invariant mass of the lepton pair is below 120 GeV. Events containing one electron and one muon are required to have ETmiss > 20 GeV, with the threshold raised to 50 GeV if the invariant mass of the lepton pair is below 80 GeV. Since Wt events are more central than Z+jets events, the pseudorapidity of the system of both leptons and all jets, reconstructed from the vectorial sum of lepton and jet momenta, is required to be |ηsys|< 2.5.
Events are categorised into five regions depending on the jet and b-tag multiplicities. The largest number of expected signal events is in the 1-jet region with one b-tagged jet, while events in the two-jet regions with one or two b-tags are dominated by t¯t. These three regions are included in the cross-section fit. Two additional regions are used to validate the modelling of the other backgrounds but are not included in the fit. One-jet and two-jet events that have zero b-tagged jets compose the 0-tag control regions, which are enhanced in the other backgrounds. Observed yields and kinematic distributions in the 0-tag control regions are studied while choosing the selection cuts; the three regions included in the cross-section fit are not part of this optimisation procedure.
The predicted event yields for signal and backgrounds, and their uncertainties, are summarised in Table2. Uncertainties from different sources are added in quadrature, not taking into account possible correlations. Many of the sources of systematic uncertainty are common to the Wt signal and t¯t background processes, and correlated between regions (see Section6). The numbers of events observed in data and the total pre-dicted yields are compatible within the uncertainties. The Wt signal comprises 21% of the total expected event yield in the 1-jet 1-tag region. The main background originates from the production of top-quark pair events, which accounts for almost 80% of the total event yield in the 1-jet 1-tag region. For the other regions included in the fit, the expected fraction of signal events is smaller, 9% in the 2-jet 1-tag region and 3% in the 2-jet 2-tag region, which is the most enriched in t¯t. The other backgrounds are small in the 1-jet 1-tag and 2-jet regions where they account for 2% of the total event yield. The 0-tag control regions are enriched in other backgrounds (diboson, Z+jets and non-prompt or fake lepton), which contribute 40–60% of the total event yield.
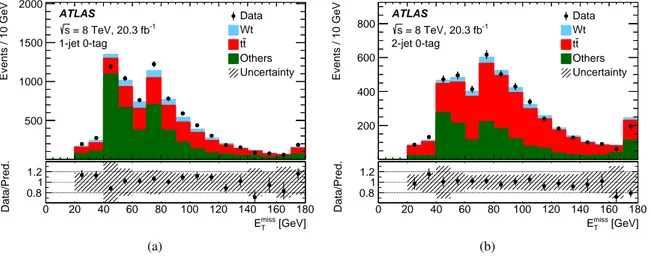
The EmissT distributions of events in the 0-tag regions are shown in Figure 2 to demonstrate the good modelling of the other backgrounds. The behaviour of this distribution at low EmissT values is a result of the different requirements for same-flavour and opposite-flavour leptons. Figures 3 and4 show the distributions of kinematic variables of reconstructed objects for the three b-tagged regions. The data distributions are well modelled by the background and signal expectations in all regions.
Table 2: Numbers of expected events for the Wt signal and the various background processes and observed events in data in the five regions, with their predicted uncertainties. Uncertainties shown include all sources of statistical and systematic uncertainty, summed in quadrature.
Process 1-jet 1-tag 2-jet 1-tag 2-jet 2-tag 1-jet 0-tag 2-jet 0-tag
Wt 1 000 ± 140 610 ± 70 160 ± 50 660 ± 100 290 ± 30
t¯t 4 500 ± 700 7 600 ± 900 5 000 ± 900 2 600 ± 400 2 660 ± 330
Diboson 40 ± 30 35 ± 15 1 ± 1 1 600 ± 500 670 ± 270
Z+ jets 70 ± 40 60 ± 40 7 ± 4 2 600 ± 1 400 900 ± 500
Non-prompt or fake lepton 24 ± 15 27 ± 15 13 ± 7 130 ± 70 80 ± 50
Total background 4 600 ± 700 7 700 ± 900 5 000 ± 900 6 900 ± 1 400 4 300 ± 600
Signal+Background 5 600 ± 800 8 300 ± 900 5 200 ± 900 7 600 ± 1 500 4 600 ± 600
[GeV] T miss E Events / 10 GeV 500 1000 1500 2000 Data Wt t t Others Uncertainty ATLAS -1 = 8 TeV, 20.3 fb s 1-jet 0-tag [GeV] T miss E 0 20 40 60 80 100 120 140 160 180 Data/Pred. 0.8 1 1.2 (a) [GeV] T miss E Events / 10 GeV 200 400 600 800 Data Wt t t Others Uncertainty ATLAS -1 = 8 TeV, 20.3 fb s 2-jet 0-tag [GeV] T miss E 0 20 40 60 80 100 120 140 160 180 Data/Pred. 0.8 1 1.2 (b)
Figure 2: Distributions of the missing transverse momentum Emiss
T in (a) 1-jet and (b) 2-jet events with 0 b-tags.
The simulated signal and background contributions are scaled to their expectations. The hatched area represents the sum in quadrature of the statistical and systematic uncertainties. The last bin includes the overflow.
) [GeV] 1 l ( T p Events / 10 GeV 200 400 600 800 1000 1200 Data Wt t t Others Uncertainty ATLAS -1 = 8 TeV, 20.3 fb s 1-jet 1-tag ) [GeV] 1 l ( T p 0 50 100 150 200 Data/Pred. 0.8 1 1.2 (a) ) [GeV] 2 l ( T p Events / 10 GeV 500 1000 1500 2000 2500 Data Wt t t Others Uncertainty ATLAS -1 = 8 TeV, 20.3 fb s 1-jet 1-tag ) [GeV] 2 l ( T p 0 20 40 60 80 100 120 Data/Pred. 0.8 1 1.2 (b) ) [GeV] 1 j ( T p Events / 10 GeV 200 400 600 800 1000 Data Wt t t Others Uncertainty ATLAS -1 = 8 TeV, 20.3 fb s 1-jet 1-tag ) [GeV] 1 j ( T p 0 20 40 60 80 100 120 140 160 180 Data/Pred. 0.8 1 1.2 (c) [GeV] T miss E Events / 10 GeV 200 400 600 800 1000 Data Wt t t Others Uncertainty ATLAS -1 = 8 TeV, 20.3 fb s 1-jet 1-tag [GeV] T miss E 0 20 40 60 80 100 120 140 160 180 Data/Pred. 0.8 1 1.2 (d)
Figure 3: Distributions, in the 1-jet 1-tag region, of (a) pTof the leading lepton (`1), (b) pT of the second-leading
lepton (`2), (c) pT of the jet ( j1), and (d) EmissT . The simulated signal and background contributions are scaled to
their expectations. The hatched area represents the sum in quadrature of the statistical and systematic uncertainties. The last bin includes the overflow.
) [GeV] 1 j ( T p Events / 10 GeV 200 400 600 800 1000 1200 1400 Data Wt t t Others Uncertainty ATLAS -1 = 8 TeV, 20.3 fb s 2-jet 1-tag ) [GeV] 1 j ( T p 0 20 40 60 80 100 120 140 160 180 Data/Pred. 0.8 1 1.2 (a) ) [GeV] 2 j ( T p Events / 10 GeV 500 1000 1500 2000 2500 3000 3500 Data Wt t t Others Uncertainty ATLAS -1 = 8 TeV, 20.3 fb s 2-jet 1-tag ) [GeV] 2 j ( T p 0 20 40 60 80 100 120 140 Data/Pred. 0.8 1 1.2 (b) ) [GeV] 1 j ( T p Events / 10 GeV 200 400 600 800 1000 Data Wt t t Others Uncertainty ATLAS -1 = 8 TeV, 20.3 fb s 2-jet 2-tag ) [GeV] 1 j ( T p 0 20 40 60 80 100 120 140 160 180 Data/Pred. 0.8 1 1.2 (c) ) [GeV] 2 j ( T p Events / 10 GeV 200 400 600 800 1000 1200 1400 1600 Data Wt t t Others Uncertainty ATLAS -1 = 8 TeV, 20.3 fb s 2-jet 2-tag ) [GeV] 2 j ( T p 0 20 40 60 80 100 120 140 Data/Pred. 0.8 1 1.2 (d)
Figure 4: Distributions of the pT of the leading jet ( j1) and the second-leading jet ( j2) in the (a,b) 2-jet 1-tag and
(c,d) 2-jet 2-tag regions. The simulated signal and background contributions are scaled to their expectations. The hatched area represents the sum in quadrature of the statistical and systematic uncertainties. The last bin includes the overflow.
5 Analysis
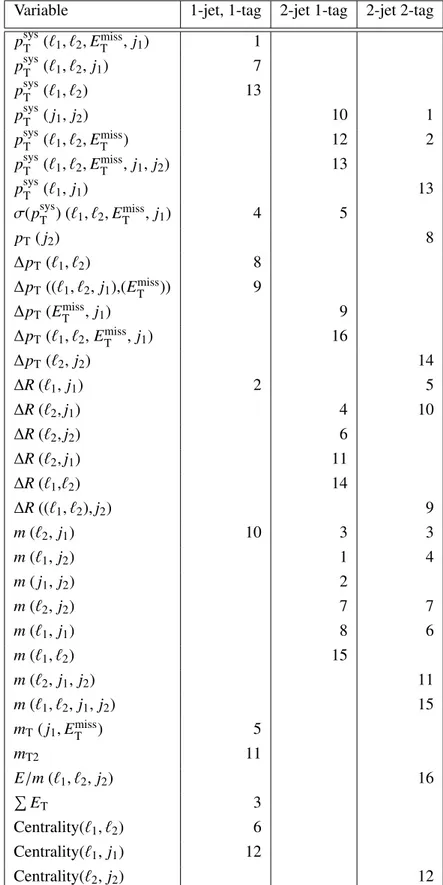
The separation of the Wt signal from the dominant background from top-quark pairs is accomplished through the use of a BDT algorithm [33] in the TMVA framework [73]. The BDTs are trained separ-ately in three regions, 1-jet 1-tag, 2-jet 1-tag and 2-jet 2-tag, using simulated Wt events as signal and simulated t¯t events as background. Three equal-size Wt samples are combined to reduce sensitivity to the modelling uncertainties and to maximise the number of events available for training: the Powheg-Box+Pythia sample with the DR scheme, the Powheg-Powheg-Box+Pythia sample with the DS scheme, and the Powheg-Box+Herwig sample with the DR scheme. The AdaBoost boosting algorithm is used [74]. This algorithm increases the event weight for mis-classified events for consecutive trees in the training. The final BDT is then the weighted average over all trees. The list of variables entering the BDT algorithm is chosen based on the power to discriminate the Wt signal from the t¯t background and is derived from a large set of kinematic variables that show good agreement between data and MC simulation. The number of input variables is a compromise between the achievable discrimination power and possible overtrain-ing. As a result of this optimisation procedure, 13, 16, and 16 variables are selected for the 1-jet 1-tag, 2-jet 1-tag, and 2-jet 2-tag regions, respectively.
The BDT input variables used in the three regions are explained below and are listed in Table3together with their importance ranking. The objects (denoted o1, . . . , on) used to define these kinematic variables are the leading- and second-leading lepton (`1and `2) and jet ( j1and j2) as well as EmissT . The kinematic variables are defined as follows.
• psys
T (o1, . . . , on), magnitude of the vector sum of the transverse momenta of the objects.
• P ET, the scalar sum of transverse energy of calorimeter cells. For cells associated with electrons and jets, the corresponding corrections are applied.
• σ (psys
T (o1, . . . , on)), the ratio of p sys
T to (HT+ P ET), where HT is the scalar sum of the transverse momenta of the objects.
• ∆pT(o1, o2), the difference in pTbetween the two objects. • ∆R(o1, o2), the separation of the two objects in φ–η space.
• mT(o1, o2), the transverse mass, given by p2pT(o1)pT(o2)(1 − cos∆φ).
• Centrality(o1, o2), the ratio of the scalar sum of the pTof the two objects to the sum of their energies. • m(o1, o2), the invariant mass of the system of the two objects.
• mT2, which contains information about the presence of the two neutrinos from the two W-boson decays [75–77]. The mT2algorithm creates candidates for the transverse momenta of the two neut-rinos, which must sum to give the missing transverse momentum. These are combined with the momenta of the two leptons to form the transverse mass of two candidate W bosons, with each also fulfilling a W-boson mass constraint. For each such candidate pair, the larger of the two transverse masses is kept. Then mT2is given by the smallest transverse mass in all possible candidate pairs. • E/m(o1, o2, o3), the ratio of the energy of the system of the three objects to the invariant mass of
Table 3: Discriminating variables used in the training of the BDT for each region. The number indicates the relative importance of this variable, with 1 referring to the most important variable. An empty field means that this variable is not used in this region.
Variable 1-jet, 1-tag 2-jet 1-tag 2-jet 2-tag
psysT (`1, `2, ETmiss, j1) 1 psysT (`1, `2, j1) 7 psysT (`1, `2) 13 psysT ( j1, j2) 10 1 psysT (`1, `2, ETmiss) 12 2 psysT (`1, `2, ETmiss, j1, j2) 13 psysT (`1, j1) 13 σ(psys T ) (`1, `2, E miss T , j1) 4 5 pT( j2) 8 ∆pT(`1, `2) 8 ∆pT((`1, `2, j1),(ETmiss)) 9 ∆pT(ETmiss, j1) 9 ∆pT(`1, `2, ETmiss, j1) 16 ∆pT(`2, j2) 14 ∆R (`1, j1) 2 5 ∆R (`2, j1) 4 10 ∆R (`2, j2) 6 ∆R (`2, j1) 11 ∆R (`1,`2) 14 ∆R ((`1, `2), j2) 9 m(`2, j1) 10 3 3 m(`1, j2) 1 4 m( j1, j2) 2 m(`2, j2) 7 7 m(`1, j1) 8 6 m(`1, `2) 15 m(`2, j1, j2) 11 m(`1, `2, j1, j2) 15 mT( j1, EmissT ) 5 mT2 11 E/m (`1, `2, j2) 16 P ET 3 Centrality(`1, `2) 6 Centrality(`1, j1) 12 Centrality(`2, j2) 12
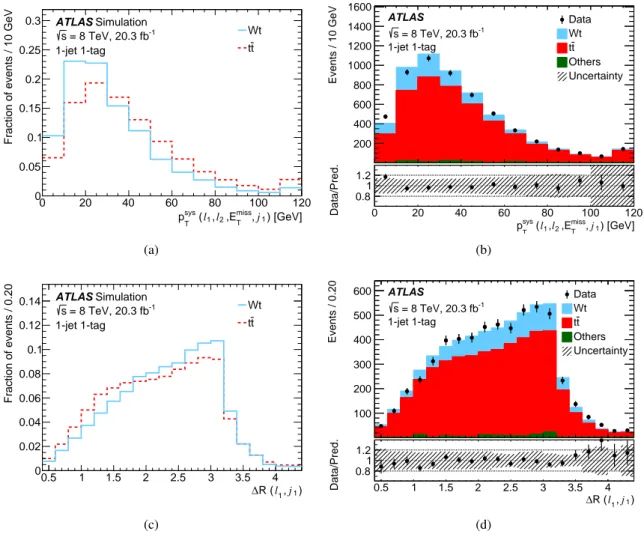
Figure5 compares the shapes of the most important variables in the 1-jet 1-tag region for Wt and t¯t events and shows a comparison of the data and the SM predictions. The most important variable is psysT (`1, `2, EmissT , j1), which is sensitive to the unidentified b-quark in t¯t events. This variable peaks at lower values for Wt and has a longer tail for t¯t. The second most important variable is the separation of the leading lepton and the jet, in φ-η space. These two objects originate from the same top quark in Wtevents, leading to a sharper peak than in t¯t events. Figure6shows the most important discriminating variables in the 2-jet regions. Here, the psysT distribution also peaks at lower values for Wt than for t¯t, but the distribution is also broader for Wt, resulting in a long tail. The invariant mass variables are important for 2-jet events, where half of the possible lepton–jet pairings correspond to the objects from the decay of one of the top quarks in t¯t events leading to a peak at lower invariant mass. For Wt, only one quarter of the possible pairings of jets and leptons correspond to the objects from the top-quark decay.
) [GeV] 1 j , T miss ,E 2 l , 1 l ( T sys p 0 20 40 60 80 100 120
Fraction of events / 10 GeV
0 0.05 0.1 0.15 0.2 0.25 0.3 Wt t t ATLAS Simulation -1 = 8 TeV, 20.3 fb s 1-jet 1-tag (a) ) [GeV] 1 j , T miss ,E 2 l , 1 l ( T sys p Events / 10 GeV 200 400 600 800 1000 1200 1400 1600 Data Wt t t Others Uncertainty ATLAS -1 = 8 TeV, 20.3 fb s 1-jet 1-tag ) [GeV] 1 j , T miss ,E 2 l , 1 l ( T sys p 0 20 40 60 80 100 120 Data/Pred. 0.81 1.2 (b) ) 1 j , 1 l R ( ∆ 0.5 1 1.5 2 2.5 3 3.5 4 Fraction of events / 0.20 0 0.02 0.04 0.06 0.08 0.1 0.12 0.14 Wt t t ATLAS Simulation -1 = 8 TeV, 20.3 fb s 1-jet 1-tag (c) ) 1 j , 1 l R ( ∆ Events / 0.20 100 200 300 400 500 600 Data Wt t t Others Uncertainty ATLAS -1 = 8 TeV, 20.3 fb s 1-jet 1-tag ) 1 j , 1 l R ( ∆ 0.5 1 1.5 2 2.5 3 3.5 4 Data/Pred. 0.8 1 1.2 (d)
Figure 5: Distributions of the two most important BDT input variables for the 1-jet 1-tag region. The distributions are shown for (a, b) the pTof the system of the leptons, jet and ETmissand (c, d) the∆R between the leading lepton
and the jet. Each contribution is normalised to unit area in (a, c) and to its expectation in (b, d). The hatched area represents the sum in quadrature of the statistical and systematic uncertainties. The last bin includes the overflow.
The BDT response for the three regions is shown in Figure7. The Wt signal is larger at positive BDT response values, while the t¯t background dominates for negative BDT response values. The BDT range in
) [GeV] 2 j , 1 l m ( 50 100 150 200 250 300
Fraction of events / 10 GeV
0 0.02 0.04 0.06 0.08 0.1 0.12 0.14 0.16 Wt t t ATLAS Simulation -1 = 8 TeV, 20.3 fb s 2-jet 1-tag (a) ) [GeV] 2 j , 1 l m ( Events / 10 GeV 200 400 600 800 1000 1200 Data Wt t t Others Uncertainty ATLAS -1 = 8 TeV, 20.3 fb s 2-jet 1-tag ) [GeV] 2 j , 1 l m ( 50 100 150 200 250 300 Data/Pred. 0.8 1 1.2 (b) ) [GeV] 2 j , 1 j ( T sys p 0 50 100 150 200
Fraction of events / 10 GeV
0 0.02 0.04 0.06 0.08 0.1 0.12 0.14 Wt t t ATLAS Simulation -1 = 8 TeV, 20.3 fb s 2-jet 2-tag (c) ) [GeV] 2 j , 1 j ( T sys p Events / 10 GeV 100 200 300 400 500 600 700 Data Wt t t Others Uncertainty ATLAS -1 = 8 TeV, 20.3 fb s 2-jet 2-tag ) [GeV] 2 j , 1 j ( T sys p 0 50 100 150 200 Data/Pred. 0.8 1 1.2 (d)
Figure 6: Distributions of the most important BDT input variables in the (a, b) 2-jet 1-tag and (c, d) 2-jet 2-tag regions. The distributions are shown for (a, b) the invariant mass of the system of the leading lepton and the second-leading jet and (c, d) the pTof the system of the two jets. Each contribution is normalised to unit area in (a,
c) and to its expectation in (b, d). The hatched area represents the sum in quadrature of the statistical and systematic uncertainties. The last bin includes the overflow.
each region is chosen to ensure sufficient simulation statistics in each bin. The BDT separates the signal from the background in all three regions, although even for high BDT response values in the 1-jet 1-tag region, there remains a large expected background from t¯t events. The BDT responses from Figure7are used in the profile likelihood fit swith this binning.
BDT Response -0.3 -0.2 -0.1 0 0.1 0.2 0.3 0.4 Fraction of events / 0.05 0 0.02 0.04 0.06 0.08 0.1 0.12 0.14 Wt t t ATLAS Simulation -1 = 8 TeV, 20.3 fb s 1-jet 1-tag (a) BDT Response Events / 0.05 100 200 300 400 500 600 700 DataWt t t Others Uncertainty ATLAS -1 = 8 TeV, 20.3 fb s 1-jet 1-tag BDT Response -0.3 -0.2 -0.1 0 0.1 0.2 0.3 0.4 Data/Pred. 0.8 1 1.2 (b) BDT Response -0.2 -0.1 0 0.1 0.2 0.3 Fraction of events / 0.05 0 0.05 0.1 0.15 0.2 Wt t t ATLAS Simulation -1 = 8 TeV, 20.3 fb s 2-jet 1-tag (c) BDT Response Events / 0.05 200 400 600 800 1000 1200 1400 1600 Data Wt t t Others Uncertainty ATLAS -1 = 8 TeV, 20.3 fb s 2-jet 1-tag BDT Response -0.2 -0.1 0 0.1 0.2 0.3 Data/Pred. 0.8 1 1.2 (d) BDT Response -0.3 -0.2 -0.1 0 0.1 0.2 Fraction of events / 0.05 0 0.05 0.1 0.15 0.2 0.25 Wt t t ATLAS Simulation -1 = 8 TeV, 20.3 fb s 2-jet 2-tag (e) BDT Response Events / 0.05 200 400 600 800 1000 1200 DataWt t t Others Uncertainty ATLAS -1 = 8 TeV, 20.3 fb s 2-jet 2-tag BDT Response -0.3 -0.2 -0.1 0 0.1 0.2 Data/Pred. 0.8 1 1.2 (f)
Figure 7: BDT response for (a, b) 1-jet 1-tag, (c, d) 2-jet 1-tag and (e, f) 2-jet 2-tag events. Each contribution is normalised to unit area in (a, c, e) and to its expectation in (b, d, f). The hatched area represents the sum in quadrature of the statistical and systematic uncertainties. The first bin includes the underflow and the last bin the overflow.
6 Systematic uncertainties
Systematic uncertainties affect the acceptance estimates for the signal and background processes. Some of the systematic uncertainties also affect the shape of the BDT response. Experimental sources of uncer-tainty arise from the modelling of jets, leptons and EmissT .
The impact of the uncertainty in the jet energy scale (JES) on the acceptance and shape of the BDT response for Wt and t¯t is evaluated in 22 uncorrelated components, each of which can have a pTand η de-pendence [44,78]. The largest components are related to the modelling and the heavy-flavour correction, with an acceptance uncertainty for Wt and t¯t events of 1–2%. The shape uncertainty is taken into ac-count for the JES component with the largest impact on the fit result (JES modelling component 1). The jet energy resolution uncertainty is evaluated by smearing the energy of each jet in the simulation and symmetrising the resulting change in acceptance and BDT response shape [79]. The resulting acceptance uncertainty for Wt and t¯t events is 1–3%, and the shape uncertainty is taken into account.
The uncertainties in the modelling of the jet reconstruction and the jet vertex fraction requirement are evaluated by randomly discarding jets according to the difference in jet reconstruction efficiency between the data and MC simulation and by varying the the jet vertex fraction requirement, respectively. These uncertainties have an impact on the acceptance for Wt and t¯t events of less than 1%. They do not change the shape of the BDT response.
Further uncertainties arise from the modelling of the trigger, reconstruction, and identification efficiencies for electrons [80] and muons [40], as well as from the modelling of the electron and muon energy scale and resolution [40, 81]. These have an effect on the acceptance for Wt and t¯t events of less than 1%, except for the electron identification uncertainty, which has an acceptance uncertainty for Wt and t¯t of 2%. These uncertainties do not change the shape of the BDT response.
Uncertainties in the modelling of the b-tagging efficiency and mis-tag rates are estimated from data [47,
48]. These uncertainties depend on the jet flavour and pT, and for mis-tag rates also on jet η. The un-certainty for b-jets is evaluated in six components, with the largest component having an acceptance uncertainty for Wt and t¯t events of 1–4%, depending on the analysis region [48]. The b-tag modelling uncertainties do not change the shape of the BDT response.
The variations in lepton and jet energies are propagated to the EmissT value. This uncertainty has additional contributions from the modelling of the energy deposits which are not associated with any reconstructed object [49]. Both an energy scale and an energy resolution component are considered. The corresponding acceptance uncertainty for Wt and t¯t events is less than 0.3%. The EmissT scale component also alters the shape of the BDT response.
Theoretical uncertainties are evaluated for the signal as well as the t¯t predictions. Figure 8shows the relative shift of the BDT response associated with four of the theory modelling uncertainties. The uncer-tainty on the Wt signal and the t¯t background associated with initial- and final-state radiation (ISR/FSR) is evaluated using Powheg-Box interfaced to Pythia. The renormalisation scale associated with the strong coupling αS is varied up and down by a factor of two in the matrix-element calculation and a Pythia Perugia 2012 tune is used to create samples with increased and decreased levels of radiation that are com-patible with 7 TeV ATLAS data [82]. For t¯t, the hdamp parameter of Powheg-Box [51], which affects the
amount of QCD radiation, is varied together with ISR/FSR. This uncertainty is treated as uncorrelated between Wt and t¯t events. Figure8shows that this uncertainty has a large effect on the acceptance and
The uncertainty associated with the NLO matching method is evaluated by comparing Powheg-Box with MC@NLO, both interfaced to Herwig. Figure8 shows that this uncertainty has a dependence on the shape of the BDT response. For Wt production, the largest impact of this uncertainty is to shift events between the 1-jet 1-tag and 2-jet 2-tag regions. For t¯t events, the impact of this uncertainty is on the acceptance, where it is 11–12%. This uncertainty is treated as correlated between Wt and t¯t events. The uncertainty associated with the modelling of the hadronisation and parton shower is evaluated by comparing samples where Powheg-Box is interfaced with Pythia to those where it is interfaced with Herwig. This uncertainty alters the shape of the BDT response.
For the Wt signal, the uncertainty associated with the scheme used to remove overlap with t¯t is evaluated by comparing the two different schemes: the nominal sample, generated with the DR scheme, is compared to a sample generated with the DS scheme. The relative shift of the BDT response is shown in Figure8. The relative shift of this uncertainty is about 5% in the signal region for 1-jet 1-tag events, and grows to large values in the background-dominated region for 2-jet events, where its evaluation is limited by simulation statistics and the predicted event yield is very small. This uncertainty alters the shape of the BDT response.
The evaluation of the PDF uncertainty follows the PDF4LHC prescription [31] using three different PDF
sets (CT10, MSTW2008nlo68cl [28] and NNPDF2.3 [32]). The uncertainty on the acceptance for Wt and t¯tevents is evaluated in each of the three analysis regions. The PDF uncertainty is considered correlated between Wt and t¯t events, except for t¯t 1-jet events, for which it is considered to be uncorrelated. The PDF uncertainty components that affect the t¯tacceptance in this region differ from the uncertainty components that affect the t¯t acceptance in the other regions [83].
The normalisation of the t¯t background has an uncertainty of 6% [65, 66]. The diboson background process has an uncertainty of 30% for 1-jet events and 40% for 2-jet events [84], which is treated as uncorrelated between different regions. The Z+jets and non-prompt or fake-lepton backgrounds have normalisation uncertainties of 60% to account for possible mismodelling of the jet multiplicity and the acceptance of these small backgrounds [85,86]. The Z+jets and non-prompt or fake-lepton normalisation uncertainties are treated as uncorrelated between background sources and regions.
The uncertainty on the integrated luminosity is 2.8%. It is derived, following the same methodology as that detailed in Ref. [87], from a preliminary calibration of the luminosity scale derived from beam-separation scans performed in November 2012. The luminosity uncertainty enters in the extraction of the cross-section as well as in the normalisation of the background processes that are normalised to theory predictions. The statistical uncertainty due to the finite size of the simulation samples is also taken into account.
7 Results
7.1 Measurement of the inclusive cross-section
A profile likelihood fit to the BDT classifier distributions is performed, using the RooStats software [88,
89], in order to determine the inclusive Wt cross-section, utilising the 1-jet 1-tag, 2-jet 1-tag, and 2-jet 2-tag regions. The inclusion of the 2-jet regions provides additional signal sensitivity and also helps to constrain the t¯t background normalisation and systematic uncertainties.
0.3 − −0.2 −0.1 0 0.1 0.2 0.3 0.4 Shift [%] 20 − 0 20 ATLAS Simulation -1 = 8 TeV, 20.3 fb s 1-jet 1-tag Wt BDT Response 0.3 − −0.2 −0.1 0 0.1 0.2 0.3 0.4 Shift [%] 20 − 0 20 t t ISR/FSR NLO matching method
DR/DS Hadronisation (a) 0.2 − −0.1 0 0.1 0.2 0.3 Shift [%] 20 − 0 20 ATLAS Simulation -1 = 8 TeV, 20.3 fb s 2-jet 1-tag Wt BDT Response 0.2 − −0.1 0 0.1 0.2 0.3 Shift [%] 20 − 0 20 t t ISR/FSR NLO matching method
DR/DS Hadronisation (b) 0.3 − −0.2 −0.1 0 0.1 0.2 Shift [%] 50 − 0 50 ATLAS Simulation -1 = 8 TeV, 20.3 fb s 2-jet 2-tag Wt BDT Response 0.3 − −0.2 −0.1 0 0.1 0.2 Shift [%] 50 − 0 50 t t ISR/FSR NLO matching method
DR/DS Hadronisation
(c)
Figure 8: Relative shift of the BDT response associated with systematic variations of ISR/FSR, NLO matching method, DR/DS and hadronisation for (a) 1-jet 1-tag, (b) 2-jet 1-tag, and (c) 2-jet 2-tag events. DR refers to the diagram-removal scheme, DS to the diagram-subtraction scheme.
The binned likelihood function is constructed as the product of Poisson probability terms over all bins considered in the analysis. This likelihood depends on the signal-strength parameter µ, which is a mul-tiplicative factor on the unconstrained Wt yield prediction. Nuisance parameters (denoted θ) are used to encode the effects of the various sources of systematic uncertainty on the signal and background expecta-tions. These nuisance parameters are implemented in the likelihood function with multiplicative Gaussian or log-normal constraints with mean θ0and standard deviation∆θ. The likelihood is then maximised with respect to the full set of µ and θ parameters. The values of these parameters after maximisation are referred to as ˆµ, ˆθ, and∆ˆθ.
The expected cross-section is obtained from a fit to the so-called Asimov dataset [90], with the signal and all backgrounds scaled to their predicted sizes [26]. The expected measurement is ˆµexp = 1.00+0.17−0.18. The observed result for the signal strength is ˆµobs = 1.03+0.16−0.17, which corresponds to a measured cross-section of 23.0 ± 1.3 (stat.)+3.2−3.5(syst.) ± 1.1 (lumi.) pb. Including systematic uncertainties, the observed (expected) significance of the signal compared to the background-only hypothesis is 7.7 (6.9) standard deviations, obtained using an asymptotic approximation [90].
The post-fit (pre-fit) effect of each individual systematic uncertainty on ˆµ is calculated by fixing the corresponding nuisance parameter at ˆθ+ ∆ˆθ (ˆθ + ∆θ), and performing the fit again. The difference between the default and the modified ˆµ,∆ˆµ, represents the effect on ˆµ of this particular uncertainty. The pull ((ˆθ − θ0)/∆θ), and the pre-fit and post-fit impacts for the nuisance parameters with the largest impact on ˆµ are shown in Figure9. Since the total number of observed events in the 2-jet regions is about 14000, with a Wt signal fraction of about 6%, the nuisance parameters that have a t¯t acceptance uncertainty of more than about 2% can be constrained in the fit. This applies to the jet energy resolution and t¯t normalisation uncertainties, amongst others. The EmissT scale uncertainty has a shape dependence in the 1-jet 1-tag region for Wt and t¯t, which results in the corresponding nuisance parameter being shifted but not much constrained. The theory modelling uncertainties due to ISR/FSR, DR/DS, and NLO matching method have large pre-fit and post-fit impacts. The nuisance parameter for ISR/FSR Wt is shifted and constrained in the fit due to its BDT response shape dependence, shown in Figure8. This uncertainty has the largest impact on ˆµ, both pre-fit and post-fit. The ISR/FSR t¯t uncertainty has a smaller post-fit impact on ˆµ and is constrained due its acceptance and shape dependence. In a test where the ISR/FSR uncertainty is considered to be correlated between Wt and t¯t events, the expected uncertainty on ˆµ is reduced to ±0.16. The nuisance parameter for the NLO matching method uncertainty is constrained by the t¯t background because of the large acceptance component and shape dependence of the NLO matching method uncertainty.
Table4summarises the contributions from the various sources of systematic uncertainty to the uncertain-ties on the observed fit result. The total uncertainty in the table is the uncertainty obtained from the full fit, and is therefore not identical to the sum in quadrature of the components, due to correlations that the fit induces between the uncertainties. The largest contributions to the cross-section uncertainty are from the modelling of ISR/FSR and from the jet energy resolution and scale.
The BDT response for each region is shown normalised to the fit result in Figure10. The dependence of the cross-section on the quark mass is evaluated using Wt and t¯t simulation samples with various top-quark masses. The cross-section depends linearly on the top-top-quark mass due to changes in acceptance, with a slope of 1.11 pb/GeV.
Pull
1
−
0
1
t Normalisation t t ISR/FSR t NLO matching methodPileup Electron identification DR/DS Luminosity JES modelling comp. 1 scale
miss T
E
Jet energy resolution ISR/FSR Wt
µ
∆
0.1
−
0
0.1
ATLAS
-1= 8 TeV, 20.3 fb
s
θ
∆
)/
0θ
-θ
Pull (
µ
pre-fit impact on
σ
1
±
µ
post-fit impact on
σ
1
±
Figure 9: Effect on the uncertainty on the fitted value of the signal strength ˆµ (∆ˆµ) and pull of the dominant nuisance parameters, ordered by their impact on ˆµ. The shaded and hashed areas refer to the top axis: the shaded bands show the initial impact of that source of uncertainty on the precision of ˆµ; the hatched areas show the impact on the measurement of that source of uncertainty, after the profile likelihood fit, at the ±1σ level. The points and associated error bars show the pull of the nuisance parameters and their uncertainties and refer to the bottom axis. A mean of zero and a width of 1 would imply no constraint due to the profile likelihood fit. Only the 11 uncertainties with the largest impact on ˆµ are shown.
Events / 0.05 100 200 300 400 500 600 700 DataWt t t Others Uncertainty ATLAS -1 = 8 TeV, 20.3 fb s 1-jet 1-tag Post-fit BDT Response 0.3 − −0.2 −0.1 0 0.1 0.2 0.3 0.4 Data/Pred. 0.8 1 1.2 (a) Events / 0.05 200 400 600 800 1000 1200 1400 1600 Data Wt t t Others Uncertainty ATLAS -1 = 8 TeV, 20.3 fb s 2-jet 1-tag Post-fit BDT Response 0.2 − −0.1 0 0.1 0.2 0.3 Data/Pred. 0.8 1 1.2 (b) Events / 0.05 200 400 600 800 1000 1200 DataWt t t Others Uncertainty ATLAS -1 = 8 TeV, 20.3 fb s 2-jet 2-tag Post-fit BDT Response 0.3 − −0.2 −0.1 0 0.1 0.2 Data/Pred. 0.81 1.2 (c)
Figure 10: Distribution of the post-fit BDT response for (a) 1-jet 1-tag, (b) 2-jet 1-tag, and (c) 2-jet 2-tag events. The signal, backgrounds and uncertainties are scaled to the fit result. The first bin includes the underflow and the last bin the overflow.
Table 4: Summary of the relative uncertainties on the Wt cross-section measurement. Detector uncertainties are grouped into categories. All sources of uncertainty within a category are added in quadrature to obtain the category uncertainty. Uncertainty Impact on ˆµ [%] Statistical ±5.8 Luminosity ±4.7 Theory modelling ISR/FSR +8.2 −9.4 Hadronisation ±1.7
NLO matching method ±2.5
PDF ±0.6 DR/DS +2.2−4.8 Detector Jet +9.0−9.9 Lepton ±3.0 ETmiss ±5.5 b-tag ±1.0 Background norm. +2.9−2.6 Total +16−17 7.2 Constraints on | fLVVt b| and |Vt b|
The inclusive cross-section measurement provides a direct determination of the magnitude of the CKM matrix element Vtb. The ratio of the measured cross-section to the theoretical prediction is equal to | fLVVtb|2, where the form factor fLV could be modified by new physics or radiative corrections through anomalous coupling contributions, for example those in Refs. [3, 91, 92]. The Wt production and top-quark decays through |Vts| and |Vtd| are assumed to be small. A lower limit on |Vtb| is obtained for fLV= 1 as in the SM, without assuming CKM unitarity [5, 93]. An additional systematic uncertainty due to a variation of the top-quark mass by 1 GeV is included in the Vtb extraction. The uncertainties on the theoretical cross-section due to the variation of the renormalisation and factorisation scale (0.6 pb), the PDF uncertainty (1.4 pb), and the beam-energy uncertainty [94] (0.38 pb) are also accounted for.
The value for | fLVVtb| is extracted from the | fLVVtb|2 likelihood, which is assumed to be Gaussian. The lower limit on |Vtb|2 corresponds to 95% of the integral of this likelihood, setting fLV = 1 and starting at 1. The measured value of | fLVVtb| is 1.01 ± 0.10, and the corresponding lower limit on |Vtb| at the 95% confidence level is 0.80.
8 Cross-section measurement inside a fiducial acceptance
The cross-section for the production of events containing a top quark and a W boson is measured in a fiducial region to allow a more robust comparison to the theoretical prediction without extrapolating to regions outside of the detector acceptance. The fiducial measurement reduces the sensitivity of the cross-section to theory modelling uncertainties. The measurement can also be compared to particle-level predictions for the inclusive WWb and WWbb processes at NLO, once those calculations become available [36,95]. The fiducial acceptance requires two leptons and exactly one b-jet at the particle level. This encompasses not only Wt production but also t¯t production where one of the b-quarks from the top-quark decays is not in the particle-level acceptance. The fiducial cross-section is measured by fitting the sum of the Wt and t¯t contributions to data in the 1-jet 1-tag region. Control regions are not used in the fit.
8.1 Fiducial selection
The definition of the fiducial acceptance is based on MC simulation and uses particle-level physics objects constructed of stable particles with a mean lifetime τ > 0.3 × 10⁻¹⁰s. Electrons and muons are required to originate from W-boson decays, either directly or via leptonically decaying τ leptons. The pT of each of the leptons is corrected by adding the energy and momentum of photons inside a cone of size∆R = 0.1 around the lepton direction. Electrons and muons are required to have pT > 25 GeV and |η| < 2.5. Jets are clustered from particles using the anti-kt algorithm with radius parameter R = 0.4. Neutrinos, elec-trons and muons from W-boson decays as well as particles resulting from pileup are excluded from jet clustering. Particles from the underlying event are included. The particle-level jets are required to have pT > 20 GeV and |η| < 2.5 and are matched with nearby b-hadrons with a pT of at least 5 GeV using the ghost tagging method [96]. Jets within ∆R = 0.2 of the nearest electron are removed from the list. Following that, electrons and muons within∆R = 0.4 of the nearest jet are removed. Missing transverse momentum is calculated using neutrinos from W-boson decays. The Wt and t¯t events pass the fiducial se-lection if they have exactly two leptons, exactly one b-jet and EmissT > 20 GeV. The numbers of simulated Wtand t¯t events passing this fiducial selection are shown in Table5, and Wt production contributes 26% of these particle-level events.
Simulated Wt and t¯t events that satisfy the detector-level selection criteria are separated into two categor-ies: in-fiducial (satisfying the fiducial selection criteria) and out-of-fiducial (the rest). Table5shows the number of events for Wt and t¯t in each category. The Wt contribution is 25% of the in-fiducial events, but only 10% of the out-of-fiducial events. The out-of-fiducial events that pass the detector-level selection typically have two or more particle-level jets, only one of which is also reconstructed at the detector level. Thus the t¯t contribution to the out-of-fiducial events is larger.
8.2 Systematic uncertainties
The sources of systematic uncertainty in the inclusive cross-section measurement are also considered for the fiducial measurement. The object reconstruction and background-normalisation uncertainties also apply in this measurement (except the t¯t normalisation uncertainty, as discussed below). For in-fiducial events, a variation in the theory modelling uncertainties (DR/DS, ISR/FSR, hadronisation, NLO match-ing method, and PDF) changes the detector-level and fiducial acceptances in the same direction, which
Table 5: Number of expected events at the particle-level and for the detector-level selection for Wt and t¯t. The uncertainty for the particle-level includes ISR/FSR, NLO matching method, and for Wt also hadronisation, all added in quadrature. The uncertainty for the detector-level selection includes all sources of uncertainty, added in quadrature.
Particle-level Detector-level selection Process selection in-fiducial out-of-fiducial
Wt 4 200 ± 100 810 ± 160 230 ± 40
t¯t 12 000 ± 2 000 2 400 ± 500 2 100 ± 400
reduces the impact of these uncertainties. Since this does not affect out-of-fiducial events, these theory modelling uncertainties are treated as uncorrelated between in- and out-of-fiducial events.
An additional uncertainty accounts for the relative fractions of Wt and t¯t due to the uncertainty on the theoretical predictions. The fraction of each type of signal is allowed to vary within their theoretical predictions, keeping the sum constant.
8.3 Results
The fiducial cross-section is measured in a profile likelihood fit to data in the 1-jet 1-tag region. In-fiducial and out-of-fiducial Wt and t¯t events are scaled by the same cross-section scale factor µfidin the fit. The measured fiducial cross-section for Wt and t¯t production is 0.85 ± 0.01 (stat.)+0.06−0.07(syst.) ± 0.03 (lumi.) pb, which corresponds to a total uncertainty of 8%. The expected uncertainty is also 8%. The impact of the systematic uncertainties on this measurement is summarised in Table 6. The relative uncertainties are smaller in the fiducial measurement than in the inclusive measurement (cf. Table4) because both Wt and t¯tevents are considered signal and because of the definition of the fiducial acceptance. The only exception is the b-tag uncertainty, which is larger in the fiducial measurement because only 1-jet 1-tag events are used in the fit.
The measured fiducial cross-section is compared to theoretical predictions for the sum of the fiducial Wt and t¯t cross-sections in Figure11. The uncertainty on the theory predictions accounts for scale and PDF contributions. The MSTW2008 and NNPDF2.3 predictions are obtained by re-weighting the simulated Mc@nlo sample. The uppermost result for the predicted fiducial cross-section is based on the fiducial acceptances and the sample normalisation utilised in this analysis. The fiducial acceptances are computed from the nominal Powheg-Box+Pythia samples. The Wt and t¯t cross-sections are normalised to their NLO+NNLL and NNLO+NNLL predictions, respectively. The other results utilise the theoretical cross-sections as computed by the respective generator.
Cross-section [pb] 0.3 0.4 0.5 0.6 0.7 0.8 0.9 at NNLO+NNLL t t σ at NLO+NNLL, Wt σ DR CT10 YTHIA +P OX -B OWHEG P at NLO t t σ and Wt σOWHEG-BOX+PYTHIA DR CT10 P at NLO t t σ and Wt σOWHEG-BOX+PYTHIA DS CT10 P at NLO t t σ and Wt σOWHEG-BOX+HERWIG DR CT10 P at NLO t t σ and Wt σ DR CT10 ERWIG MC@NLO+H at NLO t t σ and Wt σ DR MSTW2008 ERWIG MC@NLO+H at NLO t t σ and Wt σ DR NNPDF 2.3 ERWIG MC@NLO+H
Predicted fiducial cross-sections:
cross-section t Measured fiducial Wt+t Total uncertainty Stat. uncertainty ATLAS s = 8 TeV, 20.3 fb-1
Figure 11: Comparison of the measured fiducial cross-section to theoretical predictions in a fiducial acceptance requiring two leptons with pT> 25 GeV and |η| < 2.5, one jet with pT> 20 GeV and |η| < 2.5, and ETmiss> 20 GeV.
The predictions are computed at NLO accuracy for the fiducial acceptance and the inclusive cross-section, except for
the top line, for which the inclusive cross-sections for Wt and t¯t are computed at NLO+NNLL and NNLO+NNLL
Table 6: Summary of the uncertainties on the observed fit result for the fiducial cross-section. Detector uncertainties are grouped into categories. All sources of uncertainty within a category are added in quadrature to obtain the category uncertainty.
Uncertainty Impact on ˆµfid[%]
Statistical 1.0
Luminosity 3.1
Theory modelling
ISR/FSR 4.2
Hadronisation 0.8
NLO matching method 0.7
PDF <0.1 Ratio Wt/t¯t 2.2 DR/DS 0.1 Detector Jet 5.2 Lepton 2.3 ETmiss 0.2 b-tag 2.3 Background norm. <0.1 Total 8.2
9 Conclusion
The inclusive cross-section for the production of a single top quark in association with a W boson has been measured in proton-proton collisions at a centre-of-mass energy of 8 TeV, using dilepton events from 20.3 fb−1 of data recorded by the ATLAS detector at the LHC. Wt production is observed with a significance of 7.7 σ. The measured cross-section is
23.0 ± 1.3 (stat.)+3.2−3.5(syst.) ± 1.1 (lumi.) pb ,
in agreement with the NLO+NNLL expectation. The measured cross-section is used to extract a direct measurement of the left-handed form factor times the CKM matrix element | fLVVtb| of 1.01 ± 0.10. The lower limit on |Vtb| is 0.80 at the 95% CL, without assuming unitarity of the CKM matrix. The cross-section for the production of a W boson and a top quark (including Wt and t¯t) has also been measured in a fiducial acceptance requiring two leptons with pT > 25 GeV and |η| < 2.5, one jet with pT > 20 GeV and |η| < 2.5, and Emiss
T > 20 GeV. The fiducial cross-section is
0.85 ± 0.01 (stat.)+0.06−0.07(syst.) ± 0.03 (lumi.) pb .
Acknowledgements
We thank CERN for the very successful operation of the LHC, as well as the support staff from our institutions without whom ATLAS could not be operated efficiently.
We acknowledge the support of ANPCyT, Argentina; YerPhI, Armenia; ARC, Australia; BMWFW and FWF, Austria; ANAS, Azerbaijan; SSTC, Belarus; CNPq and FAPESP, Brazil; NSERC, NRC and CFI, Canada; CERN; CONICYT, Chile; CAS, MOST and NSFC, China; COLCIENCIAS, Colombia; MSMT CR, MPO CR and VSC CR, Czech Republic; DNRF, DNSRC and Lundbeck Foundation, Den-mark; IN2P3-CNRS, CEA-DSM/IRFU, France; GNSF, Georgia; BMBF, HGF, and MPG, Germany; GSRT, Greece; RGC, Hong Kong SAR, China; ISF, I-CORE and Benoziyo Center, Israel; INFN, Italy; MEXT and JSPS, Japan; CNRST, Morocco; FOM and NWO, Netherlands; RCN, Norway; MNiSW and NCN, Poland; FCT, Portugal; MNE/IFA, Romania; MES of Russia and NRC KI, Russian Feder-ation; JINR; MESTD, Serbia; MSSR, Slovakia; ARRS and MIZŠ, Slovenia; DST/NRF, South Africa; MINECO, Spain; SRC and Wallenberg Foundation, Sweden; SERI, SNSF and Cantons of Bern and Geneva, Switzerland; MOST, Taiwan; TAEK, Turkey; STFC, United Kingdom; DOE and NSF, United States of America. In addition, individual groups and members have received support from BCKDF, the Canada Council, CANARIE, CRC, Compute Canada, FQRNT, and the Ontario Innovation Trust, Canada; EPLANET, ERC, FP7, Horizon 2020 and Marie Skłodowska-Curie Actions, European Union; Investisse-ments d’Avenir Labex and Idex, ANR, Region Auvergne and Fondation Partager le Savoir, France; DFG and AvH Foundation, Germany; Herakleitos, Thales and Aristeia programmes co-financed by EU-ESF and the Greek NSRF; BSF, GIF and Minerva, Israel; BRF, Norway; the Royal Society and Leverhulme Trust, United Kingdom.
The crucial computing support from all WLCG partners is acknowledged gratefully, in particular from CERN and the ATLAS Tier-1 facilities at TRIUMF (Canada), NDGF (Denmark, Norway, Sweden), CC-IN2P3 (France), KIT/GridKA (Germany), INFN-CNAF (Italy), NL-T1 (Netherlands), PIC (Spain), ASGC (Taiwan), RAL (UK) and BNL (USA) and in the Tier-2 facilities worldwide.
References
[1] N. Cabibbo, Unitary Symmetry and Leptonic Decays, Phys. Rev. Lett. 10 (1963) 531.
[2] M. Kobayashi and T. Maskawa, CP-Violation in the Renormalizable Theory of Weak Interaction, Prog. Theor. Phys. 49 (1973) 652.
[3] G. L. Kane, G. A. Ladinsky and C. P. Yuan,
Using the Top Quark for Testing Standard Model Polarization and CP Predictions, Phys. Rev. D45 (1992) 124–141.
[4] V. M. Abazov et al., D0 Collaboration,
Combination of searches for anomalous top quark couplings with 5.4 fb−1of p¯p collisions, Phys. Lett. B 713 (2012) 165–171, arXiv:1204.2332 [hep-ex].
[5] J. Alwall et al., Is V(tb) ' 1?, Eur. Phys. J. C49 (2007) 791–801, arXiv:hep-ph/0607115. [6] T. M. P. Tait and C.-P. Yuan, Single top quark production as a window to physics beyond the
standard model, Phys. Rev. D 63 (2000) 014018, arXiv:hep-ph/0007298.
[7] Q. H. Cao, J. Wudka and C.-P. Yuan, Search for new physics via single top production at the LHC, Phys. Lett. B 658 (2007) 50–56, arXiv:0704.2809 [hep-ph].
[8] J. Nutter, R. Schwienhorst, D. G. E. Walker and J. -H. Yu, Single Top Production as a Probe of B-prime Quarks, Phys. Rev. D 86 (2012) 094006, arXiv:1207.5179 [hep-ex].
[9] ATLAS Collaboration, Search for single b∗-quark production with the ATLAS detector at √
s= 7 TeV, Phys. Lett. B 721 (2013) 171, arXiv:1301.1583 [hep-ex].
[10] V. M. Abazov et al., D0 Collaboration, Model-independent measurement of t-channel single top quark production in p¯p collisions at √s= 1.96 TeV, Phys. Lett. B 705 (2011) 313,
arXiv:1105.2788 [hep-ex].
[11] CDF and D0 Collaborations, Tevatron combination of single-top-quark cross sections and determination of the magnitude of the Cabibbo-Kobayashi-Maskawa matrix element Vtb(2015), arXiv:1503.05027 [hep-ex].
[12] V. M. Abazov et al., D0 Collaboration, Evidence for s-channel single top quark production in p¯p collisions at √s= 1.96 TeV, Phys. Lett. B726 (2013) 656–664, arXiv:1307.0731 [hep-ex]. [13] T. Aaltonen et al., CDF Collaboration, Evidence for s-channel Single-Top-Quark Production in
Events with one Charged Lepton and two Jets at CDF, Phys. Rev. Lett. 112 (2014) 231804, arXiv:1402.0484 [hep-ex].
[14] CDF and D0 Collaborations, Observation of s-channel production of single top quarks at the Tevatron, Phys. Rev. Lett. 112 (2014) 231803, arXiv:1402.5126 [hep-ex].
[15] T. Aaltonen et al., CDF Collaboration, Observation of Electroweak Single Top-Quark Production, Phys. Rev. Lett. 103 (2009) 092002, arXiv:0903.0885 [hep-ex].
[16] V. M. Abazov et al., D0 Collaboration, Observation of Single Top-Quark Production, Phys. Rev. Lett. 103 (2009) 092001, arXiv:0903.0850 [hep-ex].
[17] Tevatron Electroweak Working Group for the CDF and D0 Collaborations, Combination of CDF and D0 Measurements of the Single Top Production Cross Section(2009),
[18] ATLAS Collaboration, Measurement of the t-channel single top-quark production cross section in pp collisions at √s= 7 TeV with the ATLAS detector, Phys. Lett. B 717 (2012) 330,
arXiv:1205.3130 [hep-ex].
[19] ATLAS Collaboration, Comprehensive measurements of t-channel single top-quark production cross sections at √s= 7 TeV with the ATLAS detector, Phys. Rev. D 90 (2014) 112006, arXiv:1406.7844 [hep-ex].
[20] CMS Collaboration, Measurement of the single-top-quark t-channel cross section in pp collisions at √s= 7 TeV, JHEP 1212 (2012) 035, arXiv:1209.4533 [hep-ex].
[21] CMS Collaboration, Measurement of the t-channel single-top-quark production cross section and of the |Vtb| CKM matrix element in pp collisions at
√
s= 8 TeV, JHEP 1406 (2014) 090, arXiv:1403.7366 [hep-ex].
[22] ATLAS Collaboration, Search for s-channel single top-quark production in proton–proton collisions at √s= 8 TeV with the ATLAS detector, Phys. Lett. B 740 (2015) 118,
arXiv:1410.0647 [hep-ex].
[23] ATLAS Collaboration, Evidence for the associated production of a W boson and a top quark in ATLAS at √s= 7 TeV, Phys. Lett. B 716 (2012) 142, arXiv:1205.5764 [hep-ex].
[24] CMS Collaboration, Evidence for associated production of a single top quark and W boson in pp collisions at √s= 7 TeV, Phys. Rev. Lett. 110 (2013) 022003, arXiv:1209.3489 [hep-ex]. [25] CMS Collaboration, Observation of the associated production of a single top quark and a W
boson in pp collisions at √s= 8 TeV, Phys. Rev. Lett. 112 (2014) 231802, arXiv:1401.2942 [hep-ex].
[26] N. Kidonakis, Two-loop soft anomalous dimensions for single top quark associated production with a W- or H-, Phys. Rev. D 82 (2010) 054018, arXiv:1005.4451 [hep-ph].
[27] ATLAS, CDF, CMS and D0 Collaborations, First combination of Tevatron and LHC measurements of the top-quark mass(2014), arXiv:1403.4427 [hep-ex].
[28] A. D. Martin, W. J. Stirling, R. S. Thorne and G. Watt, Parton distributions for the LHC, Eur. Phys. J. C 63 (2009) 189, arXiv:0901.0002 [hep-ph].
[29] M. Aliev et al., HATHOR: HAdronic Top and Heavy quarks crOss section calculatoR, Comput. Phys. Commun. 182 (2011) 1034–1046, arXiv:1007.1327 [hep-ph].
[30] P. Kant et al., HatHor for single top-quark production: Updated predictions and uncertainty estimates for single top-quark production in hadronic collisions,
Comput. Phys. Commun. 191 (2015) 74–89, arXiv:1406.4403 [hep-ph].
[31] M. Botje et al., The PDF4LHC Working Group Interim Recommendations, CERN, Geneva Switzerland (2011), arXiv:1101.0538 [hep-ph].
[32] R. D. Ball et al., Parton distributions with QED corrections, Nucl.Phys. B 877 (2013) 290–320, arXiv:1308.0598 [hep-ph].
[33] J. H. Friedman, Stochastic Gradient Boosting, Comput. Stat. Data Anal. 38.4 (2002) 367–378. [34] J. M. Campbell and F. Tramontano, Next-to-leading order corrections to Wt production and
decay, Nucl. Phys. B 726 (2005) 109–130, arXiv:hep-ph/0506289.
[35] S. Frixione, E. Laenen, P. Motylinski and B. R. Webber, Single top production in MC@NLO, JHEP 0603 (2006) 092, arXiv:hep-ph/0512250.