Publisher’s version / Version de l'éditeur:
Vous avez des questions? Nous pouvons vous aider. Pour communiquer directement avec un auteur, consultez la première page de la revue dans laquelle son article a été publié afin de trouver ses coordonnées. Si vous n’arrivez pas à les repérer, communiquez avec nous à PublicationsArchive-ArchivesPublications@nrc-cnrc.gc.ca.
Questions? Contact the NRC Publications Archive team at
PublicationsArchive-ArchivesPublications@nrc-cnrc.gc.ca. If you wish to email the authors directly, please see the first page of the publication for their contact information.
https://publications-cnrc.canada.ca/fra/droits
L’accès à ce site Web et l’utilisation de son contenu sont assujettis aux conditions présentées dans le site LISEZ CES CONDITIONS ATTENTIVEMENT AVANT D’UTILISER CE SITE WEB.
13th International Symposium on Aerodynamics and Ventilation of Vehicle
Tunnels [Proceedings], pp. 167-181, 2009-05-13
READ THESE TERMS AND CONDITIONS CAREFULLY BEFORE USING THIS WEBSITE. https://nrc-publications.canada.ca/eng/copyright
NRC Publications Archive Record / Notice des Archives des publications du CNRC :
https://nrc-publications.canada.ca/eng/view/object/?id=f1e5de26-15c0-4876-abbc-73fb0732382c
https://publications-cnrc.canada.ca/fra/voir/objet/?id=f1e5de26-15c0-4876-abbc-73fb0732382c
NRC Publications Archive
Archives des publications du CNRC
This publication could be one of several versions: author’s original, accepted manuscript or the publisher’s version. / La version de cette publication peut être l’une des suivantes : la version prépublication de l’auteur, la version acceptée du manuscrit ou la version de l’éditeur.
Access and use of this website and the material on it are subject to the Terms and Conditions set forth at
Optimization of emergency ventilation strategies in a curved section of
a road tunnel
http://irc.nrc-cnrc.gc.ca
Opt im izat ion of e m e rge ncy ve nt ilat ion
st rat e gie s in a c ur ve d se c t ion of a roa d
t unne l
N R C C - 5 1 2 8 9
K a s h e f , A . ; S a b e r , H . H . ; G a o , L .
M a y 2 0 0 9
A version of this document is published in / Une version de ce document se trouve dans:
13th International Symposium on Aerodynamics and Ventilation of Vehicle
Tunnels, New Brunswick, New Jersey, USA, May 13-15, 2009, pp. 167-181.
The material in this document is covered by the provisions of the Copyright Act, by Canadian laws, policies, regulations and international agreements. Such provisions serve to identify the information source and, in specific instances, to prohibit reproduction of materials without written permission. For more information visit http://laws.justice.gc.ca/en/showtdm/cs/C-42
Les renseignements dans ce document sont protégés par la Loi sur le droit d'auteur, par les lois, les politiques et les règlements du Canada et des accords internationaux. Ces dispositions permettent d'identifier la source de l'information et, dans certains cas, d'interdire la copie de documents sans permission écrite. Pour obtenir de plus amples renseignements : http://lois.justice.gc.ca/fr/showtdm/cs/C-42
Optimization of emergency ventilation strategies in a curved
section of a roadway tunnel
AHMED KASHEF1, HAMED H. SABER1 and LIXIN GAO2
1
National Research Council of Canada, Institute for Research in Construction 1200 Montréal Road, Bldg. M59, Ottawa, Ontario K1A 0R6 Canada
2
School of Municipal and Environmental Engineering, Harbin Institute of Technology, P. R. China 150090
1 ABSTRACT
Both numerical and experimental studies were performed to evaluate the effectiveness of in-place emergency ventilation strategies to control smoke spread in a fire event in a roadway tunnel. The experimental study was conducted to provide the necessary initial and boundary conditions for the numerical phase of the investigation. A fire size of 1 MW was used in all fire tests to minimize the risk of damage to the tunnel and its associated systems while producing reliable data for visualizing smoke movement in the tunnel. The numerical study used Computational Fluid Dynamics technique to investigate smoke removal in the tunnel for a larger fire size of 30 MW (bus or truck on fire). In total, four field fire tests and seven numerical simulations were conducted. Based on the study results, recommendations were made to optimize tunnel ventilation scenarios. This article presents the details of the study as well as the recommendations made.
2 INTRODUCTION
The provision of a safe egress route that is free of smoke and hot gases is the main objective for a tunnel Emergency Ventilation System (EVS). Methods of controlling contaminants and smoke from a fire in a tunnel using EVS include longitudinal airflow, smoke extraction and smoke dilution. Tunnel operators must implement a strategy of smoke removal, which consists of selecting a sequence of fan operation. It is also necessary to control the phenomenon of “backlayering”. The backlayering phenomenon is defined as the situation in which smoke moves against the airflow provided by the ventilation system upstream of the fire (UOF) creating an environment that poses a danger to both tunnel users and emergency responders. UOF denotes the direction from which traffic flows.
In the event of a fire, the smoke movement and its degree of stratification depend mainly on the airflow in the tunnel. With no airflow in the fire zone, the buoyant smoke travels upwards and then moves symmetrically on both sides of the fire [1]. Smoke cools down and loses its stratification as it travels away from the fire due to the combined effect of convective and radiative heat exchange between the smoke and tunnel ceiling and walls as well as mixing with fresh air. As a result, smoke layer descends and starts to fill the
entire tunnel cross-section reducing visibility. Other parameters that affect the smoke flow [1] and stratification are: heat release rate, tunnel length, cross-section and grade, traffic flow, and meteorological conditions. Establishing airflow requirements for roadway tunnels and consequently the capacity of the EVS is a challenging task due to the difficulty of controlling many variables (e.g. changes in traffic patterns and modifications to the tunnel).
A study has been conducted at the National Research Council of Canada (NRC) to evaluate the performance of the EVS in the event of a fire in a roadway tunnel. This study assessed the ability of in-place emergency ventilation strategies to control smoke spread and minimize its impact on tunnel users. Both numerical and experimental studies were performed to achieve this objective. This article describes the in-situ fire tests and presents test measurements used to provide the initial and boundary conditions for the Computational Fluid Dynamics (CFD) simulations. The CFD simulations were conducted using a fire load of 30 MW (a bus or truck on fire). With a restriction on hazardous goods in the tunnel, this fire load represents a rational design fire [2]. Based on this study, optimized ventilation strategies were identified for the tunnel section.
3 TUNNEL SECTION DESCRIPTION AND VENTILATION SYSTEM The tunnel under investigation, constructed in 1974, crosses the heart of a downtown area over a 2.16 km length in the east-west direction. This paper focuses on a section of the tunnel, which is about 853 m long. This section extends from CH 17+00 (east portal) to CH 45+00 (west portal) (Figure 1). . In the context of this paper, distances along the tunnel are expressed in Chainages (CHs). The Chainage CH n + aa is the distance from a datum, where n is the distance in hundreds of feet and aa is the distance in feet (two digits). For example CH 17 + 30 means the distance from the datum equals 527.3 m (1730 ft). Traffic travels from the east towards the west. The height of the tunnel section is approximately 5.0 m and has a variable width along the length of the section that changes from 22.0 m (5-lanes – east portal) to 5.0 m (1-lane – west portal), (Figure 1). The section constituted two regions: straight and curved.
The mechanical ventilation system in the tunnel section is a semi-transverse system that consisted of a series of reversible fans, situated in two towers (Towers 9 & 10), as listed in Table 1. As shown in this table, some fans have only one vent (WF2, WF3, WF7, WF8, WF9). Some other fans have many vents distributed in the ceiling (CF1, CF2, CF3, CF4, CF5), north wall (WF5), south wall (WF1, WF6), and north and south walls (WF4). Figure 1 shows the location of fan vents along the tested section. These fans were installed in 1974. Fan capacities in both normal and reverse modes of operation were measured during the field tests in order to evaluate their current efficiencies. The measured flow rates were used in the numerical simulations as boundary conditions.
4 EXPERIMENTAL STUDY
Four full-scale fire tests were conducted, using a clean-burning propane system that produces minimal visible smoke, for a fire size of 1 MW. The fire size was selected so as to minimize the risk of damage to the tunnel and its associated systems while producing reliable data as initial and boundary conditions for the numerical model [3]. Artificial smoke was added for visualization purposes. The first two fire tests were conducted in the straight region of the tunnel at CH 28+50. The other two fires were conducted in the curved region at CH 36+00. The fire positions were selected to be
representative of the most critical locations of fire incidents in the section. At each fire location, two ventilation scenarios were activated (Table 2).
Figure 1 A schematic of the investigated section of the tunnel
Table 1 Mode of operation and location of tunnel section fans Mode of Operation
Fan
Normal Reverse
Number of
Vents Location CH
CF1 exhaust supply 18 ceiling 22+63
CF2 exhaust supply 18 ceiling 22+86
CF3 supply N/A 24* ceiling 17+17 – 17+85
CF4 supply N/A 24* ceiling 17+17 – 17+85
CF5 supply N/A 24* ceiling 17+17 – 17+85
WF1 exhaust N/A 52 south wall 24+16 – 29+34
WF2 exhaust N/A 1 south wall 30+06
WF3 exhaust N/A 1 south wall 30+36
WF4 supply exhaust 27/23 south/north wall 31+00 – 37+10
WF5 exhaust N/A 10 north wall 37+44 – 38+20
WF6 exhaust N/A 36 south wall 37+44 – 41+54
WF7 exhaust N/A 1 north wall 41+80
WF8 exhaust N/A 1 north wall 41+60
WF9 exhaust N/A 1 south wall 42+00
* saccardo nozzles
Temperature, airflow speed and smoke optical density (SOD) values were measured at four locations or drops. Each drop of measurement comprised thermocouple trees and smokemeters. The drops are distributed on either side of the fire. Drop 4 was located UOF while Drop 1 through Drop 3 were located downstream of the fire (DOF). At Drop 1, vertical and horizontal thermocouple trees were installed to measure fire plume
and ceiling temperatures. The vertical tree had five thermocouples. The horizontal tree had seven thermocouples located at tunnel ceiling above the fire (Figure 1).
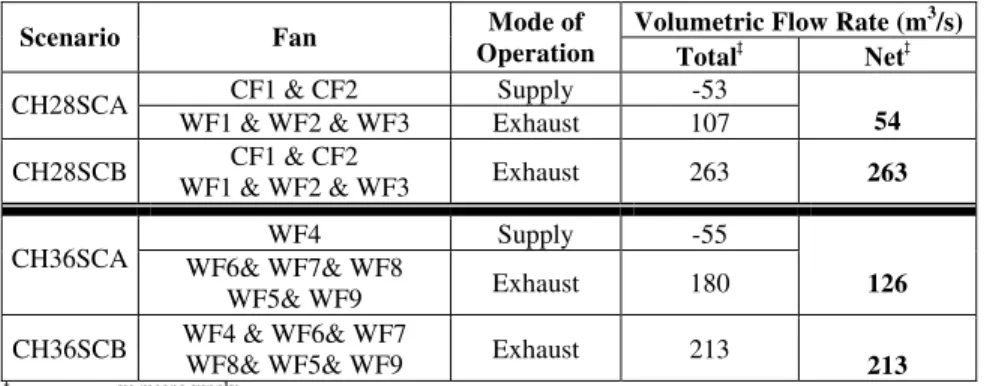
Table 2 Ventilation scenarios used in the field fire tests for 1 MW fire Volumetric Flow Rate (m3/s)
Scenario Fan Mode of
Operation Totalà Netà
CF1 & CF2 Supply -53
CH28SCA
WF1 & WF2 & WF3 Exhaust 107 54
CH28SCB CF1 & CF2
WF1 & WF2 & WF3 Exhaust 263 263
WF4 Supply -55
CH36SCA WF6& WF7& WF8
WF5& WF9 Exhaust 180 126
CH36SCB WF4 & WF6& WF7 WF8& WF5& WF9 Exhaust 213 213 à -ve means supply
Three vertical thermocouple trees with six thermocouples each were installed at each of Drops 2 through 4 to record measurements at the cross-section centreline and quarter points (Figure 1). Two smokemeters were installed on each tree at a distance of 1.4 and 3.6 m from the ceiling.
Airflow measurements were taken at all fans vents for both normal and reverse modes of operation using a handheld vane anemometer. Additionally, airflow velocities were measured at different locations along tunnel length for cases with and without fire and ventilation. These measurements provided the input data for the CFD simulations. The following observations were made from the data analysis of the field fire tests [3]: The prevailing wind speed was about zero at portals.
For fires at CH 28+50, the
maximum ceiling temperature was generally
measured at about 1.5–4.5 m DOF (fire plume was tilted toward DOF). For fires at CH 36+00, the fire plume was approximately vertical due to small longitudinal airflow velocity. The highest maximum ceiling temperature was measured at CH36SCA (181oC), while CH28SCA produced the lowest maximum ceiling temperature (127oC) (Figure 2).
Close to the fire (Drop 1), the highest maximum temperature occurred at an elevation of about 3.0 m from ceiling (~flame height) for fires at CH 36+00 and at the ceiling for fires at CH 28+50 (Figure 3). The highest maximum temperature at Drop 1 (385oC) was measured at CH36SCA, while the lowest maximum
temperature (82oC) was measured at CH28SCA. For a given test and at a certain location, the maximum temperature was the maximum value measured over a steady-state portion of data.
Figure 2 Measurements of maximum ceiling temperature at Drop 1 0 20 40 60 80 100 120 140 160 180 200 0 1 2 3 4 5 6 7 8 9 CH36SCB CH36SCA CH28SCB CH28SCA Traffic Fire
Distance from Fire (m)
T e m p ra tu re ( oC)
At about 50 m UOF and DOF (Drops 4 and 2, respectively), vertical temperature profiles showed stratification with a hot layer near the tunnel ceiling, and a cold lower layer with temperature close to ambient. Both CH28SCA and CH28SCB
resulted in a small negative airflow UOF (negative values indicate airflow in traffic direction). This flow could not prevent backlayering and as a result, a short distance of smoke backlayering close to
the ceiling was observed (Figure 4). However, most of the smoke travelled DOF. The maximum SOD values were mostly measured by the smokemeter near the
ceiling, indicating that most of the smoke was located close to the ceiling (Figure 4). In the curved region of the
tunnel, the airflow supplied by the distributed lower vents in the north and south walls resulted in a net longitudinal velocity component of about zero hindering movement of smoke in the longitudinal direction. Moreover, both the lateral vents and tunnel curvature induced turbulence that cooled the hot buoyant smoke and enhanced its dilution. As a result, the SOD values both UOF and DOF (Drops 4 and 3, respectively) were significantly higher than that for a fire at CH 28+50 (Figure 4). Maximum SOD values UOF and DOF were, in general, the highest for CH36SCA (Figure 4).
Based on the in-situ fire tests results and observations, the next step of the study was performed by conducting CFD numerical simulations using a large fire size of 30 MW. The experimental part provided the necessary initial and boundary conditions for the numerical simulations. As well, based on the field observations some ventilation scenarios were revised in order to improve its smoke control performance.
Figure 3 Measurements of the maximum vertical temperature profiles
Figure 4 Measurements of maximum SOD profiles 0 1 2 3 4 5 0 50 100 150 200 250 300 350 400 450 CH36SCB CH36SCA CH28SCB CH28SCA At Drop 1 Temperature (oC) D ist a n c e f rom Ce ili ng (m ) 0 1 2 3 4 5 0 0.03 0.06 0.09 0.12 0.15 CH36SCB CH36SCA CH28SCB CH28SCA
(a) Maximum SOD at Drop 2
Smoke Obscuration (O.D./m)
Eleva tio n from Ceili ng (m ) 0 1 2 3 4 5 0 0.03 0.06 0.09 0.12 0.15 CH36SCB CH36SCA CH28SCB CH28SCA
(c) Maximum SOD at Drop 4
Smoke Obscuration (O.D./m)
Elevation fro m C e iling (m) 0 1 2 3 4 5 0 0.03 0.06 0.09 0.12 0.15 CH28SCB CH28SCA CH36SCB CH36SCA
(b) Maximum SOD at Drop 3
Smoke Obscuration (O.D./m)
Elevation fr
om
Ceiling (
m
5 NUMERICAL STUDY
The current study employed the Fire Dynamic Simulator (FDS) version 4 CFD model [5] for the simulation of the behaviour of the smoke originating from a fire. FDS is based on the Large Eddy Simulation approach and solves a form of high-speed filtered Navier-Stokes equations valid for a low-speed buoyancy driven flow. These equations were discretized in space using a second order central difference method and in time using an explicit, second order, predictor-corrector scheme. In FDS, the fire was represented using the “mixture fraction-based” combustion model.
FDS has been the subject of numerous validations [6]. The validation efforts included: comparison with full-scale tests conducted specifically for code evaluation, comparison with engineering correlations, comparison with previously published full-scale test data, comparison with a standard test, and comparison with documented fire experience. Kashef and Bénichou [7] and Liu et al [8] have recently validated the use of FDS in assessing the performance of emergency ventilation and detection systems for tunnel applications by extensively comparing the predictions of FDS against field and laboratory experiments. The comparison studies showed that both numerical predictions of FDS and measurements were, in general, in good agreements. The comparisons were conducted, at both near and far field of fire location, for several parameters including volumetric airflows, temperatures, and for the smoke optical densities (SODs).
A 30 MW gasoline pool fire (equivalent to a bus or truck on fire) was used to conduct the numerical simulations. This fire represents a typical design fire size recommended for roadway tunnels that do not carry hazardous goods [2]. Fires were located at the tunnel centreline at CH 28+31 (straight region) and 36+53 (curved region), Table 3. In total, seven CFD simulations were conducted (Figure 5). Four simulations (fire scenarios CH28SCA, CH28SCB, CH28SCC, CH28SCD) were conducted in the straight region and three simulations (CH36SCA, CH36SCB and CH36SCC) were conducted in the curved region.
The results and observations of the field fire tests for a fire size of 1 MW indicated that both ventilation scenarios CH28SCA and CH28SCB resulted in a limited backlayering distance. Therefore, it was decided to investigate the effect of a larger fire size (30 MW) on the performance of these ventilation scenarios. In addition, two possible ventilation schemes (CH28SCC & CH28SCD) were explored to determine their performance for a 30 MW fire in the straight portion of the tunnel section. Both CH28SCC and CH28SCD utilized the ceiling fans CF3, CF4, and CF5, equipped with a number of Saccardo nozzles, in supply mode (Figure 5).
All CFD simulations were carried out in the absence of traffic. Normally, the traffic downstream of a fire would be cleared shortly after fire initiation. Thus, the postulation of no traffic in the tunnel may not affect the outcome of CFD simulations with regards to smoke movement and control DOF. However, the existence of traffic UOF would act as obstacles that can affect the movement of airflow.
Both the floor and ceiling of the modelled tunnel section have zero slopes. Since FDS code handles only physical domains as right parallelepipeds, the actual geometry of the curved portion of the tunnel section was slightly modified by using a process called “stair stepping” in which a series of rectangular obstructions were introduced to simulate the curved part of the domain. The stair stepping induces changes in the flow pattern near an idealized wall by generating vortices at the sharp corners. These effects were minimized by smoothing out the jagged steps that made up the rectangular obstructions.
Ventilation vents were introduced to mimic the actual wall and ceiling vents in the tested section of the tunnel. The number of activated fans, their volumetric flow rates and types of operations (exhaust or supply) are listed in Table 3. In this table, when the net flow is positive, fresh air is drawn into the modelled section at portals and from other tunnel parts to balance ventilation flow. Except for CH28SCC in which airflow exited from the tunnel section, all ventilation scenarios drew fresh air from outside the modelled section.
Table 3 Ventilation scenarios used in the numerical simulation for 30 MW fire Volumetric Flow Rate (m3/s)
Scenario Fan Mode of
Operation Totalà Netà
CF1 & CF2 Supply -53
CH28SCA
WF1 & WF2 & WF3 Exhaust 107 54 CH28SCB CF1 & CF2
WF1 & WF2 & WF3 Exhaust 263 263 CF1 & CF2 & CF3
CF4 & CF5 Supply -147
CH28SCC
WF1 & WF2 & WF3 Exhaust 107 -40 WF1 & WF2 & WF3 Exhaust 107
CH28SCD
CF3, CF4, CF5 Supply -94 13
WF4 Supply -55
CH36SCA
WF6& WF7& WF8& WF5 Exhaust 181 72 CH36SCB WF4 & WF6& WF7&
WF8& WF5& WF10 Exhaust 186 186 WF4& WF6& WF7& WF8
WF5& WF10& WF2& WF3 Exhaust 271 CH36SCC
CF3, CF4, CF5 Supply -94 178
à -ve means supply
The modelled section extended from CH 17+00 to CH 45+00. In the numerical simulations, CH 17+00 and CH 45+00 were taken at X = 640 m and X ~ 0 m, respectively. As shown in Figure 5, there are four portals, namely: west portal (X= 0 and Y= 129 – 141 m, Z = 0 – 5 m), south portal (X= 26 – 31 m, Y= 0 m and Z= 0 – 5 m), and east portal (X= 640 m, Y= 297 – 320 m, Z= 0 – 5 m). As indicated earlier, the field tests showed that the measured prevailing wind speed was about zero at all portals. Consequently, the boundary conditions at these portals were taken as open vents.
All seven numerical simulations listed in Table 3 were conducted for a duration of 900 s (15 min). Both fire and ventilation systems were simultaneously activated at time equal zero. In an actual fire incident, however, the ventilation system would be activated a period of time after fire initiation depending on how fast the tunnel operator activates the ventilation system.
5.1 Characteristics of the gasoline pool fire used in the CFD simulations
In all simulations, a 30 MW gasoline pool fire (C16H34) was considered [2] and was
represented by a 3.2 x 2.5 x 1.5 m parallelepiped made of steel and located at the centreline of the tunnel cross-section. It was assumed that the fuel is being burned with constant yields of CO and Soot according to:
Soot CO O H CO O H C O CO HO CO Soot 2 2 2 34 16 2 2 2 (1)
In FDS version 4, it was assumed that the CO and Soot are created at the flame and transported with combustion products with no growth or oxidation after burning. The yields of CO and Soot were taken as 0.131 and 0.360, respectively [4]. Based on these yield values, the actual stoichioimetric coefficients in Eq. (1) are: 17.191
2 O , 163 . 8 2 CO , 17.0 2O H , CO 1.057 and Soot6.780.
6 RESULTS AND DISCUSSIONS
In all CFD simulations, steady state conditions were achieved at all locations after approximately 200 s. The instantaneous mass flow rate oscillated erratically with time implying that the flow regime in the tunnel section was quite turbulent. In all CFD simulations, the magnitude of the turbulence intensity, ratio of time average of square values of mass flow rates to its time average, was less than 10%.
6.1 Airflow profiles
Figure 6 shows the volumetric flow rate at different cross-sections of the tunnel section at the end of the simulation for a fire at CH 28+31. For CH28SCC, ceiling Fans CF1, CF3, CF4 and CF5 were activated in supply mode, while wall Fans WF1, WF2, and WF3 were activated in exhaust mode. Scenario CH28SCD was similar to CH28SCC except that ceiling Fan CF1 was not activated in CH28SCD. The activation of CF1 in CH28SCC resulted in a higher negative airflow (airflow in the same direction as the traffic) UOF and in the vicinity of the fire than that in CH28SCD. Among the four ventilation scenarios, CH28SCC resulted in the highest negative airflow, which in turn resulted in the shortest backlayering length and the best visibility UOF.
Figure 6 Flow rates across tunnel – 30 MW fires at CH 28+31 -200 -180 -160 -140 -120 -100 -80 -60 -40 -20 0 20 40 60 80 17 19 21 23 25 27 29 31 33 35 37 39 41 43 45 CH28SCD CH28SCC CH28SCB CH28SCA Fire Tube C Tube A
+ve (Flow in the opposite direction of the traffic)
Traffic Chainage Vol u m e
tric Flow Rate
(
m
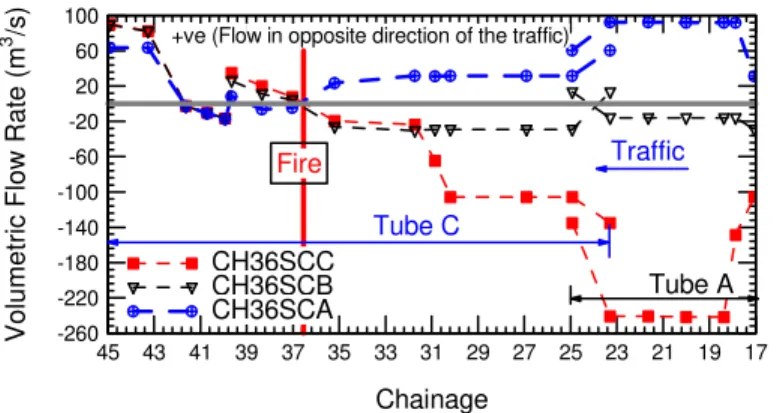
In CH36SCA, both the lateral vents and tunnel horizontal curvature induced turbulence that inhibited strong longitudinal airflow in the curved portion of the tunnel section (Figure 7). This was confirmed in the in-situ test observations where, the induced turbulence cooled down the hot buoyant smoke layer and enhanced its dilution. Scenario CH36SCC was similar to CH36SCB except that ceiling Fans CF3, CF4, CF5 and wall Fans WF2 and WF3 were activated for CH36SCC and not for CH36SCB. As shown in Figure 8 for CH36SCC, activating Fans WF2 and WF3, which had a considerable volumetric flow rate in the exhaust mode (85 m3/s), increased the negative airflow UOF. Also, activating Fans CF3, CF4 and CF5 in the supply mode induced a jet-like airflow, resulting an increase in the negative airflow UOF, causing a shorter backlayering length UOF.
6.2 Smoke Propagations
Figure 9 shows the smoke propagations for scenario CH28SCC. Both CH28SCC and CH28SCD resulted in fresh air being drawn from UOF causing a delay in backlayering. Activating Fans WF2 and WF3 in exhaust mode in the four scenarios for a fire at CH 28+31 resulted in not only creating a positive airflow DOF (Figure 6) but also extracting the smoke from DOF. The higher the positive airflow DOF the more confined was the smoke front. Moreover, the activation of Fan CF1 in supply mode resulted in a slightly lower positive airflow DOF in CH28SCC than that in CH28SCD. In 900 s, the smoke front travelled a distance of 395 m DOF for CH28SCC (Figure 9d) versus a distance of 364 m for CH28SCD. In both scenarios, the length of backlayering was 86 m.
Figure 7 Vector plot of airflow speeds at the fire location – CH36SCA
Figure 8 Flow rates across tunnel – 30 MW fires at CH 36+53
-260 -220 -180 -140 -100 -60 -20 20 60 100 17 19 21 23 25 27 29 31 33 35 37 39 41 43 45 CH36SCC CH36SCB CH36SCA Tube A Tube C Traffic
+ve (Flow in opposite direction of the traffic)
Fire Chainage Volumetr ic Flow Rat e (m 3 /s )
(a) Time = 0 s (a) Time = 0 s
(b) Time = 36 s (b) Time = 95 s
(c) Time = 567 s (c) Time = 113 s
(d) Time = 900 s (end of simulation) (d) Time = 900 s (end of simulation) Figure 9 Smoke propagation – CH28SCC Figure 10 Smoke propagation – CH36SCC
The CFD results showed that in 41 s and 684 s after ignition for scenario CH28SCA, the backlayering length increased from 51 m and 153 m, respectively. In the period from 684 s until the end of the simulation, the smoke front UOF did not move. In 50 s in CH28SCB, the backlayering length was 61 m. The smoke front in CH28SCB reached a distance of 153 m UOF in 347 s compared to 684 s in CH28SCA. In the period from 347 s to 900 s for CH28SCB, the backlayering extent did not change.
Both CH28SCC and CH28SCCD produced the shortest backlayering length UOF (86 m) among simulated scenarios for a fire at CH 28+31. However, CH28SCD was the most successful scenario in confining the smoke front DOF.
Figure 10 shows the smoke propagations in simulation CH36SCC for a fire at CH 36+53. As shown in this figure, the smoke front reached the west portal after 95 s from initiating the fire (Figure 10b). At 95 s, the backlayering reached a distance of 159 m UOF; and 18 s later (at 113 s), it moved 16 m further reaching the beginning of the curved region (at CH 30+80, 175 m UOF). At 900 s, the smoke front reached CH 42+25 (174 m DOF) in CH36SCB and CH36SCC. However, at this time (900 s), the backlayering in CH36SCC reached CH 29+93 (201 m UOF, Figure 10d) compared to 241 m in CH36SCB. Moreover, the CFD results for CH36SCA showed that activating the Fan WF4 in supply mode, diluted the smoke to a lower concentration, and caused the diluted smoke to fill the entire section of the tunnel UOF. This phenomenon was confirmed in the in-situ fire tests.
A close examination for the CFD results of CH36SCA showed that the backlayering reached the east portal after 522 s. For CH36SCB, the backlayering reached CH 32+81 (113 m UOF); and 95 s later it moved 62 m further arriving at the beginning of the curved region (at CH 30+80). In the period from 176 s to 900 s, the backlayering reached CH 28+63 (241 m UOF). In summary, in terms of smoke movement both UOF and DOF, CH36SCC was the best scenario among the simulated scenarios for a fire at CH 36+53.
6.3 Visibility Profiles
Figure 11 and Figure 12 compare the average visibilities at the centreline of the tunnel for the different ventilation scenarios for a fire at CH 28+31 and CH 36+53, respectively, at the end of the simulation. The average visibility shown in these figures is the mean value of the visibilities at elevations 0.1, 0.9, 1.9, 2.9, 3.9 and 4.9 m at the centreline of the tunnel. The visibility (VIS in m), was calculated in FDS as follows [5]:
K C
VIS , and KKm(Ys) (2)
Where:
K = light extinction coefficient (m-1)
Km = mass specific extinction coefficient (7,600 m2/kg [5])
s Y
= density of smoke particulate (kg/m3), andC = dimensionless proportionality constant, (2 for light-reflecting sign and building components in reflected light [5].
Figure 11 Average visibility along tunnel height – fire at CH 28+31
Figure 11 shows the average visibility for the four scenarios for a fire at CH 28+31. Activating Fans CF1 and CF2 in exhaust mode in CH28SCB drew smoke from the vicinity of the fire UOF, resulting in the best visibility conditions DOF and in the vicinity of the fire, and the worst visibility conditions UOF. Having a good visibility in the vicinity of the fire is desirable for fire fighters. On the other hand, a good visibility indicated high oxygen concentration in the vicinity of the fire that is available to sustain the combustion process, resulting in higher temperatures in the vicinity of fire.
Figure 12 Average visibility along tunnel height – fire at CH 36+53
When Fan CF1 was activated in supply mode in CH28SCA, the fresh air from this fan opposed the movement of the smoke UOF, resulting in higher visibility UOF and lower visibility DOF compared to that in CH28SCB (Figure 11). Activating Fans CF3, CF4 and CF5 in supply mode in CH28SCC and CH28SCD resulted in a much better visibility UOF and poor visibility DOF compared to that in CH28SCA and CH28SCB.
Unlike the fire located at CH 28+31, there was poor visibility at the fire location in the three ventilation scenarios for a fire located at CH 36+53 (in the curved region, Figure 12). The occurrence of a fire in the curved region caused better mixing between fresh air and combustion products (due to the turbulence enhancement caused by the curved wall) resulting in poor visibility and a low peak temperature in the vicinity of the fire. As shown in Figure 12, the visibilities DOF for the three ventilation scenarios were similar. However, CH36SCC produced the best visibility UOF. For example, at CH
0 5 10 15 20 25 30 35 17 21 25 29 33 37 41 45 CH28SCA CH28SCB CH28SCC CH28SCD Traffic Fire Chainage V is ibi lity (m) 0 5 10 15 20 25 30 35 17 21 25 29 33 37 41 45 CH36SCA CH36SCB CH36SCC Traffic Fire Chainage Vi sibi lity (m )
30+14 (195 m UOF), the average visibility in scenario CH36SCC was 12 m compared to about 0 m in CH36SCB and CH36SCA. Figure 12 showed that the shortest backlayering and the best visibility UOF were in scenario CH36SCC.
6.4 Temperature profiles
The average temperatures at the tunnel centreline for ventilation scenarios for fires at CH 28+31 and CH 36+53 are shown in Figure 13 and Figure 14, respectively. It should be noted that the average temperature at each location was the mean values of the temperatures at all elevations at the tunnel centreline. For a fire at CH 28+31, CH28SCB had the highest average temperature (469oC) at the fire location, while CH28SCD had the lowest average temperature (251oC). As a result of activating Fans CF3, CF4 and CF5 in
supply mode in CH28SCC and CH28SCD, the average temperatures DOF in these simulations were higher than that in CH28SCA and CH28SCB (Figure 13). The average temperatures UOF in CH28SCA and CH28SCB were higher than that in CH28SCC and CH28SCD.
For a fire at CH 36+53, Figure 14 shows that CH36SCC resulted in the highest average temperature (323oC), while the other two simulations CH36SCA and CH36SCB produced a lower average temperature (~277oC). The average temperature DOF in
CH36SCA was slightly higher than that in CH36SCB and CH36SCC. Additionally, the average temperatures UOF in CH28SCB and CH28SCC were approximately the same, and higher than that in CH36SCCA for a distance from the fire < ~160 m. For a distance from the fire > ~160 m, the average temperatures in CH28SCB and CH28SCC were lower than that in CH36SCA.
Figure 13 Average temperature along tunnel height – fire at CH 28+31
Figure 14 Average temperature along tunnel height – fire at CH 36+53
0 50 100 150 200 250 300 350 400 450 500 17 21 25 29 33 37 41 45 CH28SCD CH28SCC CH28SCB CH28SCA Fire Traffic Chainage Tem perature ( o C) 0 50 100 150 200 250 300 350 17 21 25 29 33 37 41 45 CH36SCC CH36SCB CH36SCA Traffic Fire Chainage T e mp er atu re ( o C)
Table 4 summarizes the CFD results for the seven ventilation scenarios. The CFD results showed that when the fire was located in the curved region, it was observed that a good mixing between the fresh air and the combustion products took place due to the effect of wall curvature. This mixing process resulted in reducing temperatures and increasing the extent of backlayering. Consequently, having a fire accident in the curved region, the trapped vehicles UOF would receive a lower amount of heat by radiation than if the accident occurred in the straight region. On the other hand, a fire accident in the curved region is more serious than that in the straight region in terms of smoke inhalation and visibility.
7 SUMMARY AND CONCLUSIONS
Seven numerical transient CFD simulations were carried out to investigate the effectiveness of the in-place ventilation strategies for removing smoke and hot gases produced by fires in the tested section of the tunnel. For these applications, it has been shown that FDS is a good tool to be used for predicting volumetric airflows, temperatures, and smoke optical densities. This tool was used in this study to conduct numerical simulations for a fire size of 30 MW under different ventilation scenarios for two fire locations in the tested section. The experimental part of this study provided the necessary initial and boundary conditions for the numerical simulations. The first four fire scenarios were simulated for a fire in the straight region of the tunnel section. To investigate the effect of wall curvature on ventilation performance, another three fire scenarios were simulated for the same fire size of 30 MW. The results of these scenarios are summarized in Table 4.
Table 4 Summary of the simulation results for all ventilation scenario studied Maximum Temperature (oC) Fire Scenario Backlayering Length (m) Time (s) * Visibility (m)** Average Peakà For fire in the straight region of a size of 30 MW or less
CH28SCA 153 684 5 486 1110
CH28SCB 153 347 2-3 534 1160
CH28SCC$ 86 567 < 2 286 667
CH28SCD$ 86 734 < 1 303 662
For fire in the curved region of a size of 30 MW or less
CH36SCA 595 900 < 1 276 831
CH36SCB 241 900 0 – 7 277 773
CH36SCC$ 175 113 2.5 323 843
* Time from ignition until maximum backlayering distance ** Average visibility within the backlayering region $ Favourable ventilation scenario
à The maximum temperature at all elevations at tunnel centreline at a location
Based on the field fire tests and the CFD simulations, it was observed that:
For a fire located in the straight part of the tunnel, scenario CH28SCD limited the extent and delayed the occurrence of backlayering. Moreover, this scenario produced the lowest peak temperature. The activation of ceiling Fans CF3, CF4, and CF5 induced a jet-like airflow condition UOF limiting and controlling backlayering and reducing temperatures at the fire location.
For a fire located in the curved section of the tunnel, the ventilation scenario CH36SCC produced the shortest backlayering distance.
Large size exhaust wall vents are more effective in removing smoke and fire products.
In the curved region of the tunnel, exhaust vents were distributed in both the north and south walls. This induced localized effect around these vents on both sides. The local effect not only reduced the efficiencies of the wall fans, but also formed a dead zone around the centreline with small longitudinal airflow. This also had been confirmed from fire tests.
To minimize smoke backlayering in the curved region, it is necessary to install ceiling jet fan(s) along the curved region to eliminate the dead zone and produce a proper longitudinal flow in the direction of traffic flow.
8 REFERENCES
1. Heselden, A J M., “Studies of Fire and Smoke Behaviour Relevant to Tunnels”, Proc. Second International Symposium on the Aerodynamics and Ventilation of Vehicle Tunnels, Cambridge, BHRA, paper J1, 1976.
2. National Fire Protection Association, "NFPA 502 Standard for Road Tunnels, Bridges, and Other Limited Access Highways", 2004 Edition, NFPA, Quincy, MA.
3. Kashef, A., and Saber, H. H. “CFD Simulations for Verification of Ventilation Strategies in Tube C of the Ville-Marie Tunnel in Montréal City”, 5th NRC Symposium on Computational Fluid Dynamics and Multi-scale Modelling, Ottawa, Canada, January 21, 2008.
4. PIARC Committee on Road Tunnels, “Fire and Smoke Control in Road Tunnels” PIARC – World Road Association, 1999.
5. McGrattan, K. B., Baum, H. R., Rehm, R. G., Forney, G. P., Floyd, J. E., Hostikka, S., Fire Dynamics Simulator (Version 4), Technical Reference Guide (Technical Report NISTIR 6783), National Institute of Standards and Technology, Gaithersburg, Maryland, Sep. 2003.
6. K.B. McGrattan, S. Hostikka, J.E. Floyd, H.R. Baum, and R.G. Rehm. Fire Dynamics Simulator (Version 5), Technical Reference Guide. NIST Special Publication 1018-5, National Institute of Standards and Technology, Gaithersburg, Maryland, October 2007.
7. Kashef, A., and Bénichou, N., “Investigation of the Performance of Emergency Ventilation Strategies in the Event of Fires in a Road Tunnel – A Case Study”, Journal of Fire Protection Engineering, vol. 18; pp. 165-198, 2008.
8. Z. G. Liu, A. Kashef, G. Crampton, G. Lougheed, Y. Ko, G. Hadjisophocleous, and Kathleen H. Almand, “Findings of the International Road Tunnel Fire Detection Research Project,” Fire Technology, accepted for publication, 5 September 2008.