Publisher’s version / Version de l'éditeur:
BMC Plant Biology, 13, pp. e192-1-e192-19, 2013-11-28
READ THESE TERMS AND CONDITIONS CAREFULLY BEFORE USING THIS WEBSITE.
https://nrc-publications.canada.ca/eng/copyright
Vous avez des questions? Nous pouvons vous aider. Pour communiquer directement avec un auteur, consultez la première page de la revue dans laquelle son article a été publié afin de trouver ses coordonnées. Si vous n’arrivez pas à les repérer, communiquez avec nous à PublicationsArchive-ArchivesPublications@nrc-cnrc.gc.ca.
Questions? Contact the NRC Publications Archive team at
PublicationsArchive-ArchivesPublications@nrc-cnrc.gc.ca. If you wish to email the authors directly, please see the first page of the publication for their contact information.
This publication could be one of several versions: author’s original, accepted manuscript or the publisher’s version. / La version de cette publication peut être l’une des suivantes : la version prépublication de l’auteur, la version acceptée du manuscrit ou la version de l’éditeur.
For the publisher’s version, please access the DOI link below./ Pour consulter la version de l’éditeur, utilisez le lien DOI ci-dessous.
https://doi.org/10.1186/1471-2229-13-192
Access and use of this website and the material on it are subject to the Terms and Conditions set forth at
Multiple roles of the transcription factor AtMYBR1/AtMYB44 in ABA
signaling, stress responses, and leaf senescence
Jaradat, Masrur R.; Feurtado, J. Allan; Huang, Daiquing; Lu, Yongquan;
Cutler, Adrian J.
https://publications-cnrc.canada.ca/fra/droits
L’accès à ce site Web et l’utilisation de son contenu sont assujettis aux conditions présentées dans le site LISEZ CES CONDITIONS ATTENTIVEMENT AVANT D’UTILISER CE SITE WEB.
NRC Publications Record / Notice d'Archives des publications de CNRC:
https://nrc-publications.canada.ca/eng/view/object/?id=259ff518-4322-466e-9584-f86ae16e0ff7 https://publications-cnrc.canada.ca/fra/voir/objet/?id=259ff518-4322-466e-9584-f86ae16e0ff7
R E S E A R C H A R T I C L E
Open Access
Multiple roles of the transcription factor
AtMYBR1/AtMYB44 in ABA signaling, stress
responses, and leaf senescence
Masrur R Jaradat
1, J Allan Feurtado
1, Daiqing Huang
1, Yongquan Lu
2and Adrian J Cutler
1*Abstract
Background: The transcription factor AtMYBR1 (MYB44) is a member of the MYB family of transcription factors and is expressed throughout the plant life cycle and especially in senescing and wounded leaves. It has previously been shown to be involved in responses to abiotic stress and is regulated by phosphorylation.
Results: When MYBR1 was over-expressed under the control of the constitutive 35S promoter in Arabidopsis thaliana (OxMYBR1), leaf senescence was delayed. In contrast loss-of-function mybr1 plants showed more rapid chlorophyll loss and senescence. The MYBR1 promoter strongly drove β-GLUCURONIDASE reporter gene expression in tissues immediately after wounding and many wounding/pathogenesis genes were downregulated in OxMYBR1. OxMYBR1 plants were more susceptible to injury under water stress than wildtype, which was correlated with suppression of many ABA inducible stress genes in OxMYBR1. Conversely, mybr1 plants were more tolerant of water stress and exhibited reduced rates of water loss from leaves. MYBR1 physically interacted with ABA receptor PYR1-LIKE8 (PYL8) suggesting a direct involvement of MYBR1 in early ABA signaling. MYBR1 appears to exhibit partially redundant functions with AtMYBR2 (MYB77) and double mybr1 X mybr2 mutants exhibited stronger senescence and stress related phenotypes than single mybr1 and mybr2 mutants.
Conclusions: MYBR1 is a negative regulator of ABA, stress, wounding responses and blocks senescence. It appears to have a homeostatic function to maintain growth processes in the event of physical damage or stress.
Keywords: ABA, Drought stress, Transcription factor, PYL8, Senescence Background
In order to acclimate and protect themselves, plants translate environmental challenges such as drought, waterlogging, extreme temperatures, soil salinity, wound-ing, and pathogen attack into internal signals through hormones, second messengers, and transcription factors (TFs). The phytohormone abscisic acid (ABA) regulates abiotic stress responses and other vital processes in plant growth and development, especially during seed matur-ation reviewed in [1]. Mutant plants with altered ABA biosynthesis, perception or response have been cru-cial in deciphering the various components involved in ABA responses.
Recently, a family of 14 novel START domain proteins, named as PYR/PYL/RCARs (PYRABACTIN RESIST-ANCE/PYR1 LIKE/REGULATORY COMPONENT OF ABA RECEPTOR) has been identified as intracellular ABA receptors that interact with and inhibit several pro-tein phosphatase 2Cs (PP2Cs) including ABA INSEN-SITIVE1 and 2 (ABI1, ABI2), HOMOLOGY TO ABI1 (HAB1), and PP2CA [2-4]. Such phosphatases are nega-tive regulators of ABA signaling. A recent model for ABA signaling, based on several independent crystallo-graphic studies for example [5], proposes that in the presence of ABA, receptors of the PYR/PYL/RCAR family bind to PP2Cs which in turn release inhibition on a subfamily of SNF1-RELATED PROTEIN KINASE2 (SnRK2) kinases. These kinases then phosphorylate and subsequently activate transcription factors including ABA RESPONSIVE ELEMENTS-BINDING FACTOR (ABF)/ ABA RESPONSIVE ELEMENTS-BINDING PROTEIN
* Correspondence:adrian.cutler@nrc-cnrc.gc.ca
1Plant Biotechnology Institute, National Research Council of Canada, 110
Gymnasium Place, Saskatoon S7N 0W9, Canada
Full list of author information is available at the end of the article
© 2013 Jaradat et al.; licensee BioMed Central Ltd. This is an Open Access article distributed under the terms of the Creative Commons Attribution License (http://creativecommons.org/licenses/by/2.0), which permits unrestricted use, distribution, and reproduction in any medium, provided the original work is properly cited. The Creative Commons Public Domain Dedication waiver (http://creativecommons.org/publicdomain/zero/1.0/) applies to the data made available in this article, unless otherwise stated.
Jaradat et al. BMC Plant Biology 2013, 13:192 http://www.biomedcentral.com/1471-2229/13/192
(AREB)-type bZIP TFs. ABFs in turn bind to responsive promoter elements (ABRE) to activate ABA-responsive gene expression.
The molecular basis of adaptive responses to abi-otic stresses such as low temperature, desiccation and salinity, has been elucidated by identifying genes such as RESPONSIVE TO DEHYDRATION (RD), KYKNA-INDUSOITU (KIN; Finnish for cold-induced), RESPON-SIVE TO ABA (RAB), COLD-REGULATED (COR), LOW-TEMPERATURE-INDUCED (LTI), and DROUGHT-INDUCED (DI). Manipulation of many of these genes resulted in plants with improved tolerance to drought, salt, cold and freezing reviewed in [6]. Molecular and genetic studies suggest that ABA-dependent and –inde-pendent pathways operate in abiotic stresses and ABA-dependent pathways are predominant in drought stress responses [7,8].
Environmental factors such as drought, extreme temp-erature and pathogen infection as well as endogenous factors including age affect the onset and progression of leaf senescence reviewed in [9]. Unlike abscission and dehiscence, leaf senescence is a specialized form of pro-grammed cell death, which is a genetically regulated process of slow cell death of the entire leaf and is pre-ceded by the reallocation of nitrogen, phosphorus, and metals to other parts of the plant. An early manifestation of senescence in leaves is loss of chlorophyll. Leaf meso-phyll cells start to senesce first, followed by other cell types, and exhibit an incoherent pattern of localized cell death, which eventually spreads to the whole leaf. Senes-cence is accelerated by ABA, ethylene, jasmonates (JAs), and salicylic acid (SA), and is delayed by cytokinins (CKs) and auxin reviewed in [9]. However, extensive cross talk among these signaling pathways during senescence com-plicates understanding of the initiation and progression of senescence. Therefore, key components in senescence sig-naling remain largely unknown.
Senescence is an important aspect of drought re-sponses. Accelerated leaf senescence followed by leaf ab-scission is triggered by prolonged stress to reduce water loss, remobilize nutrients to young leaves and to enable survival of the plant [10,11].
The MYB family TFs comprises around 180 genes in Arabidopsis and is the largest TF gene family reviewed in [12]. MYB proteins contain a conserved DNA-binding MYB domain of about 52 amino acids, and are classified into three subfamilies based on the presence of one, two or three MYB domains reviewed in [13]. The plant spe-cific and largest MYB family consists of R2R3-type fac-tors which contain two repeats and comprise 125 genes in Arabidopsis. R2R3-MYB genes are involved in various plant-specific processes such as regulation of secondary metabolism, modulation of development, determination of cell fate and identity and responses to environmental
factors and hormone. The gene further characterized in this paper, AtMYBR1/MYB44 (R2R3 MYB) was weakly induced by 24 h treatment with ABA but strongly in-duced by the hyperactive ABA analog (+)-8′ acetylene ABA (PBI425) [14]. Most ABA-regulated genes are simi-larly regulated by water stress, however MYBR1 was se-lected for further functional characterization because its expression was paradoxically repressed by drought and elevated by re-watering [8] suggesting a novel role in ABA signaling. Jung et al. [15] reported that over-expression of MYBR1 increased stress tolerance but unexpectedly re-pressed many known stress-related genes. Subsequent studies have revealed that this gene is regulated by a Mitogen-Activated Protein Kinase (MAPK) cascade. Fol-lowing stress treatment, MITOGEN-ACTIVATED PRO-TEIN KINASE (MPK3) is activated and phosphorylates the bZIP TF VirE2-INTERACTING PROTEIN 1 (VIP1), which then rapidly activates the expression of MYBR1 and other stress genes through promoter binding [16]. Further studies have shown that MYBR1 interacts directly with, and is phosphorylated by, MPK3 at ser145 [17] and pos-sibly ser53 [18] and that the ser145 phosphorylation is required for MYBR1 function [17]. In this study, we func-tionally characterized the AtMYBR1 TF by studying an Arabidopsis T-DNA insertion mutant mybr1 and overex-pression lines of AtMYBR1 (OxMYBR1). We show that MYBR1 down regulates many ABA responsive genes in-cluding those involved in abiotic stresses and negatively regulates drought responses and senescence. Moreover, direct involvement of MYBR1 in early ABA signaling is suggested by our observation that MYBR1 protein interacts with PYL8, an ABA receptor.
Results
AtMYBR1 represses genes induced by a hyperactive ABA analog
We showed in a previous study that AtMYBR1 was induced weakly by (+)-ABA and more strongly by 24 h treatment with a hyperactive ABA analog PBI425 ((+)-8′ acetylene ABA) indicating MYBR1 is likely a component of the ABA signaling pathway [14]. It has been shown previously that PBI425 induces ABA responsive genes al-most identically to the natural enantiomer S-(+)-ABA. However, because PBI425 is catabolized much less rap-idly than (+)-ABA and accumulates to higher levels in plant tissue [14] it is an effective tool to study weak and transiently expressed ABA-responsive genes such as ABI1, ABI2, LTI30, KNAT4 and MYBR1 itself [8,14,19]. There-fore we used PBI425 to define the role of MYBR1 in ABA signaling.
In addition to using PBI425 to study the function of AtMYBR1, we generated transgenic Arabidopsis 35Spro:
MYBR1 plants (OxMYBR1). After kanamycin selection, three lines with single inserts were selected and their
homozygous progeny plants were grown as experimental materials. The level of overexpression of MYBR1 was 23-fold in gain-of-function OxMYBR1 line 42–6, 12-fold in line 31–3 and 11-fold in line 1–7 and was undetect-able by qPCR in loss-of-function mybr1 [14]. To reduce the likelihood of identifying phenotypic artifacts due to mis-expression, the phenotypes of all the overexpression lines were compared for qualitative consistency through-out the experiments.
We compared gene expression in different genotypes using Arabidopsis oligoarrays representing a comprehen-sive set of approximately 26,000 expressed genes. The comparisons were: (i) genotype comparisons of un-treated plants: OxMYBR1 (42–6) or mybr1 versus WT, (ii) genotype comparisons after PBI425 treatment: OxMYBR1 (42–6) or mybr1 versus WT, and (iii) effect of PBI425 treatments on each genotype: OxMYBR1, mybr1 and WT treated with PBI425 versus the same genotype without the treatment. The experimental de-sign is illustrated in Additional file 1: Figure S1 online. Samples were treated with PBI425 for 24 h on the basis that the accumulation and effects of PBI425 on gene ex-pression was maximum at 24 h [8]. The total numbers of differentially expressed genes are listed in Table 1 and the gene lists and data may be found in Additional file 2: Table S1. There were a total of 1507 differentially regu-lated genes from all comparisons. In the absence of PBI425 treatment, comparisons of OxMYBR1 or mybr1 vs. WT yielded a very small number of differentially regu-lated genes (Table 1). Treatment with PBI425 greatly in-creased numbers of differentially expressed genes and revealed differences between genotypes. Analysis of the direct effect of PBI425 on gene expression showed that MYBR1 represses expression of many genes induced by PBI425 in WT (and mybr1) in terms of both total num-bers (Table 1) and expression ratios (Figure 1, Additional file 2: Table S1).
It is noteworthy that there were very few differentially regulated genes from comparisons of mybr1 versus WT both with (12 genes) and without (2 genes) PBI425
treatment. This suggests the likelihood that MYBR1 is functionally redundant with at least one other closely re-lated gene. MYBR2 (MYB77) is reported as the closest homolog of MYBR1 based on sequence similarities in the C-terminal regions of the respective proteins and lack of homology with other MYB-type proteins [20]. MYBR2 has been reported to be involved in auxin signal transduction. MYBR2 over-expression results in reduced root and shoot growth, and root phenotypes in loss-function mybr2 lines varied with application of auxin [21]. However, its role in ABA responses and stress signaling or whether it acts co-operatively with MYBR1 remains unclear.
To investigate possible redundant functions of MYBR1 (MYB44) and MYBR2 (MYB77), gene expression analysis was performed using Agilent microarrays containing 44,000 Arabidopsis thaliana reporter sequences. Gene expression was compared between pairs of genotypes treated with PBI425 i) mybr1 versus mybr2 and ii) mybr1 versus mybr1xmybr2. The number of differentially ex-pressed genes was 56 for mybr1 vs mybr2 and 411 for mybr1 vs mybr1 x mybr2 (Additional file 2: Table S1). The increase in differentially expressed genes in the double mutant comparison suggests that MYBR1 and MYBR2 act in a synergistic manner However, only six out of 56 genes in the first comparison and 45 out of 411 genes in the second comparison were present in the above
Table 1 Number of significantly up- and down regulated genes using a threshold change in expression of 1.5 Fold and a P-value cut-off: ≤ 0.05
Hybridization Up Down Unchanged
mybr1(PBI425) vs. mybr1 448 452 607 WT(PBI425) vs. WT 417 438 652 OxMYBR1(PBI425) vs. OxMYBR1 180 246 1081 OxMYBR1(PBI425) vs. WT(PBI425) 88 420 999 OxMYBR1 vs. WT 35 86 1386 mybr1(PBI425) vs. WT(PBI425) 11 1 1495 mybr1 vs. WT 0 2 1505
Figure 1 Gain of AtMYBR1 function results in suppression of ABA induced changes in gene expression. The effects of PBI425 on gene expression (obtained from microarray comparisons) are compared in the three genetic backgrounds. Changes induced by PBI425 (both induction and repression) in WT and mybr1 backgrounds are reduced in the OxMYBR1 background.
Jaradat et al. BMC Plant Biology 2013, 13:192 Page 3 of 19
mentioned list of 1507 genes differentially expressed in all comparisons.
AtMYBR1 represses many ABA inducible stress genes
Many stress genes that are highly induced by ABA, are repressed by MYBR1 (Figure 2). However, since MYBR1 did not appear to repress all PBI425 induced genes, we examined more closely the gene expression patterns af-fected by MYBR1 and PBI425. In this analysis, we added 32 statistically significant genes to the total gene list of Table 1 for detailed analysis and interpretation. These 32 genes were not listed in Table 1 since their fold change was below the 1.5 ratio threshold. However, changes in expression of these genes were either verified by qPCR and direct spot visualization in BASE or were present in
our comparative analysis of our microarray data with data published by van der Graaff et al. [22].
Several distinct gene regulation patterns (classes A - H) were identified by comparing PBI425 treatment and MYBR1 overexpression (Table 2) and the gene lists and ex-pression data may be found in Additional file 3: Table S4. We excluded the comparison of mybr1 vs. WT from Table 2 because of the small number of differentially expressed genes. Similarly, we also excluded microarray data of mybr2 from comparisons mybr1(PBI425) versus mybr2(PBI425) and mybr1(PBI425) versus mybr1xmybr2 (PBI425). Many well-characterized abiotic stress responsive genes were grouped in classes A, F and G, of which 278 genes (class A, representing repression of ABA responses by MYBR1) were repressed by MYBR1, 112 genes (class F, ABA-like activation) were activated by MYBR1 and 254 genes (class G, representing ABA-specific activation) were unaffected by MYBR1. Therefore, MYBR1 represses a sub-set of about 43% of ABA-responsive genes. It has been sug-gested that stress responsive genes are under regulation by both ABA-dependent and ABA-independent pathways For a review see [7]. There are four DEHYDRATION RE-SPONSIVE ELEMENT BINDING PROTEIN1 (DREB1)/ C-REPEAT BINDING FACTOR (CBF) transcription factor genes that have been suggested to mediate ABA independ-ent cold stress responses. Here, DREB1A/CBF3 was in-duced by PBI425 and repressed by MYBR1 suggesting that DREB1A/CBF3 is ABA-dependent.
Many senescence associated genes including SAG12/ 13/21/29/102, EARLY RESPONSIVE TO DEHYDRA-TION1 (ERD1) and APG8a are also grouped in class A (downregulated by MYBR1 but upregulated by PBI425). There were a total of 498 genes that were either upregu-lated (class F) or down reguupregu-lated (class B) by MYBR1 in the same direction as ABA (PBI425). Among the downreg-ulated genes were many associated with photosynthesis and biotic stresses. A total of 198 genes (classes D and H) were regulated by MYBR1, but unaffected by PBI425. Among these, several genes involved in jasmonate and auxin action were repressed.
Promoters of many genes associated with drought, cold stress and salinity contain ABA-responsive element (ABRE), ABRE binding factor (ABF) and dehydration re-sponsive element (DRE) [23]. A search for statistically over-represented cis-acting motifs present in the pro-moters of classified genes sets in Table 2 was carried out against AGRIS and PLACE databases using the analysis tools in Athena [24] and the results are summarized in Additional file 1: Table S2. These promoter motifs mainly consisted of four groups. The majority of motifs are asso-ciated with ABA. Other motifs are related to stress, light regulation, gibberellins (GA) and circadian clock, suggest-ing cross talk between these pathways as was also ob-served previously [14]. There was a general similarity in Figure 2 Expression pattern of 24 stress responsive genes in
WT and gain- and loss of AtMYBR1 function mutant genotypes with and without PBI425. Comparisons are relative to (i) WT without PBI425 treatment for columns 1, 2 and 4 and (ii) WT with PBI425 treatment for columns 3 and 5 from left to right.
Table 2 Combined effects of ABA (PBI425) treatment and MYBR1 overexpression on ABA-related gene expression
Class Classification of gene regulation type
Net effect measured Differentially
expressed genes No
Examples of pathways (bold) / genes (italic) ABA in WT bk ABA in mybr1 bk ABA in Ox bk MYBR1 Ox in ABA/WT bk MYBR1 Ox in WT bk A Repression of ABA response
↑ ↓ ↑but lowered ↓ ↓ 278 1ometabolism (SUS3; BMY7; GOLS2; SIP2; ALDH7B4; AOX1A; LP1; LTP3/4; PLDδ;
POP2; LKR; CORI3) 2ometabolism (4CL1; CCoAOMT1; OMT1; ELI3-1(CAD); CPISCA; CUT1; PAP1); ABA (NCED4; ABF3; ABI1; HVA22D; PP2C); ethylene (ACO putative; MBF1C; EBF1); jasmonates (VSP1; VSP2); redox (CAT2; FSD1); abiotic stress (P5CS1; COR15a/15b; FL3-5A3; COR413-PM1; USPs; RCI2B; ERD4/10; COR47; XERO2; KIN2(COR6.6); DREB1A(CBF3); RD29B; RD29A(COR78/LTI78); RCI2A/2B; DI21; RD2/22; RAB18); GPX6; BGAL6; senescence (SAG12/13/21/29/102; ERD1; APG8a/8e); cell wall (XTH7; AGP12; EXLA1); GSTZ1; GSTU7/16; CYP89A5/A6; ACP5; VIF1; TFs (DREB1A; STO; STH3/LZF1; HAP5C; HB1/7/12; AGL20(SOC1); MYB73; GT2; NFYC3); HAB1/2; LEA14; ACD1; RD26; COR413-PM2; COR414-TM1; COR314-TM2; signaling (ROP2; GDI1);
B ABA-like repression ↓ ↓ ↓ ↓ ↓ 386 Photosynthesis (PSI; PSII; RBCS-1A/1B); GAPA-2; cell wall (CSLD5; FLA8; AGP11/ 13/16/20/21; EXPA1/8/10/15; XTH6); lipid (ACP1/3/4; NMT3; CLS; SLD1); NIA2; auxin (ILL2; responsive genes); DWF1; 40S and 60S ribosomal protein genes; biotic stress (DAD1/2; PDF1.1/1.2/1.2b/1.2c/1.3/2.2/2.3; TIR); senescence (SEN1); TFs (RAP2.4; COL5/15; GATA5; KNAT6; WUS; BET9); SNG1; cytokinin (ARR4); signaling (CAM3; CDPK6; CPK7; MKK5; GRF6);
C MYBR1 independent ABA repression
↓ ↓ ↓ — — 399 Photosynthesis (PSII; RBCS-3B); cell wall (CSLC4; FLA9; EXPA3/5/6/11; PME1/3); lipid (FAD3/5/7; NMT2; ATS1); auxin (PIN4; IAA4; responsive genes); cytokinin (ARR5/7; IPT2); GA (GASA4); 30S, 40S, 50S and 60S ribosomal protein genes; abiotic/biotic stress (ERD3; PR5); tetrapyrrole biosynthesis; TFs (BEE2; PRE1; HB5); TCH3; ERD6; TIP2
D ABA independent
repression — — —
↓ ↓ 171 myo-Inositol (MIPS1); cell wall (CESA1; AGP1/4/7/15/17; FLA1/2; PRP1; EXPA7; EXPB3; XTH9); lipid (FAD6; CER10); auxin (NIT1; ILL1; SHY2 (IAA3); ARF8); jasmonates (LOX2); abiotic stress (ERD4); TFs (NGA1; TRY; MYBL2); protein degradation (SCPL2; PREP1; MMZ1(UEV1A); UBC1; RHA2B; PAB2; PAC1; PAA1); signaling (GLR3.3; RAN3; ROP4; GRF12); transport (PIP3B; PIP2A; AAP2; CAX1; TGD1; PATL1); PSII (PSBO-2; LHCB2.2/4.2);
E Constitutive activation of ABA-repressed responses
↓ ↓ ↓ ↑ ↑ 20 30S and 50S ribosomal protein genes; ethylene (EIL1; EFE/ACO); UBQ1; CAM7;
F ABA-like activation ↑ ↑ ↑ ↑ ↑ 112 FAD2; SEX1; HMG1; NIT2; γ-VPE; senescence (SEN2 (CAT3)); abiotic/biotic stress (ERD14/15; HSP15.7-CI; ERDJ2A; wound-responsive gene; PCC1); signaling (RD20; TCH2; CAM1; RAB2; ELF4); PP2A-4;
G MYBR1 independent ABA activation
↑ ↑ ↑ — — 254 myo-Inositol (MIOX1); major carbohydrate metabolism (APL3; SUS1; RCP1);
fermentation (ADH; ALDH2B4); cell wall (FLA11; MERI5B; XTR3; EXT3); lipid (DGK1; LTP2; ACX1; MFP2; CUT1; CER1); abiotic stress (SEP2; KIN1; J8/20; ACD32.1; DI19; AOC1; RD22/26; ERD7); ABA (ABA1; CYP707A2); ethylene (ERF4); TFs (HAT2; HAP3; GBF3; KNAT4); protein degradation (RD21A; SCPL11; CLPX/C; L1D; UBQ10; UBC28/30/32); signaling (RAB7B; RAN-1; MKK9; RAFL32; PAT1); DRM1; β-VPE; transport (AHA3; TMT2; SUC2; AAP1; NTP3; KUP11; GCN5; AATP1); H ABA independent
activation — — —
↑ ↑ 27 SON1; SFP1; TGG1; TGG2; WAK2; β-amylase; CSLG3; ACD6; CAM6;
Bk: background; mybr1: loss-of-function of MYBR1; Ox: overexpressed; Gene regulation symbols– ↑: upregulation; ↓: downregulation; —: either ‘not differentially expressed’ or ‘undetectable’.
Jaradat et al. BMC Plant Biology 2013, 13 :192 Page 5 of 19 http://ww w.biomedce ntral.com/1 471-2229/13/192
the presence of ABA and stress motifs in genes that were regulated specifically by ABA and those that were regu-lated in the opposite direction by MYBR1. No significant enrichment was detected in genes that were regulated spe-cifically by MYBR1.
AtMYBR1 reduces drought tolerance
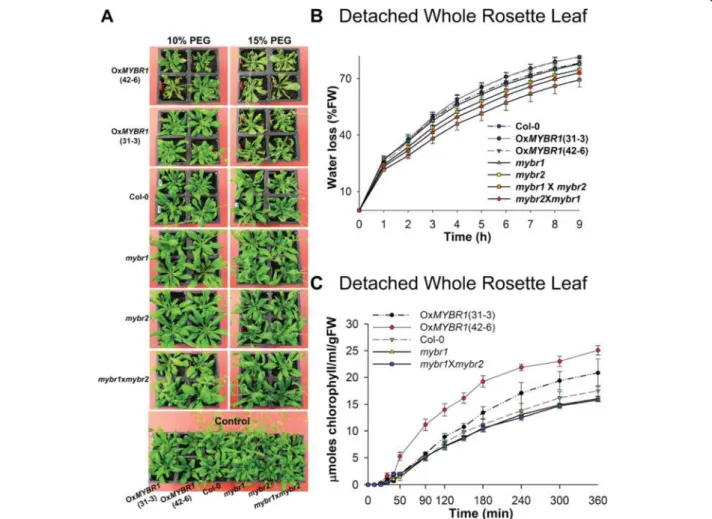
To define the function of MYBR1 during drought stress, plants were treated with 10% and 15% polyethylene gly-col (PEG) for 5 d. Consistent with the down regulation of the stress responsive genes (Figure 2), OxMYBR1 plants showed the highest degree of stress (leaf curling, bleaching) following PEG treatment and homozygous mybr1xmybr2 plants showed the least damage (Figure 3A). Subsequently, we found that OxMYBR1 rosettes lost water and chlorophyll faster than WT and loss-of-function mutants (Figure 3B and 3C). Therefore, consistent with the down regulation of stress responsive genes, the data
suggests that OxMYBR1 plants transpired water faster and are consequently less drought tolerant than WT plants.
Drought stress was also imposed by withholding water for 18 d on seedlings from all available genotypes. Sur-prisingly, we recorded a 100% survival in all 10 repli-cates of OxMYBR1 (42–6) (Additional file 1: Figures S2A and S2B). Results obtained when drought stress was im-posed by withholding water were opposite to what was observed following PEG mediated drought stress.
When performing the soil drying experiments above it was observed that, when plants from each genotype were provided with equal volumes of water, the OxMYBR1 soil dried more slowly than other genotypes. Therefore to investigate the contradictory results obtained by PEG and soil drying experiments, we conducted transpira-tional water loss assays on whole plants (Additranspira-tional file 1: Figure S2C). In these experiments, soil water loss by evap-oration was prevented so that plant water use could be
Figure 3 Gain of AtMYBR1 function results in reduced drought tolerance. (A) Reduced drought tolerance in the OxMYBR1 (35Spro:MYBR1)
plants – lines 31–3 and 42–6. PEG at 10% and 15% concentrations was applied to 35 d old plants of OxMYBR1, mybr1, mybr2 and mybr1xmybr2 and WT (Col-0). Eight plants were used for each treatment. Pictures were taken 5 d after PEG treatment. (B) Detached whole rosette leaf water-loss from 20 d old plants. Transpirational water loss and standard error was calculated at each time point (bar; n = 6). The P-value of two factor ANOVA is 4.7E-18. (C) Rate of chlorophyll leakage from detached whole rosette leaf; standard error (bar; n = 6).
monitored. The results showed that OxMYBR1 plants lost water slower than WT and mutants, which is contrary to what was observed in detached whole rosette leaves (Figure 3B). In other words, OxMYBR1 plants extracted and/or used less water from the soil than other geno-types, even though the transpirational capacity of the detached leaves was relatively higher. Therefore, we inves-tigated the water conservation characteristic of OxMYBR1 further. We measured the soil water content after impos-ing an 8 d drought. Results confirmed that water uptake was less in OxMYBR1 than in WT and loss-of-function mutants during drought (Additional file 1: Figure S2D). Under normal (unstressed) growth conditions, OxMYBR1 plants grew more slowly than WT and loss-of-function mutants (Additional file 1: Figure S2A) and we show later that OxMYBR1 lines have shorter primary roots than other genotypes. Therefore, with respect to MYBR1 func-tion, we conclude that reduced water use in whole OxMYBR1 plants in drying soil is not due to a genetically determined reduction in transpiration but is rather a con-sequence of lower biomass leading to slower depletion of soil moisture. The reduced growth rate of OxMYBR1 lines was also noted by Jung et al. [15] and in soybean by Seo et al. [25].
As an aside, we note that the residual water content of mybr2 material was slightly higher than the other loss-of-function lines (Additional file 1: Figure S2D). This may be an indication that the functions of MYBR2 are not identical with those of MYBR1, as discussed later.
MYBR1pro:GUS is expressed under abiotic stress and
during senescence, mechanical wounding and floral organ abscission
A 2.7 kb promoter fragment of MYBR1 including the 5′ UTR was fused to the β-GLUCURONIDASE (GUS) re-porter gene (MYBR1pro:GUS) and the expression of
MYBR1 was examined histochemically. GUS staining was performed on homozygous T2and T3plants. In 13 d
old seedlings (Additional file 1: Figure S3A), GUS expres-sion driven by the MYBR1 promoter was observed in coty-ledons and true leaves. In contrast to very high GUS expression in cotyledons, GUS expression was lower in younger true leaves relative to older leaves and was absent in the newly emerged leaves. Intriguingly, GUS expression was observed in patches in younger leaves and was absent around the vascular regions of both older and younger leaves hinting that MYBR1 could be involved in senes-cence since this pattern was reminiscent of the develop-ment of visible senescence in leaves reviewed in [9]. Under normal conditions, expression of GUS was also ob-served in hydathodes of all leaf margins as well as embryo, suspensor, endosperm, root, stigma, sepal, petal and an-ther filament but was absent in stem, cauline leaf, anan-ther, silique and testa (Figure 4A, C, D and E and Additional
file 1: Figure S3). GUS expression was observed in embryo and endosperm dissected from siliques at develop-mental stages from 6–18 DPA as well as from dry and imbibed (30 min – 99 h) mature seeds (Additional file 1: Figure S3B and S3C). The intensity of GUS staining in-creased with development in embryos but remained con-stant in endosperm except at 6 DPA when the GUS expression was lower. GUS expression was high and remained constant in embryos collected from dry seeds and seeds imbibed up to 24 h but declined subsequently. GUS expression in endosperm of dry and imbibed seeds remained high.
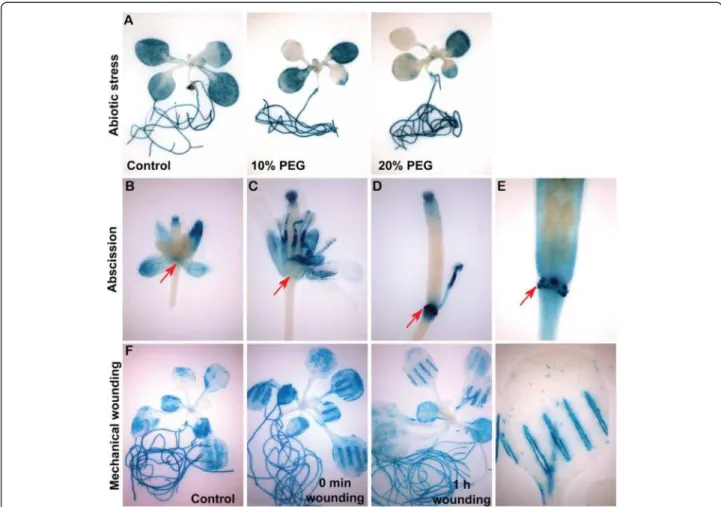
Water stress significantly reduced GUS expression driven by the MYBR1 promoter in leaves but not in roots relative to control (Panel A in Figure 4). Drought induced reduction of MYBR1 expression is consistent with the reduced expression of MYBR1 under drought treatment observed by Huang et al. [8].
GUS reporter activity was rapidly and strongly induced immediately after mechanical wounding of leaves (Panel F in Figure 4). Similar high MYBR1 expression was also ob-served at the abscission zone (AZ) on the pedicel follow-ing sepal, petal, and anther filament abscission (Figure 4D and 4E). Prior to the abscission of floral organs (Figure 4B and 4C), no GUS expression was visible on the pedi-cel. However, we did not observe either accelerated-or delayed/abolished flaccelerated-oral accelerated-organ shedding in MYBR1 loss-and gain-of-function mutants, suggesting that the high GUS expression at the AZ is due to the wounding response.
AtMYBR1 delays leaf senescence
Early in leaf senescence chloroplasts disassemble with subsequent degradation of chlorophyll and visible leaf yellowing. To further investigate the role of MYBR1 in leaf longevity, detached rosette true leaves numbers 3–6 (counted by order of emergence), from 30 d old soil grown plants were incubated in buffer as described [26] in two different sets. Leaves were photographed and the chlorophyll content was quantified on 0 d for one set and after 6–7 d of dark-induced senescence treatment for the other set. In freshly harvested leaves, the chloro-phyll content was higher in one line of OxMYBR1 (#42-6) and two reciprocal double mutants of mybr1 and mybr2 than the rest of the genotypes (Figure 5B). Following dark-induced senescence, OxMYBR1 lines showed increased leaf longevity and slowed chlorophyll degradation relative to WT leaves (Figure 5A and 5C). Interestingly, increased leaf longevity in OxMYBR1 lines was in contrast to that in mybr1 and reciprocal mybr1 & mybr2 mutants which ex-hibited early leaf senescence and accelerated chlorophyll degradation relative to WT (Figure 5A and 5C) although the chlorophyll content before treatment was relatively high in mybr1 and mybr2 double mutants (Figure 5B).
Jaradat et al. BMC Plant Biology 2013, 13:192 Page 7 of 19
Indeed, among the eight genotypes, leaves of mybr1 & mybr2 were least green following senescence treat-ment and showed the fastest chlorophyll breakdown (Figure 5A and 5C).
To further investigate the role of MYBR1 in leaf senes-cence, excised leaves of 37 d old transgenic MYBR1pro:
GUS were stained for GUS before and after dark in-duced senescence (Figure 5D). In untreated plants, GUS staining was strong in older leaves and was ab-sent in younger leaves and in vascular region. GUS staining became weaker overall in dark-treated leaves relative to fresh leaves but among the dark treated leaves, there was more GUS staining in senescent, yel-low leaves (indicated by asterisks) than green ones, fur-ther suggesting that MYBR1 plays a role during leaf senescence.
AtMYBR1 regulates the expression of senescence genes
To investigate whether MYBR1 regulates the expression of senescence genes, we compared the differentially expressed gene lists of Table 2 with microarray data ob-tained by van der Graaff et al. [22] on various stages and types of leaf senescence (NS: developmental senescence; DIS: darkening-induced senescence; DET: senescence in dark-induced detached leaf ). The number of com-mon genes between the two microarray analyses is 852 (Additional file 3: Table S4) which covers 52% of our differ-ential gene list. The increase of MYBR1 induction with the progression of senescence is high in NS, low in DIS and DET whereas MYBR2 induction is slightly increased in sink-to-source transition (5 week) stage of NS [22].
The regulation of these 852 common genes by ABA, MYBR1 and senescence revealed the interaction between Figure 4 AtMYBR1 promoter drives GUS expression during abiotic stress, floral organ abscission and mechanical wounding. Histochemical localization of GUS activity was performed by staining with X-gluc for different time intervals as described below and in Methods. Panel (A) Significant reduction of GUS expression in leaves after drought stress. However, intense GUS expression in roots was similar to control. (B) A closed flower was opened manually by forceps before GUS staining was performed. (C) A fully opened flower. (B) and (C) No GUS expression was found on pedicel at the point where the sepal, petal and anther join (shown by arrows). (D) and (E) In contrast, intense GUS expression was observed at pedicel connecting sites of floral organs after abscission (arrowheads). (E) A silique fully abscised with floral organs, was stained briefly (2 h) for GUS. Magnification of the connections between floral organs and pedicel shows GUS expression only at attachment sites on pedicel. Panel (F) Leaves were wounded with hemostats. Intense MYBR1 promoter driven GUS expression was observed around the wound relative to control.
ABA and MYBR1 during senescence (Additional file 1: Table S5 and Additional file 3: Table S4 online). Out of 165 genes in class A (Table 2, repression of ABA sponse), 88% were induced by both ABA and NS but re-pressed by MYBR1, clearly demonstrating that MYBR1 is
a suppressor and ABA is an activator of leaf senescence. Furthermore, out of 261 genes in class C (MYBR1 inde-pendent ABA repression), 95-96% genes are down-regulated by NS, DIS and DET and from 146 genes in class G (MYBR1 independent ABA activation), 86% are Figure 5 Effect of MYBR1 on leaf senescence in a detached leaf assay. (A) True leaves numbers 3–6 were harvested from 30 d old soil grown plants and incubated on filter paper wetted with 3 mM MES buffer (pH 5.7). Leaves 3 and 4 were photographed after 6 d treatment and leaves 5 and 6 were photographed after 7 d treatment. Leaves from OxMYBR1 plants of three independent lines (#31-3, 1–7 and 42–6) showed delayed senescence relative to other genotypes and leaves from mybr1 and double mutant plants exhibited premature leaf senescence relative to leaves from WT (leaves 5 and 6) and OxMYBR1 plants (all leaves). Two sets of experiment were carried out as above (A) in four replicates and 12 plants in each replicate. Statistical significance was determined using one-way ANOVA with Tukey using the statistical software ‘R’ (P < 0.05). (B) In one set of experiments, chlorophyll was extracted and measured on 0 d. The chlorophyll content was higher in one line of OxMYBR1 (#42-6) and reciprocal double mutants of mybr1 and mybr2 than other genotypes. (C) In another set, chlorophyll was extracted and measured on 6 d for leaves 3–4 and on 7d for leaves 5–6 and the percentage chlorophyll retention was calculated relative to 0 d from (B). Chlorophyll retention
was generally higher in OxMYBR1 genotypes. (D) Using three independent homozygous MYBR1pro:GUS lines (#5-1, 7–6 and X1-4), experiments
were carried out as above (A) in two replicates. All leaves from each plant were harvested. GUS staining was performed on 0 d (untreated) and after 4 d of dark induced senescence. Asterisks indicate yellow leaves before and after GUS staining. After the treatment, GUS staining was higher in senescent leaves, but in green leaves was lower than corresponding control leaves.
Jaradat et al. BMC Plant Biology 2013, 13:192 Page 9 of 19
upregulated by NS in the same direction as by ABA showing a significant role of ABA in leaf senescence. Of a large number of common genes (161; class B), 89-93% are downregulated by ABA, MYBR1 and senes-cence and many of these genes are involved in protein synthesis (23 ribosomal protein genes), photosynthesis (31 genes), auxin responses (6 genes) and biotic stress (5 genes).
Furthermore, we performed QRT-PCR on senescence marker genes in rosette leaves numbers 3 and 4 in all the genotypes (primers for QRT-PCR are listed in Additional file 1: Table S3). Consistent with our detached leaf senescence analysis (Figure 5), accelerated leaf senes-cence of mybr1xmybr2 was associated with upregulated expression of SAG12, SAG29 and SENESCENCE4 (SEN4) relative to all other genotypes (Figure 6). SAG29 expres-sion was 70 (±8.5) fold higher in mybr1xmybr2 relative to WT. The expression of SAG12, SAG29, SEN1 and SEN4 were downregulated in OxMYBR1 relative to WT, consist-ent with the senescence-suppressing effect of MYBR1. Changes in expression of these genes in the single mutants mybr1 and mybr2 were generally small. However, expres-sion of SAG21 and SEN1 did not show a reciprocal rela-tionship between gain and loss of function genotypes. Nevertheless, it is apparent that MYBR1 negatively regu-lates senescence based on 3 of the 4 marker genes.
Protein degradation occurs during senescence via dif-ferent pathways such as autophagy (APG) and the 26S proteosome and components of both pathways were transcriptionally activated during senescence [22,27]. Our differential gene list contains 87 genes involved in protein degradation pathways (Additional file 3: Table S4). Here we report the repression of 44 genes by OxMYBR1, where 31 genes encode components of E2 (ubiquitin-conjugating
protein (UBC)), E3 ubiquitin-ligase complex and 20S core particle of 26S proteosome and three genes are APG8a/ 8f/8e. Interestingly, only three genes in the ubiquitin pathway - PHD finger family, EARLY-RESPONSIVE TO DEHYDRATION 16/UBIQUITIN ETENSION PROTEIN 1 (ERD16/UBQ1) and SUPPRESOR OF NIM1-11 (SON1) were upregulated by OxMYBR1. SON1 is an F-box protein component of E3-ubiquitin ligase complex which nega-tively regulates, through the ubiquitin-proteosome path-way, a novel defense response that is independent of systemic acquired resistance [28]. On the other hand, 45 genes involved in protein degradation were activated by ABA in both WT and mybr1, and many of them are also upregulated by NS, DIS and DET [22].
Content of endogenous cytokinins and jasmonic acid
To investigate the role of MYBR1 in relation to hormonal pathways, endogenous hormone levels were measured quantitatively by LC-MS/MS in rosette leaves numbers 3 and 4 of three weeks old plants (Figure 7). trans-Zeatin (t-Z) and N6-(Δ2-isopentenyl) adenine (iP) and their sugar derivatives are the major cytokinins (CKs) in Arabi-dopsis [29]. Levels of several CKs were significantly in-creased in OxMYBR1 relative to other genotypes. On the other hand, JA was significantly higher in mybr1 x mybr2 relative to other genotypes. This suggests that suppres-sion of leaf senescence by MYBR1 is associated with in-creases in CKs and conversely that increased senescence is associated with higher JA.
In our microarray data, OxMYBR1 (comparison: OxMYBR1 treated with PBI425 versus untreated OxMYR1) downregulated ARR4 (Table 2), a transcriptional re-pressor of CK signaling [30]. However, the down regu-lation of ARR4 by ABA (Table 2) and senescence [22] is
Figure 6 MYBR1 and MYBR2 regulate expression of some senescence-related genes. QRT-PCR was performed on total RNA extracted from rosette leaves numbers 3–5 of 21 d old soil grown plants of WT (Col-0), gain- and loss-of MYBR1 function as well as mybr2 and double mutant mybr1xmybr2. Standard error (n = 2) of biological repeats are indicated.
contradictory and may be due to a feedback effect. Fur-thermore, we did not detect differential expression of genes involved in CK metabolism but a posttranscriptional regulatory effect of MYBR1 on expression of these genes cannot be ruled out.
OxMYBR1 leaves contained similar levels of ABA and its metabolite dihydrophaseic acid to those measured in WT/mybr1 and mybr1xmybr2. Levels of SA and IAA were also not significantly altered. It is surprising that ABA levels remained constant despite the strong effect of AtMYBR1 overexpression on ABA responses. To in-vestigate further, we performed qRT-PCR (primers for QRT-PCR are listed in Additional file 1: Table S3) on six ABA downstream effectors; ABI5, EEL and ABF1/2/3/4 in plants of OxMYBR1 (lines 42–6 and 31–3), WT, mybr1/2 and mybr1 x mybr2 (Additional file 1: Table S3). No signifi-cant differences of expression of these genes were evident among the genotypes tested.
MYBR1 mis-expression affects leaf and root morphology
We examined the roots of gain-and loss of MYBR1 func-tion genotypes (Figure 8). Primary roots of OxMYBR1 lines were drastically shorter, whereas those of mybr1 were notably longer relative to WT. This shorter root phenotype of OxMYBR1 may contribute toward re-duced water uptake in the OxMYBR1 lines as noted earlier, and may help explain the differences between results of PEG treatments and soil drying experiments described above.
The Arabidopsis mutant amp1, with a high level of en-dogenous CKs, had increased numbers of rosette leaves [31]. Conversely, plants overexpressing catabolic CK oxi-dases had fewer leaves than WT plants [32]. We counted rosette leaves in seedlings of two lines of OxMYBR1, WT and mybr1. Seedlings of OxMYBR1 lines had con-sistently more rosette leaves relative to other genotypes and double mutant mybr1xmybr2 had fewer leaves relative to all other genotypes (Figure 9). Differences between ge-notypes are slightly enhanced by ACC treatment. Using two way ANOVA, there is a consistent, statistically signifi-cant difference in leaf number between mybr1 x mybr2 and the OxMYBR1 lines but no significant difference be-tween control and ACC treatments.
MYBR1 physically interacts with PYL8 and INO
Further information on the mechanistic role of MYBR1 in signaling was obtained by identifying protein-protein interactions using the yeast 2-hybrid system. Initially PYR1-LIKE8 (PYL8) and INNER NO OUTER (INO) proteins were identified as interacting with MYBR1 by screening an Arabidopsis cDNA library made from dif-ferent stages of vegetative and floral tissues with a full length MYBR1 fused to the DNA-binding (BD) domain of the yeast GAL4 protein. It has been shown by many groups that the 14 members of the PYR/PYL/RCAR family are intracellular ABA receptors that interact with and inhibit several PP2C-type protein phosphatases in-cluding ABI1, ABI2, HAB1 and PP2CA [2-4]. INO en-codes a YABBY-type TF and is required for both polarity determination and outer integument initiation in ovule development [33].
Figure 7 Endogenous levels of CKs and JA in rosette leaves numbers 3–5 of 25 d old soil grown plants of WT, gain- and loss-of MYBR1 function and double mutant mybr1xmybr2. Leaves were harvested from at least 8 plants per replicate per compound measured. Standard error was calculated from each hormone (n = 4). CKs measured include: c-ZOG, cis-zeatin-O-glucoside; t-ZOG, trans-zeatin-O-glucoside; t-ZR, trans-zeatin riboside; c-ZR,
cis-zeatin riboside. JA*: Concentration was measured as ng g-1FW.
Figure 8 Primary root lengths of MYBR1 genotypes. Primary roots were measured in soil-grown 8 day old plants. The results are expressed as the percentage of roots of each genotype that fell within the four indicated length ranges. For each genotype, the total number of measured roots and the total range of lengths in cm were: OxMYBR1 42–6, 380 (range 0.54-2.12); OxMYBR1 31–3, 203 (range 0.71-2.71); Wild type, 270 (range 0.62-3.57); mybr1, 372 (range 1.22-3.59).
Jaradat et al. BMC Plant Biology 2013, 13:192 Page 11 of 19
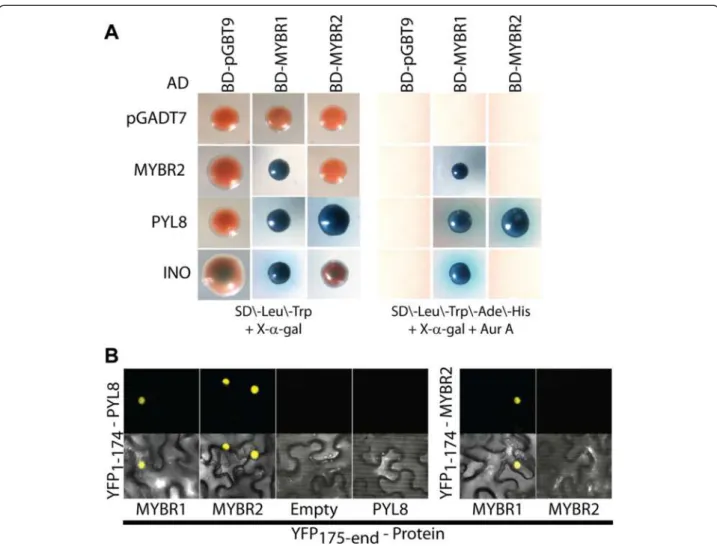
MYBR1 interaction with PYL8 encouraged us to sub-sequently fuse all 14 PYR/PYL/RCAR genes as well as INO and MYBR2 to the transcription-activation (AD) domain of the yeast GAL4 protein. Interestingly, only PYL8, INO and MYBR2 interacted with MYBR1 (Figure 10). Inter-action of MYBR1 and PYL8 was confirmed by three inde-pendent experiments using a more stringent screening of positive clones on four drop out media (SD/-Leu/-Trp/-His/-Ade) in the presence of antibiotic Aureobasidin A. Furthermore, we also fused the full length MYBR2 to the BD-domain and found that it also interacts only with PYL8 out of the 14 PYL family members. But MYBR2 showed no interaction with INO which suggests that, des-pite their shared roles in stress response and senescence, MYBR1 and MYBR2 have some non-redundant functions. In Figure 10, yeast colonies resulting from interaction of AD-pGADT7, -MYBR2, -PYL8, and -INO with MYBR1 were smaller compared to those with BD-MYBR2 and BD-pGBT9. It should be noted that we observed slight autoactivation and notable toxicity/re-duced cell growth from high expression of MYBR1 using the pGBKT7 plasmid and hence used the lower expressing plasmid pGBT9.
Next, we examined whether the protein-protein inter-actions described above are affected by phytohormones (Additional file 1: Figure S4). In addition, MYBR2 is re-ported to modulate auxin signaling [21] and therefore we also tested inhibitors of auxin signaling (PCIB) and transport (TIBA and NPA). However, the above interac-tions were constitutive and not affected by phytohor-mone additives.
We performed bimolecular fluorescence complemen-tation (BiFC) assays in Nicotiana benthamiana leaf epi-dermal cells to independently verify the interactions of PYL8 with MYBR1 and MYBR2 and of MYBR1 with MYBR2. It has been shown previously that PYL8 and MYBR1 are localized in the nucleus [15,34] and inter-action between MYBR2 and ARF7 occurs in the nucleus [21]. All interactions of PYL8 with MYBR1 and MYBR2 and of MYBR1 with MYBR2 are high with consistent fluorescent signal (Figure 9). Yeast two-hybrid and BiFC approaches confirmed the interactions of PYL8 with MYBR1 and MYBR2 and between MYBR1 and MYBR2 and showed that PYL8 may modulate the binding of MYBR1 and MYBR2 to DNA and/or that both MYBR1 and MYBR2 may modulate PYL8 function. The inter-action of MYBR1, 2 with only PYL8 but not with other members of PYR/PYL/RCAR family suggests that these interactions define very specific functional roles.
Discussion
We previously identified MYBR1 as a weakly ABA re-sponsive gene [14] and here we provide evidence that it is a repressor of ABA signaling during seedling growth, drought and senescence. It is now clear that MYBR1 is part of the ABA/abiotic stress response and wounding/ abscission response networks, both of which involve sen-escence responses. MYBR1 acts as a negative regulator (feedback repressor) of responses to stress, wounding and abscission in favor of normal growth and development. MYBR1 is by no means unique in its ability to negatively regulate ABA and stress responses. Other examples in-clude the AP2 domain TFs ABA REPRESSOR1 (ABR1) [35] and ETHYLENE RESPONSE FACTOR7 (ERF7) [36] and the homeodomain protein HB6 [37].
Our original observations that MYBR1 was induced by PBI425, induced weakly by ABA, repressed by drought and paradoxically induced by rewatering after drought stress [8,14] have been confirmed and can now be ratio-nalized. Under non-stressed conditions, ABA treatment produces unnecessary stress responses and MYBR1 in-duction blocks these responses to restore normal pat-terns of gene expression. Under water stress conditions MYBR1 is not expressed, allowing the full effects of ABA to be manifested and allows adaptive responses to be main-tained during drought stress. On recovery from stress, MYBR1 expression leads to repression of ABA responses Figure 9 Leaf number in MYBR1 genotypes. Seeds from WT, mybr1,
mybr1xmybr2 and three lines of OxMYBR1 (42–6, 31–3 and 1–7) were germinated on MS plates and 8 d old seedlings were transferred to fresh plates without and with 5 and 10 μM ACC. Leaf number was counted 17 d after transfer. Control and ACC treated experiments were conducted in four replicates and each replicate contained four seedlings per genotype. The experiment was repeated three times. Standard error was calculated at each time point (n = 12). Two-way ANOVA resulted in significant differences between genotypes but no significant difference between control and ACC treatments. There were increased numbers of rosette leaves in OxMYBR1 lines relative to other genotypes (especially line 42–6) and a significantly reduced number of leaves in the mybr1 and mybr2 double mutant relative to most other genotypes with and without ACC. However, ACC treatment qualitatively enhanced differences between genotypes.
that are no longer required. The regulation and effects of MYBR1 are summarized in Figure 11.
Although induced senescence during prolonged drought has survival value by conserving water and nutrients [11], there are clearly finely balanced advantages and disad-vantages to irreversible loss of vegetative matter. In fact, by introducing a novel feedback mechanism to suppress drought induced senescence in tobacco, Rivero et al. [10] demonstrated striking beneficial effects, sug-gesting that, in a crop plant context, induced senescence can be disadvantageous. Therefore, it seems that MYBR1 is a component of an endogenous homoeostatic mechan-ism to balance growth, high seed production and risk of death versus senescence, survival and minimal seed production. Given that senescence of older leaves is a normal stage of leaf development, MYBR1 appears to also play a role in determining the normal length of the leaf adult phase.
Senescence induces protein degradation pathways [22,27,38] and the effects of MYBR1 are associated with reduced/delayed expression of ubiquitin- and autophagy mediated protein degradation and increased produc-tion of CKs. Previous studies have associated drought-induced leaf senescence with reduced CKs [11] and increased CK biosynthesis blocks leaf senescence [39]. Higher levels of CKs, reduced primary root growth and more adult leaves in OxMYBR1 lines are also consistent with increased CK effects. However, there are other hor-monal interactions. MYBR1 appears to repress jasmonate effects – which likely also contributes to suppression of wounding responses. Jung et al. [40] demonstrated that MYBR1 was induced by jasmonate and also showed that jasmonate responses were repressed. More re-cently Shim et al. [41] show that MYBR1 represses JA defense responses and activates salicylic acid-mediated defenses via WRK70 leading to enhanced responses to Figure 10 Physical interaction of MYBR1 and MYBR2 with PYL8, MYBR2 and INO as determined by the yeast two-hybrid method and BiFC. (A) Blue color from galactosidase activity indicates interaction between proteins produced from the bait (top row) and prey (vertical axis) vectors. (B) BiFC of the interactions of PYL8 with MYBR1 and MYBR2 and of MYBR2 with MYBR1in N. benthamiana leaf epidermal cells. Top panel shows the signal from eYFP, reconstituted from YFP1-174 aa -PYL8 and YFP175-end aa -MYBR1 & MYBR2 and from YFP1-174 aa -MYBR2 and YFP175-end aa -MYBR1. Bottom panel presents eYFP and transmitted light detector signals.
Jaradat et al. BMC Plant Biology 2013, 13:192 Page 13 of 19
biotrophic pathogens and attenuated responses to necro-trophic pathogens.
We propose a model of MYBR1-repression of ABA signaling during drought and senescence (Figure 11). It has been shown previously that PYL8 is localized in both cyto-plasm and nucleus and the interaction between PP2C1 and PYL8 takes place in the nucleus [34]. In addition, MYBR1 is also localized in the nucleus [15]. Therefore, the inter-action of MYBR1 with PYL8 suggests a direct role of MYBR1 in modulating ABA perception. The uniqueness of the interaction with PYL8 (and with no other PYL) pro-vides an example of receptor specificity - an ABA receptor mediating a specific sub-network of responses. The exist-ence of such effects was suggested by comparison of the ef-fects of ABA analogs in Huang et al. [14]. Previous papers have noted that binding of PYL8 to PP2Cs does not appear to be dependent on ABA, so the regulatory significance of the PYL8-ABA complex is not clear. Increased drought tol-erance and ABA hypersensitivity in seed of 35Spro:PYL8
lines showed that PYL8 is an overall positive regulator of ABA signaling [34]. Binding of MYBR1 to PYL8 may block interaction with and inhibition of PP2Cs. Alternatively, PYL8 may regulate MYBR1 binding to DNA. Since PYL8-PP2C binding is independent of ABA, PYL8 may be responsible for constitutive ABA signaling that is inde-pendent of ABA itself or ABA may be required to fully potentiate PYL8-PP2C interaction. Future studies will fur-ther explore the MYBR1-PYL8 interaction in relation to MYBR1 function.
The weak phenotypes of the mybr1 and mybr2 mutants and the enhanced effects in the double mybr1 x mybr2 mutant strongly suggest that MYBR1 and MYBR2 are par-tially redundant and the yeast two hybrid data indicates that they may form heterodimers (Figure 11). However, MYBR2 has mainly been associated with auxin signaling and root development [21], shows differing MYBR2PRO::
GUS expression patterns compared to MYBR1PRO::GUS
[21], and has not been distinctly associated with ABA or jasmonate response as our data and others suggest for MYBR1 [14,15,17,40].The specific interaction of MYBR1 (and not MYBR2) with INO suggests that there are at least some unique functions of MYBR1 not shared by MYBR2. However, the significance of the MYBR1-INO interaction is unknown at this time. INO encodes a YABBY-type tran-scription factor and is only known to be involved in ovule development [33] and there is no specific MYBR1 pheno-type associated with flowers.
The effects of MYBR1 overexpression in Arabidopsis were also studied by Jung et al. [15], but some of their results were significantly different to those reported here. Jung et al. [15] reported downregulation of stress genes but increased stress tolerance and reduced water loss from detached shoots in over-expression lines and ob-tained similar results in soybean transgenics [25]. Simi-larly, Persak and Pitzschke [17] reported delayed mortality of an OxMYBR1 line relative to wild type when exposed to toxic levels of salt. For this reason, we focused carefully on identifying the most appropriate approach to measuring Figure 11 Model of MYBR1 mechanism of action and effects.
drought and water loss. We believe that our results dem-onstrate that the reduced size of OxMYBR1 lines – due to slower growth of above-ground tissues and shorter primary roots – is associated with reduced water use and slower de-pletion of soil moisture. This phenomenon produced an apparent increase in drought tolerance because the differ-ential size and water use of the MYBR1 genotypes were not taken into account. To circumvent this issue, PEG treatment (which maintains a specific soil water potential) was used to reveal the increased sensitivity of OxMYBR1 lines to water stress (as shown in Figure 3A). Furthermore our microarray results are consistent with reduced stress responses in OxMYBR1 lines and careful analysis of micro-array results in Table 1 in Jung et al. [15] suggests that many well-known positive effectors or regulators of stress responses (such as ERD1, KIN1, COR15a, COR15b, RAB18, RESPONSIVE TO DESSICATION29A (RD29A), COR47, RD29B, DELTA1-PYRROLINE-5-CARBOYLATE SYNTHASE1 (P5CS), DREB2A) were similarly down-regulated in overexpressing AtMYBR1 plants relative to WT plants. However, Jung et al. did not perform experi-ments that showed the effects of MYBR1 overexpression on repressing ABA/PBI425-induced genes (as in Figure 1). The differences between our results and Jung et al. [15] in measuring drought tolerance provides a cautionary ex-ample of the complexities and subtleties of performing and interpreting drought and water use experiments. Un-like Jung et al. [15] and Persak and Pitzschke [17], we did not investigate salt-stress related phenotypes related to MYBR1 expression. More recently, Jung et al. [40] sug-gested that MYBR1 was induced non-specifically by phyto-hormones and suppressed jasmonate responses. Our data also suggest an effect of MYBR1 on repressing JA re-sponses, but show a direct and unambiguous link to ABA signaling as described above.
Conclusions
In the last few years, considerable information has accu-mulated on the involvement of MYBR1 in stress-related MAPK signaling. However, the function of the gene in rela-tion to stress responses has remained unclear. This study reveals that MYBR1 is a component of ABA signaling and appears to be involved in feedback maintenance of adult, pre-senescent growth, especially under conditions of stress and wounding. As such it provides an example of a tran-scription factor that integrates, balances and co-ordinates hormonal, developmental and environmental signals.
Methods
Plant materials, growth conditions and treatment
Arabidopsis thaliana plants were grown under long-day conditions in a growth cabinet at 22°C and 40% humid-ity with 16 h of 80 μE light and 8 h dark cycles. Seeds were surface sterilized as follows: seeds were washed
aseptically; once with 70% ethanol for 30 sec and three times with 20% bleach for 5 min followed by four washes with sterile water. Water was removed after the final wash and 0.2% agar solution was added to facilitate placing seeds on Murashige-Skoog (MS) + 0.8% agar media with-out sucrose. Seed stratification was performed at 4°C, in the dark for 3 d. Since growth rates differ slightly between genotypes, care was taken that observed differences be-tween genotypes at specific times were consistent and not artifacts of different developmental stages.
For microarray experiments, growth of plants, treatment of 5 week old plants with 20 μM PBI425 for 24 h and above ground tissue collection were done as described in Huang et al. [14].
For root phenotyping of seedlings following seed stratification, agar plates were transferred to a controlled environment cabinet. Eight days after stratification, seed-lings were photographed using a digital camera and root lengths were measured using ImageJ software (version 1.37v, NIH, USA).
For generation of mybr1xmybr2 double mutant, T-DNA insertion lines of (mybr2) SALK_67655 was obtained from the Arabidopsis Stock Center (http://arabidopsis.org). This loss-of-function mutation in this line is caused by T-DNA insertion into an exon. mybr2 homozygous plants were identified by PCR as described [42]. Homozygous plants of mybr1 [14] and mybr2 were crossed reciprocally. Homozygous double mutants mybr1♀ x mybr2 ♂ and mybr2♀ x mybr1♂ were identified by PCR [42].
PEG treatment
Following stratification at 4°C, plants were grown in soil (Sunshine 3 Mix from Sun Gro Horticulture Inc.) for 17 d in a growth chamber at 22°C and 64% humidity with 16 h of 150 μE light and 8 h dark cycles, then trans-planted individually into 2″x 2.5″ pots filled with 90 ml sand: soil (2:1) mix. Pots were watered with 30 ml Hoag-land solution. We found that maintaining high humidity is crucial in this experiment. Plants were watered as needed and after 20 d, 50 ml of 10% or 15% PEG solutions was added to each pot. After 30 min to allow drainage, pots were transferred to fresh tray holders. Pictures were taken 5 d after PEG treatment.
Transpirational water loss assays of detached whole rosette leaf and whole plants
Plants were grown as described above. Whole rosette leaves of 20 d old plants were excised, placed in a weigh-ing boat and weighed at intervals for up to 9 h. Samples were kept at 22°C between weighing intervals.
Chlorophyll assay
Freshly harvested leaves were weighed and chlorophyll was extracted on 0 d (untreated) and after 6–7 d following dark
Jaradat et al. BMC Plant Biology 2013, 13:192 Page 15 of 19
induced senescence. Chlorophyll extraction and quantifica-tion were carried out as described by [43]. Leaves or whole rosettes of Arabidopsis were harvested and weighed. Chlorophyll was extracted by placing the tissue in 90% ethanol at 65°C for 3 h until all tissues became chlorophyll free. The amount of total chlorophyll was determined by measuring absorbance at 664 and 647 nm [44] with a Mi-croplate Reader (Synergy H1) from Biotek and using the formula: micromoles of chlorophyll per milliliter per gram fresh weight = 7.93(A664) + 19.53(A647).
MYBR1pro:GUS plasmid construction, treatments
and GUS staining
A 2.7 kb fragment, including the 5′UTR, of the AtMYBR1 promoter was PCR amplified from Arabidopsis thaliana (Col-0) WT genomic DNA using the primers 5′-attB1-gtagtgcgtgtggatatatacatgca-3′ and 5′-attB2-tgattttggaatg ttttatcaaactttag-3′ and cloned into pDONR221 using a Gateway BP reaction (Invitrogen). Following sequence veri-fication, the MYBR1 promoter was then cloned into the GUS expression vector pMDC162 [45] with an LR reaction (Invitrogen).
For GUS staining in seedling, flower and silique, homo-zygous T2 and T3seedlings were grown for 13 d on MS
medium in the presence of 1% sucrose and were stained for GUS activity for 70 min. For drought stress, seedlings were grown for 7 days and drought was imposed by over-laying 10% and 20% PEG on an agar plate for 44 h followed by GUS staining for 1 h. True leaves of control plants were wounded aseptically with hemostats and 30 min GUS staining was performed at 0 h and after 1 h of wounding. Floral tissues were stained for 16 h unless otherwise stated. GUS staining was performed [46] with X-gluc staining reagent ( 0.1 M NaPO4 pH7.0, 10 mM
Na2EDTA, 0.1% Triton X-100, 1.5 mM K3Fe(CN)6,
0.5 mM K4Fe(CN)6, and 2.0 mM X-gluc) at 37°C in the
dark after three vacuum infiltrations of 1 min each. After staining, chlorophyll was removed completely by suc-cessive washes with 50%, 70% and 80% ethanol with gentle agitation and photographs were taken using a Wild M3Z dissecting microscope equipped with a Leica DFC320 camera.
For GUS staining in embryo and endosperm, plants were grown in growth chambers as described above. Si-liques were collected at 6, 9, 12, 15 and 18 days post anthesis (DPA) and were fixed in 20% acetone for >24 h at −20°C prior to embryo dissection followed by 30 min GUS staining. Dry and imbibed seeds at different time points were also fixed, dissected and then stained as de-scribed above.
Detached leaf senescence assay
Plants were grown on soil. Rosette true leaves numbers 1–4 as counted by order of emergence (cotyledons were
excluded), were excised and incubated with their abaxial sides down on two pieces of 3 MM paper wetted with 10 ml of 3 mM MES (pH 5.7) without or with different concentration of (+)-ABA, 1-aminocyclopropane-1-carboxylic acid (ACC), benzyl amino purine (BP), or MJA at room temperature in the dark [26]. Leaves numbers 1 and 2 were incubated for 5d and juvenile leaves numbers 3 and 4 were incubated for 6–13 d. Leaf pictures were taken after treatment and chlorophyll assay (described above) was performed.
Quantification of ABA, cytokinins and their metabolites and JA by LC-MS/MS
The plant hormone analysis was performed by high performance liquid chromatography-electrospray tandem mass spectrometry (HPLC-ES-MS/MS) using deuterated internal standards, as described [47,48]. The analysis of free salicylic and jasmonic acid using HPLC-ES-MS/MS with deuterated internal standards will be presented elsewhere (Han et al., unpublished).
RNA extraction and microarray labeling, hybridization and data acquisition
Total RNA was extracted from frozen tissues of four in-dependent biological replicates as described [49] with a slight modification. Instead of extraction buffer RLT, a mix containing 10 mM Tris–HCl pH 7.5; 0.1 M NaCl; 1 mM EDTA and 1% SDS was used. RNA quantification was performed by measuring optical density at 260 nm. Microarray labeling, hybridization, scanning and data ac-quisition were done for oligonucleotide microarrays ob-tained from the University of Arizona according to Huang et al. [14]. However, microarray labeling, hybridization and slide washing for Agilent Technologies Arabidopsis 4x44k arrays (version 4, product# G2519F, design ID 021169) were performed according to the manufacturer’s protocol using low input Quick Amp Labeling Kit for two color (Agilent Technologies; cat# 5190–2306) [50]. In short, 200 ng total RNA was used for cDNA synthesis and 2.5 h for cRNA amplification. Two μg each of cyanine 3- and 5-labeled amplified cRNA was hybridized to each array. After washing, each slide was scanned using Axon 4000B scan-ner with a resolution of 5 μm/pixel. Data acquisition was done as described above.
Microarray data analysis
Signal intensity normalization (method: Print-tip loess), fil-tering bad spots and control spots, filfil-tering minimum chan-nel intensity (intensity for both chanchan-nel should be <500 in most cases) and correlation coefficient among replicates were performed in BASE [51]. Quality control on sample data was performed in GeneSpring GX 10.0.2 (Agilent). To obtain statistically differentially expressed gene sets, a t-test against zero along with Benjamini-Hotchberg multiple
testing correction and with a 0.05 p-value cut-off were performed in GeneSpring. Furthermore, biologically sig-nificant differentially expressed gene sets were obtained by using a threshold fold change ≥ 1.5. The spot visualization feature in BASE was employed for an additional quality control for false positives/negatives. Afterward, log2 expression values for each sample type were uploaded into MapMan ImageAnnotator version 3.0.0RC3. Analysis for statistically significant enriched biological pathways, a Wilcoxon rank sum t-test embedded in MapMan was per-formed with a p-value cut-off of 0.05 and Benjamini Hochberg multiple testing correction [52]. Gene annota-tion was done based on TAIR database, MapMan and PlantsUBQ (URL http://plantsubq.genomics.purdue.edu).
Quantitative RT-PCR
Gene-specific primers for QRT-PCR were designed using PerlPrimer v1.1.14 [53]; http://perlprimer.sourceforge.net and are listed in Additional file 1: Table S3. Total RNA was isolated as described above, from rosette leaves 3 and 4 of three week old plants. Complementary DNA (cDNA) was produced using 2 μg total RNA using QuantiTect Reverse Transcription kit from Qiagen (catalog number 205311) according to the manufacturers instruction. Two biological and two technical repeats were performed with null-template control. Arabidopsis ACTIN2 was used as a normalization control [14]. cDNAs were diluted 10 times in QRT-PCR reactions for all genes (MYBR1, SAG29, SEN1 and SEN4) except SAG12 cDNA which was used without dilution. QRT-PCR was performed with SYBR green SuperScript III Platinum Two-Step qRT-PCR Kit (Invitrogen, 11735–032) according to the manufacturer instructions, on a Stratagene Mx3000P real-time PCR thermal cycler.
Construction of gene fusions for yeast two-hybrid assays
Open reading frames of MYBR1 and MYBR2 and 14 genes of PYR/PYL/RCARs family ABA receptors and the GAL4 activation domain (AD) and DNA-binding do-main (BD) were constructed in the pGADT7 and pGBT9 vectors, respectively (Clontech). The open reading frames (ORF) of PYL1/2/3/5/6/7/8/9/10/11/12/13 were PCR amp-lified from cDNA and the ORF of PYR1 from an ABRC clone (accession number U15941) using PfuUltra II fusion HS DNA polymerase (Agilent; catalog number 600670) and primers are listed in Additional file 1: Table S3. PCR products were gel purified with a gel extraction kit (QIA-GEN; catalog number 28704), were cloned into Gateway vector pDONR221 by a Gateway BP reaction (Invitrogen) and were verified by sequencing using M13 forward and reverse primers. ORFs of PYL4 and MYBR2 cloned in pENTR223 were obtained from ABRC clones (accession number G12806 and G14459, respectively) and were veri-fied by sequencing using T7 and M13 forward primers.
These 15 different ORFs were then cloned in-frame with the GAL4AD in pGADT7 by LR reactions (Invitrogen). ORFs of MYBR1 and MYBR2 were cloned in-frame with the GAL4BD in pGBT9 using In-Fusion Advantage PCR Cloning kit (Clontech; catalog number 639619) as follows: MYBR1 ORF was PCR amplified from cDNA and MYBR2 ORF from an ABRC clone G14459 using primers listed in Additional file 1: Table S3. PCR products were gel purified and verified by sequencing using forward 5′-ttttcgttttaaaacctaagagtc-3′ and reverse 5′-tcatcggaaga gagtagt-3′ primers. Plasmid pGBT9 was digested to com-pletion with EcoRI and BamHI and column purified (QIAGEN; catalog number 28106). In-fusion cloning reac-tions between ORFs and linearized pGBT9 were performed according to the manufacturer’s instruction.
Protein-protein interaction analyses
All gene fusions in pGADT7 and in pGBT9 were trans-formed into the yeast cell lines Y187 and Y2H Gold, re-spectively and were grown in the presence of 50 μg/μl kanamycin on media SD/Leu and SD/Trp, respectively, according to the manufacturer’s instructions (Clontech; Matchmaker gold yeast two-hybrid system; catalog num-ber 630489). Auto-activation and toxicity of pGBT9-MYBR1 and pGBT9-MYBR2 were tested as described by Clontech. For library screening, transformed yeast Y2H Gold with pGBT9-MYBR1 was used to screen an Arabidopsis normalized cDNA library; Mate and Plate (Clontech; catalog number 630487) which was con-structed from different stages of vegetative and floral tis-sues, cloned in pGADT7-RecAB vector and transformed into the yeast Y187. After 24 h mating, library screening was performed on medium SD/-Leu/-Trp/-His/-Ade in the presence of 20 μg/ml x-α-gal (Gold Biotechnology) and 78 ng/ml Aureobasidin A (Clontech) (QDO/X/A) and grown for 4 d at 30°C. Blue yeast colonies were streaked onto fresh QDO/X/A. Following 3 d growth, plasmids were isolated using the Easy Yeast Plasmid Isola-tion Kit (Clontech) and cDNA inserts were PCR amplified using LD-AD screening primers (Clontech) and verified by sequencing using T7 primer. For individual clone screen-ing, transformed yeast Y2H Gold with pGBT9-MYBR1and pGBT9-MYBR2 and transformed yeast Y187 with each PYR/PYL/RCARs/MYBR2-pGADT7 were mated for 1 d at 30°C and screened on media SD/-Leu/-Trp (DDO), DDO/ X/A and QDO/X/A as described by Clontech. Bimolecular fluorescence complementation (BiFC), including prepar-ation of constructs, was performed in N. benthamiana epi-dermal cells according to [50].
Accession numbers
The Arabidopsis Genome Initiative (AGI) locus identifiers for the genes from this article are as follows: MYBR1/ MYBR44 (At5g67300), MYBR2/MYBR77 (At3g50060),
Jaradat et al. BMC Plant Biology 2013, 13:192 Page 17 of 19