Assessment of high-value near-term engineering
innovations for Indian sanitation
by
Elliott S. Donlon
Submitted to the Department of Mechanical Engineering
in partial fulfillment of the requirements for the degree of
Master of Science in Mechanical Engineering
at the
MASSACHUSETTS INSTITUTE OF TECHNOLOGY
September 2020
c
○ Massachusetts Institute of Technology 2020. All rights reserved.
Author . . . .
Department of Mechanical Engineering
August 31, 2020
Certified by . . . .
Amos G. Winter, V
Associate Professor of Mechanical Engineering
Thesis Supervisor
Accepted by . . . .
Nicolas G. Hadjiconstantinou
Professor of Mechanical Engineering
Graduate Officer
Assessment of high-value near-term engineering innovations
for Indian sanitation
by
Elliott S. Donlon
Submitted to the Department of Mechanical Engineering on August 31, 2020, in partial fulfillment of the
requirements for the degree of
Master of Science in Mechanical Engineering
Abstract
This study presents the Sanitation Needs and Innovation (SaNI) framework for identi-fying underserved populations and gaps between their sustainable sanitation require-ments and sanitation system performance. Safe, sustainable sanitation is a vital, fre-quently unmet need – especially in low and middle-income countries. In India alone, economic losses from poor sanitation are estimated to be $53.8 billion annually, or 6.4% of the country’s 2006 GDP. Too often, sanitation solutions fail to address the full problem due to the complexity of constraints imposed by the environment, available technology options, and the many different stakeholders involved. Several frameworks have been established to distill possible solution paths, such as technoeconomic analy-sis and multi-criteria analyanaly-sis (MCA). However, technoeconomic analyses alone do not consider the multitude of other facets that contribute to sustainable sanitation, and MCAs are often very context-specific, non-quantitative, and used primarily for com-parative purposes. The SaNI framework enables analysis of cost of sanitation systems vs. population density to yield underserved populations and perform an MCA-like analysis to determine whether other, non-monetary, sustainable sanitation require-ments are met. A case study applying this framework to the Indian context identifies
population densities between 10,000 and 23,000 people/km2 as regions where current
technologies fail to meet cost requirements. The test case demonstrates quantitatively that septic tanks, a ubiquitous on-site sanitation method, are likely to be unsuitable for people with lower-than-average available land areas and abilities to pay. By quan-tifying the deficiencies of current sanitation technologies, the proposed framework can guide the development of the next generation of truly sustainable solutions.
Thesis Supervisor: Amos G. Winter, V
Acknowledgments
I have had a lot of help. Thank you to the following people for their contributions to my work and all their help along the way:
∙ My family, for supporting all of the choices I make and always having a spot for me back in the islands.
∙ Jaclyn, for helping to keep me sane and making sticky note frameworks on the living room floor with me.
∙ Amos, for making this work, and my time in GEAR Lab possible. Thank you for going through the ups and downs with me and helping me make sense of a tricky set of constraints over the past few years. Working and building rapport with you has been a blast!
∙ Dr. Susan Amrose, for pushing me to ask the right questions and answer them with scientific rigor. Without your wisdom, and a drop of unfailing optimism, this work would not have been the same.
∙ David Taylor, for our long talks about how I can best affect change in the world of WaSH while always keeping sights on what is attainable.
∙ Alberto Rodriguez and the MCube lab for teaching me that grad school wasn’t as dry as I thought and for showing me the value of quality research.
∙ Drs. Rob Stoner, A. Diane Rigos, Chintan Vaishnav, Jason Prapas, and Mrs. Shivangi Misra at the MIT Tata Center, for supporting the research and giving me a taste of global development innovation.
∙ The Tata Fellows of the 2018 cohort, for being great friends, companions, and sounding boards for my crazy ideas, no matter where we are in the world. ∙ My friends at the IITB and other Indian institutions, for making my field
re-search possible by helping me manage accommodations, translations and explo-rations across India. You know who you are.
∙ Mr. Tejas Kotak and his team at Hunnarshala, for their commitment to water and sanitation and teaching me about their efforts to improve it in Bhuj and beyond.
∙ Mr. Murty Jonnalagadda, Mr. Rahul Bramhankar and Mr. Mangesh Bhalerao of the RSPMU, for insights into the inner-workings of how WaSH programs are run and financed. Thank you for organizing our field visits in Pune and Satara where we were able to gain detailed awareness of what these programs look like in practice.
∙ Dr. Kailas Shinde, Mr. Shakil Mujawar, Mr. Sachin Pawar, Mr. Rohan Pawar, and the rest of the team at Z.P. Satara, for welcoming me to your district and helping me understand the on-the-ground complexities of water and sanitation. ∙ Mr. Amit Wajpe, Mrs. Shakti prava Maharana, and the rest of the CInI crew
in Dahod, for giving me a glimpse into the world of rural sanitation in India. ∙ Neha Agarwal, Anju Dwivedi, and Ambarish Karunanithi of the Center for
Pol-icy Research, for helping me understand some of the nuance behind community-scale sanitation and inspiring the cost density analysis framework.
∙ Makerworkshop mentors, for being a great community of creators and friends. I have been honored to be part of making a workshop with you.
∙ The members of the GEAR Lab, for creating a fun-loving and hard-working environment to do research in. I can always count on you to help me sort things out or have fun in the outdoors.
∙ Georgia, Hannah and Julia for becoming the unofficial members of the GEAR Lab Water and Sanitation Team.
∙ Larissa Little, for helping me combine, slice and analyze some really interesting data-sets.
∙ Last, but certainly not least, to all of the wonderful local people who welcomed me into their lives and expected nothing in return. You have my thanks, and I hope that this work can bring us one step closer to improved sanitation. I am grateful to the following funding sources for investing in me and in this work: MIT Tata Center for Technology and Design
Contents
1 Introduction 15
2 Presentation of the SaNI framework 17
2.1 Context definition . . . 18
2.2 Requirements estimation . . . 20
2.3 Technology performance estimation . . . 22
3 Identifying a sanitation service gap in India 25
3.1 Construction of the technoeconomic model . . . 26
3.2 The missing middle in sanitation technologies . . . 32
4 Test case: Evaluation of an FSM-based system 37
4.1 Requirements estimation . . . 37
4.2 Sanitation technology performance estimation . . . 39
4.3 Example results for an FSM-based system . . . 40
5 Discussion and implications 43
6 Conclusions 47
List of Figures
2-1 Process diagram of the SaNI framework for determining gaps between sanitation technology performance and the requirements of context-specific sustainable sanitation. The context definition subsection iden-tifies an underserved subset of Indian communities using technoeco-nomic analysis. The requirements estimation subsection synthesizes disparate sources of information to yield context-specific requirements. The technology performance estimation subsection uses similar types of information sources to quantify sanitation technology performance. 19
2-2 (Left) a city modeled as an area with constant (average) population density. (Right) a city of the same area and population modeled as smaller, discrete chunks of constant density that decrease exponentially as distance from the city center increases. Our model considers these “neighborhood-sized” chunks instead of a full city. . . 20
3-1 The sanitation service chain. While this graphic depicts a typical non-sewered system, the five processes are generally representative of all physical components of a sanitation system. Waste is captured via user interface at the household level, contained until it is conveyed to treatment where it is reused or disposed of. Three complete sanitation systems of different scale are listed with their common components. Adapted from“Sanitation Value Chain"by the Bill and Melinda Gates Foundation (BMGF) licensed under CC BY 2.0.
*These systems are user interface-agnostic but our model uses the ubiq-uitous squat pans
**Many treatment options exist. Often, these are combinations of technologies . . . 26
3-2 The total equivalent annual cost of the three modeled sanitation sys-tems as a function of population density. Pit latrines are an inexpen-sive option that is infeasible at population densities greater than 10000. Septic tanks are the second least costly option but are also infeasible at high population densities. Willingness to pay is plotted based on 5% of a 5th percentile person’s total yearly expenditure. Dotted lines are inclusive of land costs of the household part of the system. . . 33
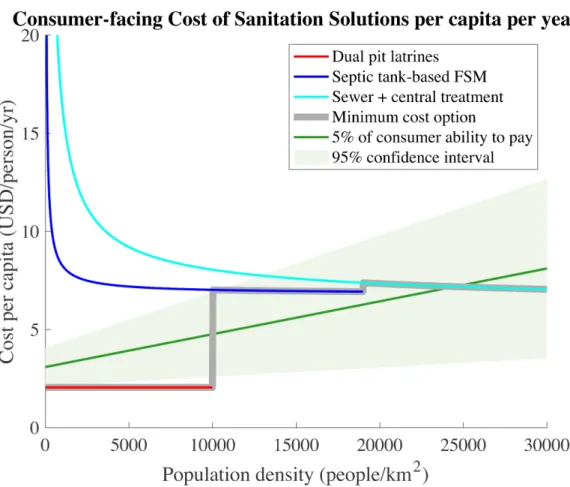
3-3 Consumer-facing costs of the three modeled sanitation systems assum-ing capital cost of centralized infrastructure is grant-funded (not passed on to the consumer). Willingness to pay is plotted based on 5% of a 5th percentile person’s total yearly expenditure. . . . . 35
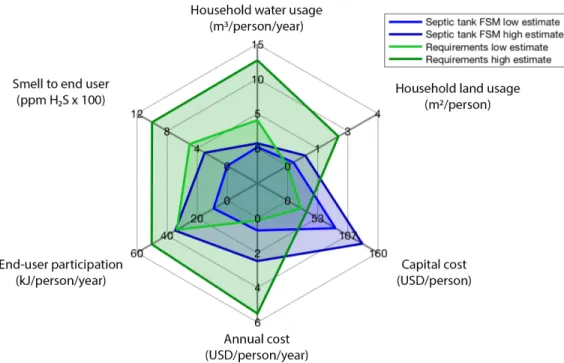
4-1 faecal sludge management-based sanitation system (blue) plotted against the requirements (green) of the “Rising Metro” city archetype. This system meets all requirements with the exception of the capital cost requirement. . . 41
A-2 Linear regression of sewer network cost and land area served. There is no significant correlation. Therefore, this variable was removed from our technoeconomic model.. . . 52
A-3 Regression of the sewage treatment plant unit costs as a function of total plant capacity. This regressed exponential is used in the technoe-conomic analysis for sewered systems. . . 54
A-4 Regression of the four FSTPs that treat both liquids and solids. . . . 56
A-5 A radial slice of the “volcano" shapes shown in 2-2. Each blue line is a different city. Red crosses represent the “rural" and “urban" population points of each city. . . 58
A-6 Land cost regression as a function of population density (𝑝𝑟𝑒𝑠ℎ𝑎𝑝𝑒
corresponds to land cost, 𝑑𝑟𝑒𝑠ℎ𝑎𝑝𝑒 corresponds to population density).
Each black dotted curve is a city. Some cities have overall higher prices (more desirable or higher-paying cities) while others are cheaper. One outlier that curves up has a very flat population density gradient (evenly-distributed population) but still has a steep land cost gradient (people still value land highly near the city center). the blue line represents the “average case" line that was used in the technoeconomic analysis’ land costs. . . 59
A-7 Data from the National Sample Survey 69th round split into population
density bins 500 wide. Available non-dwelling land (log 10) is plotted on the y-axis. The horizontal black line is the amount of land required for a pit latrine. For each bin, the median person in that population density is marked with a black line, top and bottom quartiles are marked with the whisker, and middle quartiles are marked with the box. Outliers are shown as black dots. Above about 9,500 people per sqkm, the sample sizes get smaller, as these densities are less common. Above about 10,000 people per sqkm, the downward trend of available land crosses over the amount of land required for a pit latrine. . . 60
List of Tables
3.1 Cost drivers of the technoeconomic model and their associated equations. 27
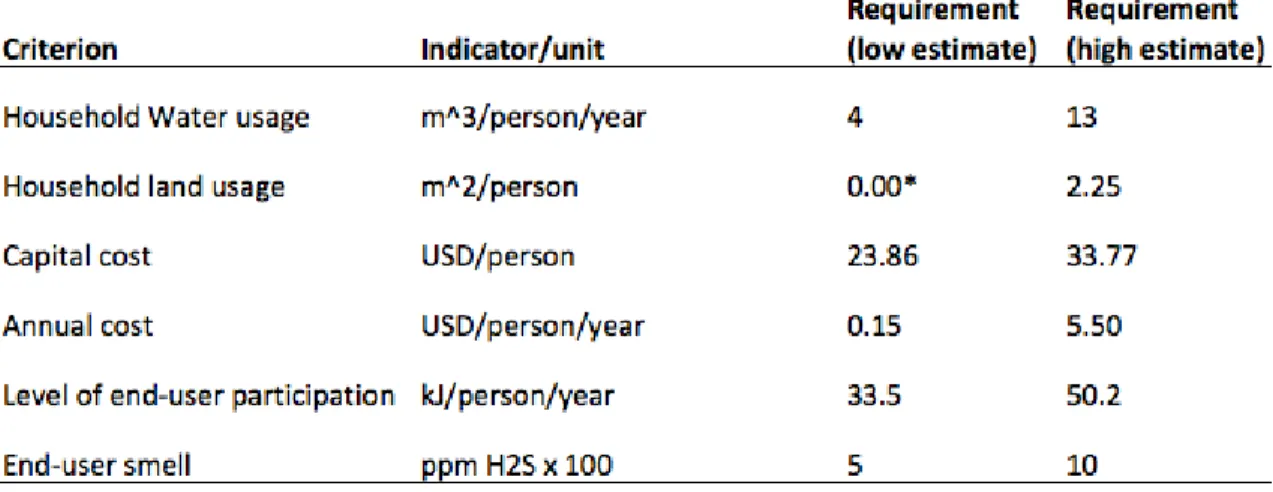
4.1 Quantifiable requirements of sustainable sanitation in upper-middle population density Indian communities
*This low estimate requirement signifies that the 5th percentile house-hold does not have any non-dwelling area . . . 40
A.1 Table of sewer network capital costs from Balaji et al. 2015. Data is supplemented by the city characteristics from the 2011 Government of India census. To explore possible correlation with area, sewerage coverage area is scaled to serve the entire city’s population. This allows us to use the city’s area as reported by the GoI census to see any correlation with sewer network area served. An "extrapolation ratio" calculated at right to show how much the city has been scaled. One city, Keeranur, was not considered because of a low extrapolation ratio possibly due to high growth between the 2011 census and the Balalji study. . . 50
A.2 Table of STP data from Pannirselvam et al. 2015. All STPs are based on the Activated Sludge Process. One very high-capacity STP and two large capacity STPs were excluded from the data set due to being outliers. There are factors that affect the cost of an STP other than capacity. In lieu of not having data on those other factors, the specific numbers here are limited to the STPs of Tamil Nadu from this single dataset. . . 53
A.3 Table of FSTPs from NIUA’s 2019 report on “Analysis of Faecal Sludge Treatment Plants in India". The report included eight FSTPs, four of which were liquid and solid treatment, four of which were liquid treatment only. For the liquids-only plants, solids are not fully treated (which also skews the cost of the FSTP downward). For our analysis, we only considered FSTPs capable of full treatment of both liquids and solids. . . 55
A.4 Land costs for the “highest zone" and “lowest zone" correspond with areas close to city center and farther from city center, respectively. Cost data from Chakravorty 2013 are fitted to the exponential model from Bertaud 2015 to yield a “land cost gradient" fitting parameter. Population density data from the GoI 2011 census provides “urban" and “rural" population densities for a given city. These data are then assumed to be correlated with the high and low zones from Chakra-vorty 2013’s analysis. These two points of reference form the basis for regressing the exponential functions described by Bertaud 2015 with fitting parameter “population density gradient". Some cities are re-moved because of lack of “rural" data in the census. . . 57
Chapter 1
Introduction
Worldwide, over two billion people lack access to at least basic sanitation [1]. The
World Health Organization (WHO) identifies India as a key country in need of safely-managed sanitation. Although India’s Swachh Bharat Mission reduced open defeca-tion by building over 100,000,000 toilets, making sanitadefeca-tion sustainable remains a
significant challenge [2, 3, 4]. There is no “one-size-fits-all” solution for the
sanita-tion difficulties that remain in such a widely-variable environment as India. The inter-connected challenges of economics, technology, culture, and politics, are often
considered separately which hinders the solution creation process [5].
Technoeconomic analyses are very effective at considering the financial feasibility of sanitation systems. High-level studies performed by the World Bank are excellent
at exploring the in-depth feasibility of a class of solutions at the country-level [6,7].
Stantec (2019) presents a detailed model-based analysis of eight different systems
through the lens of costs to a municipality [8]. Daudey (2018) performs a
compar-ative analysis on the life cycle costs of complete sanitation systems to reveal the
cheapest-per-capita solutions [9]. These financial analyses are effective for identifying
cost-related gaps in sanitation technologies and infrastructure but other aspects of sustainability must also be considered. Some technoeconomic analyses, like Kamble et al. (2019) extend their framework to one or more sustainability metrics through
the use of life cycle analysis (LCA) [10]. Although these LCA-type analyses are
often requires parsing disparate types of information.
Multi-criteria analyses (MCA) are effective multi-faceted approaches for parsing such disparate information. Hellström et al. (2004) propose a framework for such an analysis while Lennartsson et al. (2009), Salisbury et al. (2018), and Vidal et al. (2019) use similar frameworks to compare the sustainability of current sanitation
systems to each other within a particular context [11,12,13,14]. Bassan et al. (2015)
is the first known case of a quantitative MCA used in sanitation to judge deficiencies
in management and planning [15]. These analyses are able to identify an optimal
solution but, with the exception of the analysis done in Bassan et al. (2015), are unable to elucidate whether these sanitation solutions are “good enough” to meet the needs of the populations they serve. Identification of the gaps between current sanitation system performance and the requirements of the people most in need would lead to an effective prioritization path forward for technology and solution developers. We seek a generalizable, quantitative framework capable of identifying these gaps. This framework should be context-specific enough to elucidate meaningful deficien-cies while still being general enough to not require a detailed case study for each city considered. Using an MCA-like approach, the Sanitation Needs and Innovation (SaNI) framework uses technoeconomic analysis of common sanitation solutions, as functions of population density, to identify underserved populations. It then uses es-timates of technology performance along multiple quantitative sustainability criteria to assess whether the needs of the identified population are met. This allows identifi-cation – and quantifiidentifi-cation – of gaps between the performance of the most commonly-implemented sanitation systems and requirements of this fairly well-defined – yet still general – underserved market segment.
Chapter 2
Presentation of the SaNI framework
The goal of this work is to create a framework capable of identifying how existing technologies do not meet key, quantitative needs of high-risk Indian populations. The incredible cultural and geographical diversity of India necessitates a coarse analysis of which populations are most able to benefit from improved sanitation. To do this,
the framework, shown in Fig. 2-1, first identifies an underserved population based on
the financial feasibility of existing sanitation systems. This context is then further defined by examining what types of communities contain these populations and what business models are most prevalent within those institutional capacities.
Within this context, sustainable sanitation criteria can be selected from a list of candidate criteria proposed by other multi-criteria analyses like Lennartsson et al.
(2009) and Salisbury et al. (2018) [12, 13]. Because this framework is based on
quantifying needs, only quantifiable and measurable sustainable sanitation criteria are selected. Context-specific requirements are then estimated by aggregating expert opinion, academic publications, grey literature, and field observations. Technology performance estimation is performed in a similar fashion by taking a subset of existing sanitation technology systems for evaluation, breaking them down to the sub-system level (where manufacturer specifications are available), and summing system compo-nent contributions to obtain total system performance. Comparison of these context-specific requirements to the estimated sanitation technology performance yields quan-titative gaps between these two quantities along each chosen sustainable sanitation
criterion.
2.1
Context definition
For the purposes of the initial coarse scoping analysis, we focus on using simple sanitation system scaling relationships to evaluate the economic feasibility of sanitation as a function of population density. This high-level technoeconomic anal-ysis yields underserved population densities by modeling archetypal sanitation technology systems, for example, sewered conveyance to centralized treatment or completely on-site sanitation.
Dalberg Advisors (2018) identified that the overall feasibility of sanitation sys-tems relies primarily on four variables (population, topography, aridity, and enabling
ecosystem) of which population is the most important [16]. In the SaNI framework,
we identify high risk populations by their population density rather than total pop-ulation. Population density, total population and catchment area are all popular coarse ways of describing cities, towns and villages. Since processes like treatment are easy to think of in terms of their capacity, which is driven by the total population of the service area, a popular choice for executing a technoeconomic analysis is using population as the primary independent variable. A detailed analysis done by Stantec (2019) uses total population in this way but simulates an average population density that changes with population based on the city classes defined by the Central Public
Health and Environmental Engineering Organisation (CPHEEO) [8]. This approach
is effective if you consider the city to be homogenous but it is often the case that a single sanitation system is not uniformly economical over the whole city. For example,
many Indian cities with sewerage have FSM toward the outskirts [17].
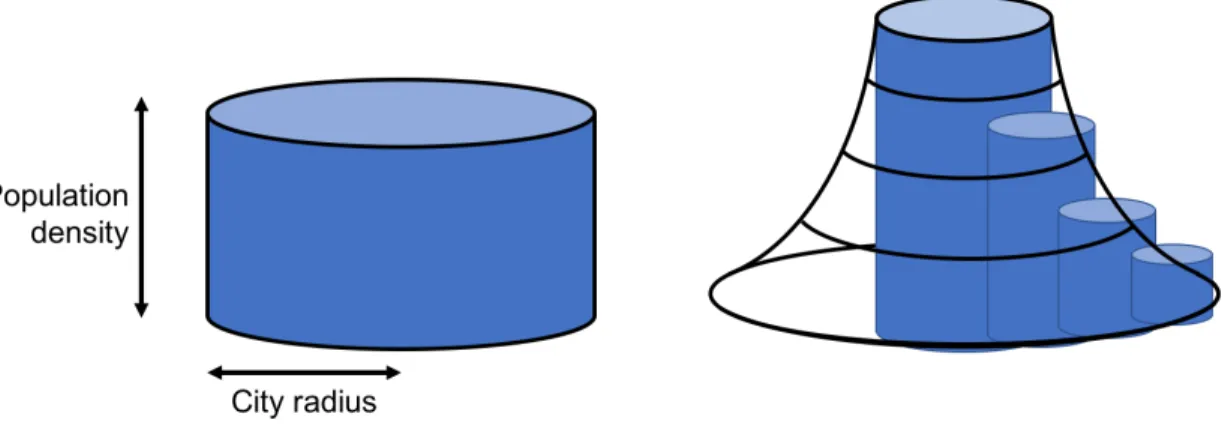
If a city is considered as an average, uniform population density, it is modeled as
in Fig. 2-2 (left) where the total population is the volume of the cylinder. Inspired
by Bettencourt et al. (2013), we instead consider the same city, but modeled as exponentially decreasing population density with distance from the city center (Fig.
Figure 2-1: Process diagram of the SaNI framework for determining gaps between sanitation technology performance and the requirements of context-specific sustain-able sanitation. The context definition subsection identifies an underserved subset of Indian communities using technoeconomic analysis. The requirements estimation subsection synthesizes disparate sources of information to yield context-specific re-quirements. The technology performance estimation subsection uses similar types of information sources to quantify sanitation technology performance.
Figure 2-2: (Left) a city modeled as an area with constant (average) population density. (Right) a city of the same area and population modeled as smaller, discrete chunks of constant density that decrease exponentially as distance from the city center increases. Our model considers these “neighborhood-sized” chunks instead of a full city.
sized step outward density decreases. These smaller, neighborhood-sized chunks of a particular density can occur near the edges of large cities, or the centers of small cities. Using population density as the primary independent variable in our analysis allows the results to be generalized to a range of city archetypes.
Once population densities with the greatest gaps between cost of sanitation and ability to finance it have been identified, city classes containing those densities are characterized by “city archetype” like those presented by Dalberg Advisors (2018)
[16]. Each of these city archetypes will have differing institutional and infrastructural
factors that affect the feasibility of certain sanitation solutions in them (i.e. exist-ing infrastructure, end-user ability to pay, and institutional ability to secure capital). These factors will also affect which business/service models are feasible. The require-ments specified and the system performance evaluated are done so through the chosen business model(s) and city archetypes.
2.2
Requirements estimation
While the context definition identifies a financial gap, sustainable sanitation requires much more than just economic feasibility. The goal of this subsection of the framework
is to define measurable criteria along which a sanitation system should be evaluated and its corresponding requirements for sustainability. Salisbury et al. (2018) and Lennartsson et al. (2009) present a compendious list of such criteria and factors that
may affect their relevance to certain contexts[13, 12]. To clearly identify a
sanita-tion gap, our analysis focuses on quantitative metrics of sustainability. Furthermore, quantitative metrics should also be measurable and data available. Using our context definition and understanding of the city archetypes, we are also able to filter out met-rics that are always met in the chosen context. For example, it may be that energy use is a quantitative, measurable criterion for sustainable sanitation but grid power is widely and consistently available in a city of the chosen archetype; thus, lack of electricity is extremely unlikely to cause the sanitation system to fail. It should be noted that this filtering process removes many important factors of successful, sus-tainable sanitation that are hard to quantify or difficult to measure. Because of this, criteria and requirements presented in this framework are necessary, but not sufficient for sustainable sanitation.
Household water usage is a key constraint in sustainable sanitation systems
-especially as water stress becomes greater [18]. This requirement could be thought
of as a sustainability metric where the system boundary is drawn at the water table (requirement based on water recharge rate) or where system boundary is drawn at the municipal level (requirement based on supply). Basing the requirement on ground-water recharge rate would be a better absolute maximum in terms of environmental sustainability but basing it on supply capacity takes economic water scarcity into ac-count as well. A more complete measure of this requirement would be the minimum of these two definitions. Due to lack of available high-detail groundwater recharge rates, our estimation uses the municipal level water availability minus drinking water provision to calculate an absolute maximum on water per person per unit time.
Household land usage is a prime determinant of on-site sanitation feasibility. In this case, we examine the ability for OSS to exist on the land allocated to the household (owned or rented). The area must be accessible, which means that land with a structure on it is assumed off-limits. This requirement is estimated based
on ability rather than willingness since we were unable to quantify the amount of available land a household is willing to allocate for sanitation.
Capital cost is important for determining the community-scale affordability of the system. Regardless of how the systems are financed, each community has a capac-ity to acquire capital for sanitation. In India, capital cost is often financed externally as a lump sum (from the central government or a non-governmental organization (NGO)). Our estimation uses central government grant history to municipalities to define this requirement.
Annual cost is important for the financial sustainability of the system. In many cases, the annual costs that are paid for the upkeep of the system ultimately come from the citizens it serves. Whether it is a direct payment (sanitation tax), or
municipality-sponsored (cross subsidized), the end-users are paying ([6]. Willingness to pay (WTP)
is a function of what end-users are paying for and perceived value gained, so this
metric is highly variable across different financing models ([19]. Instead, our analysis
considers maximum ability to pay by examining household expenditure.
End-user participation is a requirement based on how much physical labor end-users will tolerate for sanitation. People will tolerate some actions (such as routine
cleaning) at some frequency but not others (like hauling treated compost). The
end-user participation metric is the product of the work the end-user does (energy measured in kJ) for sanitation normalized per time per person. We estimate this requirement based on willingness, not physical ability.
Smell to end-user is a requirement based on ensuring the usability of a system.
Smell is often cited as one of the main reasons for not using a toilet [20,21]. If a user
does not opt to use the system, it does not matter how “sustainable” it is. It does not achieve its goal.
2.3
Technology performance estimation
This framework does not require that a particular set of sanitation technology sys-tems be considered. As long as the performance of the system can be quantified, it is
applicable within this framework. This makes analysis of widely-used, experimental, and theoretical systems all possible. Systems that are feasible for the underserved context identified should be selected for analysis. Much like the requirements, tech-nology performance is estimated from the aggregation of the same types of published sources, field observation and technical specifications of sanitation systems and sys-tem components. Data sources vary widely depending on the performance criterion being estimated and the system it is being estimated for. Frequently, it is convenient to split up systems or sub-systems into smaller components. Tilley (2014) provides an excellent framework for considering the linking of sanitation sub-components. How-ever, thinking about sanitation components as defined by Tilley (2014) is difficult
when using real data on integrated systems like treatment plants [20]. These plants
are often comprised of several different treatment subsystems, all using different tech-nologies appropriate for that stage of the process. For example, if data on capital cost of a full treatment plant is available, and that plant uses three different treatment technologies, it is hard to attribute cost to each of these subsystems. This precise process for how to approximate this attribution is described in more detail in Chapter
Chapter 3
Identifying a sanitation service gap in
India
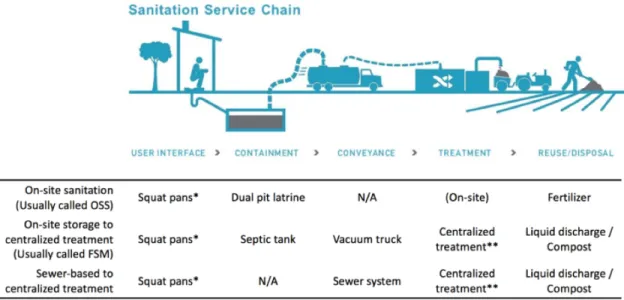
To identify potential gap in sanitation service, we used the framework to perform a technoeconomic analysis of common sanitation systems. This analysis determined which types of Indian population centers are likely to be underserved by modeling equivalent annual cost of three common sanitation systems, as a function of popula-tion density, and comparing them to consumer willingness and ability to pay. These full systems are each broken down into the five main components of the general-ized sanitation value chain: user interface, containment, conveyance, treatment and
reuse/disposal, as defined by Tilley et al. (2014) [20]. The three systems used in the
analysis were: (1) sewer-based, centralized municipal sanitation; (2) on-site sanitation to centralized treatment (faecal sludge management, or FSM); and (3) dual pit latrine on-site sanitation (OSS) (Fig. 3). These three solutions were chosen for evaluation because they represent different balances between household and municipal infras-tructural responsibility. In OSS, the household is primarily (or solely) responsible for the system, while in sewer-based, centralized treatment the municipality is primarily responsible for the system infrastructure and maintaining service. The FSM-based system represents a middle-ground of shared responsibility between these two solu-tions. This responsibility is apparent in the components one could expect to see in
on-Figure 3-1: The sanitation service chain. While this graphic depicts a typical non-sewered system, the five processes are generally representative of all physical compo-nents of a sanitation system. Waste is captured via user interface at the household level, contained until it is conveyed to treatment where it is reused or disposed of. Three complete sanitation systems of different scale are listed with their common
components. Adapted from “Sanitation Value Chain"by the Bill and Melinda Gates
Foundation (BMGF) licensed under CC BY 2.0.
*These systems are user interface-agnostic but our model uses the ubiquitous squat pans
**Many treatment options exist. Often, these are combinations of technologies
site there is no conveyance or reliance on central treatment. In both FSM-based and sewer-based systems the treatment options are widely-varied and a typical treatment system is made of many treatment steps for both liquids and solids. In sewer-based systems, sewage is conveyed directly from the user interface to the treatment plant so household-side containment is not necessary.
3.1
Construction of the technoeconomic model
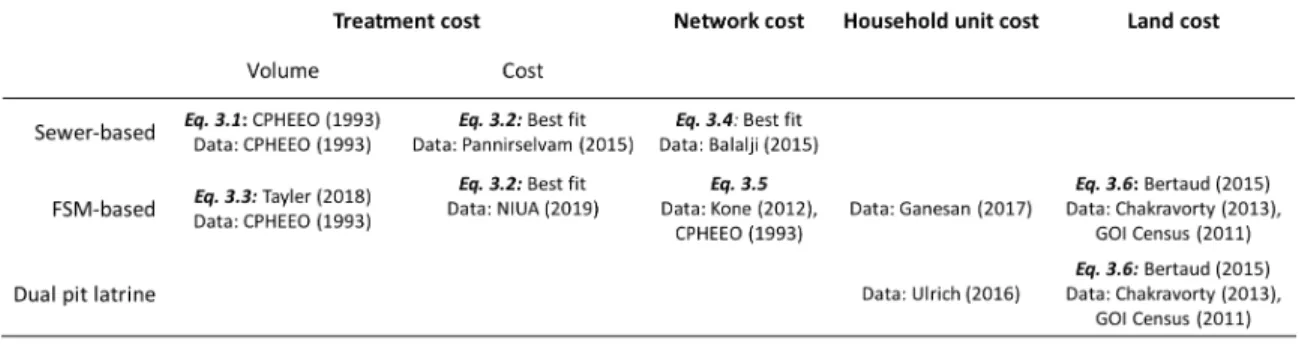
To capture the scaling relationships between these three systems, we modeled capital and annual costs dependent on four major types of population density-dependent cost
drivers: treatment cost, network cost, household unit cost, and land cost. Table 3.1
Table 3.1: Cost drivers of the technoeconomic model and their associated equations.
data sources from which the relationships were derived. The Central Public Health & Environmental Engineering Organization (CPHEEO) is a technical wing of Ministry of Housing and Urban Affairs, Government of India, and publishes guidelines on the engineering of sewerage and sewage treatment systems.
In each case, it was assumed that population is uniformly distributed over a
neighborhood-sized area, rather than a city-sized one (as described in Fig. 3-1).
Furthermore, each system considered was assumed to be the only sanitation system implemented and reaches 100% of households. Each cost driver is described in turn below. For each cost driver, 𝑉 denotes volume delivered to a treatment plant, 𝑃 denotes the total population served, 𝐶 denotes capital cost, and 𝐴 denotes an annual cost.
Treatment cost includes both the capital and annual costs incurred by treating sewage or septage at a centralized treatment plant. Capital costs include the construc-tion costs of the plant, and annual costs are inclusive of operaconstruc-tion and maintenance costs. Both of these costs scale primarily with the volume treated. For the sewage treatment plant (STP), our model assumes that volume delivered to the treatment
plant is given by CPHEEO (1993) [22],
𝑉 = 0.8𝑉𝑠𝑢𝑝𝑝𝑙𝑦𝑃, (3.1)
and assumes that 𝑉𝑠𝑢𝑝𝑝𝑙𝑦 is 100 L/capita/day for a piped domestic water supply as
Pannirselvam (2015) and is given by
𝐶𝑡𝑟𝑒𝑎𝑡= 𝑉 𝑎𝑃𝑏, (3.2)
where 𝑎 and 𝑏 are regression constants [24]. The plants included in the dataset are all
in Tamil Nadu and based on the activated sludge process, which is common in India. Annual cost for the STP is estimated to be 10% of the built system’s capital cost based on Faecal Sludge Treatment Plant (FSTP) annual and capital cost data from
NIUA (2019) [25]. While this estimate is not for the same type of treatment plant, it
is consistent with annual cost to capital cost ratios of centralized sewage treatment
infrastructure [26].
For septic tanks, the volume of liquid waste produced is estimated following Tayler (2018) as
𝑉 = 𝑁 𝑣𝑡𝑐𝑡
𝑇 , (3.3)
where 𝑉 is the volume delivered to the treatment plant in m3/year, 𝑁 is the number
of pits and tanks in the service area, 𝑣𝑡 is the average tank capacity in m3, 𝑐𝑡 is
the proportion of pits that are regularly desludged (assumed to be 1), and 𝑇 is the
average interval between tank desludging in years [27]. The septic tank sizing, 𝑣𝑡,
was calculated assuming only discharge from the water closet (excluding domestic wastewater) using septic tank sizing guidance from CPHEEO (1993). This analysis
assumes 𝑇 is 3 years as recommended in CPHEEO (1993) [22].
Septage (faecal sludge) treatment cost is regressed from a limited set of four full
liquids and solids treatment FSTPs across India (NIUA 2019) [25]. The cost
rela-tionship between capital cost and annual cost follows the same form as Eq. 3.2 with
different regression constants.
Network cost includes both the capital and annual costs of conveyance from the household to the treatment plant. Capital cost of the sewer network is defined primarily by the amount of linear sewer length and associated pumping stations the network requires. This model assumes service areas do not have significant elevation
change. Downward slope to the STP decreases the number of pumping stations required while an upward slope increases it. Given these two competing factors, and lacking any topographical specificity, a flat service area is assumed to be a good average case. Our model used the constructed costs of 33 sewer networks in Tamil Nadu from Balaji 2015 to regress the following relationship between population served
and total sewer network capital cost [28],
𝐶𝑛𝑒𝑡𝑤𝑜𝑟𝑘 = 𝑎𝑃 + 𝑏. (3.4)
Intuitively, both population and land area should be correlated with sewer network capital cost but there was no significant correlation in this dataset (see supplemental information for details). Annual cost required to upkeep the network was taken to be
approximately 5% of the capital cost in the case of a conventional sewer network [26].
This exact percentage will be different for India due to different labor and material costs, but the conveyance technology is the same, so it is assumed suitable for the coarse analysis performed here.
The FSM network cost is driven by the number of trucks and operators required to keep up conveyance. The relationship derived from values presented in Chowdry et al. (2012) yields
𝐶𝑛𝑒𝑡𝑤𝑜𝑟𝑘 =
𝐶𝑡𝑟𝑢𝑐𝑘
𝑘 𝑃, (3.5)
where 𝑘 is a service population of 25,000 people per truck, assuming Indian emptying
frequencies, and a standard 2.5 – 5 m3 capacity truck. 𝐶
𝑡𝑟𝑢𝑐𝑘 is the unit cost of a
truck ($10,000 USD per truck) [29]. Annual cost is driven by operator wages,
main-tenance, and other fees. Assuming profit margin is 30% of the total emptying fee for
an on-demand desludging schedule ([29]), an average cost of 1000 INR per desludging
([30]) yields an average cost of 700 INR per desludging. Using the 3-year desludging
frequency recommended in CPHEEO (1993), the total annual cost is the total
num-ber of households multiplied by desludging frequency and cost per desludging [22].
to geography- and city-specific factors. However, they are sufficient to highlight cost trends across a range of population densities and identify high-level coverage gaps.
Household unit cost is the cost of household capture and containment systems such as a pit latrine. Ganesan et al. (2017) reports a range of 25,000 – 40,000 INR per constructed septic tank across eight different states, which is consistent with the
authors’ field observations in Maharashtra and Gujarat [31]. Unit cost of a pit latrine
is around $184 USD but depends on the cost of locally-available materials [32]. The
cost of the plumbing of a water closet is assumed to be included in the network cost and the cost of the user interface is assumed to be negligible.
Land cost of the system is only the cost of land used for the on-site units. Since municipalities often already have land procured or tend to put treatment facilities on undesirable plots, land usage of municipal systems is not considered. In this model, land cost is accounted for in one of two ways: (1) as a soft constraint where it is added to the total cost of the system or, (2) as a hard constraint where it is not added to total cost but systems are not modeled above population densities that make them infeasible. This infeasibility is based on the ability for an OSS to fit in the total land area allocated to the household minus the area of the dwelling. The equation for the cost of land used in the soft constraint is derived from the land cost and population density relationships given by Bertaud and Malpezzi (2003) with data
from Chakravorty (2013) and the Government of India census (2011) [33,34,35]. The
resultant land cost relationship is
𝐶𝑙𝑎𝑛𝑑 = 𝑎𝐷𝑏, (3.6)
where 𝐷 is the population density and 𝑎 and 𝑏 are regression constants. For more information, see the supplemental information.
When considering the overall cost of a system with several hardware components
of different service lives, it is common to normalize them by amortization [8, 36].
An equivalent annual cost of each hardware subsystem considered in this analysis is calculated using
𝐸𝐴𝐶 = 𝐶 (1 + 𝑖)
𝑛* 𝑖
(1 + 𝑖)𝑛− 1+ 𝐴, (3.7)
where 𝐸𝐴𝐶 is the equivalent annual cost of the amortized system, 𝐶 is its capital cost, 𝑛 is its service life, 𝑖 is the real interest rate, and 𝐴 is the annual cost (including maintenance, operations, etc.). The real interest rate, 𝑖, is an adjusted interest rate equal to a nominal, reported interest rate minus inflation. In our analysis, we assumed this real interest rate is 5%.
To elucidate possible financial gaps, cost of sanitation was compared to the
end-user’s willingness to pay. Similar to the requirements discussed in Chapter 2, this
point of comparison could be quantified using either ability or willingness to pay. Due to the lack of generalizable population density-correlated willingness to pay data, we used expenditure as a proxy for ability to pay. Household expenditure is used as an estimate of true ability to pay instead of income to discount income that goes toward savings. Household expenditure data is from the Indian National Sample Survey
Organisation’s NSS 69th round [37]. Data from the NSS 72nd round further breaks
down expenditures showing that urban households spend an average of 0.21% of
their budget on “sewage disposal & sanitation” [38]. Because this amount consumers
currently pay may not be an accurate maximum for what they are willing to pay, for the remainder of the analysis, we considered the hypothetical that consumers are willing to pay up to 5% of the total expenditure (though it is a high upper bound).
A successful sanitation system must “ensure access to water and sanitation for
all” [39]. In the context of this economic analysis, it means that a solution should
be financially feasible for every household, not just those wealthy enough to access services. To represent this equity requirement, household expenditures are grouped into population density ranges with a distribution of expenditures for each range. In an effort to make our analysis a reflection of this equity goal, our “ability to pay” is
specified by the 5th percentile household of each of these bins. For more information,
3.2
The missing middle in sanitation technologies
The equivalent annual costs of each sanitation technology system were compared to consumer ability to pay to yield population densities where sanitation costs may
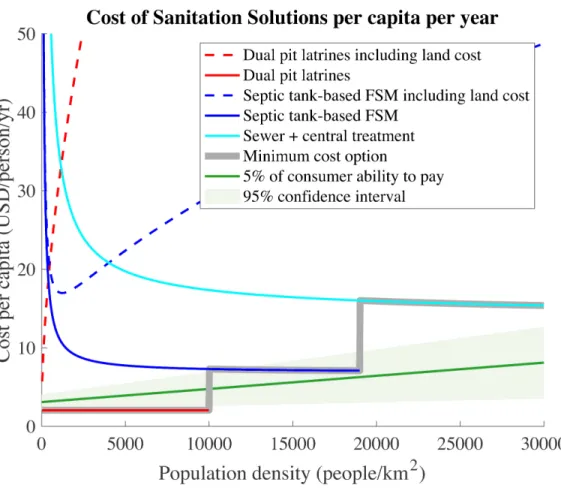
be greater than the consumer’s willingness to pay. Fig. 3-2 illustrates the cost
of the three modeled sanitation systems as functions of population density. Unmet sanitation needs occur where the least-cost solution exceeds the consumer’s willingness to pay, characterized by the green line. The most cost feasible option of these three is the dual pit latrine, which remains a viable option up to population densities of
10,000 people per km2, where it becomes infeasible to build due to the available land
per household. Household septic tanks become equally infeasible for similar reasons
above 18,000 people per km2. This means that at very high population densities, the
only feasible solution of these three classes is the sewer-based system. This line does decrease with population density, though it is still more expensive than the others overall.
Land cost modeled (included as dashed lines in Fig. 3-2) is not explicitly paid by
households but is representative of the opportunity cost of what could have otherwise
been done with the land. This method of accounting for land is not financially
accurate (no Indian households pay such an inflated price for OSS since they already have the land) but is illustrative the tradeoff a household must make when considering what to do with the land area they have.
Compared to the fully model-based approach taken by Stantec 2019, our model outputs higher costs for both the septic tank-based FSM and sewer-based systems
(Dual pit latrines were not modeled in their analysis) [8]. For the septic tank-based
system, this cost difference can be attributed primarily to the difference in the system boundary considered. Our system factors in the household costs of user interface and containment while the Stantec 2019 approach excludes these costs for the purposes of focusing on costs to a municipality. Stantec’s model is a least-cost scenario that does not include secondary site infrastructure at the STP or FSTP such as roads, office, and other costs not directly associated with the physical treatment process. Our costing
Figure 3-2: The total equivalent annual cost of the three modeled sanitation systems as a function of population density. Pit latrines are an inexpensive option that is infeasible at population densities greater than 10000. Septic tanks are the second least costly option but are also infeasible at high population densities. Willingness
to pay is plotted based on 5% of a 5th percentile person’s total yearly expenditure.
process implicitly includes costs such as these because our models were regressed from real data on built costs that do include this secondary infrastructure. Stantec estimates that these secondary infrastructure costs could be up to an additional 50
- 100% of total capital cost [8]. This is consistent with the discrepancy between
their and our modeled results. It should also be noted that the sewer networks
from Balaji 2015 are all smaller sewers of up to about 3,500 people/km2 [28]. The
regressed model was confirmed to correlate with costs from the Tamil Nadu Water
Supply and Drainage (TWAD) Board for populations up to about 10,000 people/km2.
Beyond that, our model extrapolates the established trend in sewer network cost with increasing population served.
Because our analysis is in the generalized population density space, these high-risk population densities are not cities themselves but are neighborhoods that can occur
in many city types. These regions in the 10,000+ people/km2 range fit within two
largest city archetypes proposed by the Sanitation Technology Program (STeP): the
“Sprawling Megacity” and “Rising Metro” [16].
These city archetypes are classified by total population, existing sewerage, abil-ity to secure financial capital, topography, and whether the cabil-ity/town has a special sanitation-related focus. For demonstration of the framework, we focus on one sam-ple case in the “Rising Metro” city archetype. Cities of this type have population between 1 and 8 million people, more than 40% existing sewerage, and an expanding periphery, which is likely to remain unsewered for the near future. The ability to secure finance in these cities is high due to their high total population.
These cities are predominantly funded by central government and donor-led busi-ness models which enables sanitation systems that would otherwise be financially
infeasible, such as in the JNNURM or AMRUT missions [40, 41]. Because of its
re-liance on external charitable funding, this business model is not sustainable, nor is it
scalable [42]. A commonly-implemented version of this model utilizes these donated
funds to construct, but not operate the sanitation system. Once constructed, busi-ness operations of the system could be managed by the municipality itself or handed
Figure 3-3: Consumer-facing costs of the three modeled sanitation systems assuming capital cost of centralized infrastructure is grant-funded (not passed on to the
con-sumer). Willingness to pay is plotted based on 5% of a 5th percentile person’s total
yearly expenditure.
SaNI framework, we assume this most prevalent business model: capital costs of the centralized infrastructure are grant-funded and operational expenses are recouped
through consumer expenditure. Fig. 3-3 shows the same population density space as
figure3-2, but with only the consumer-facing costs of the systems given the assumed
business model.
Even with grant-funded capital, consumer costs are still high enough to produce unmet need. Since the costs of these sanitation systems are much higher than the 0.21% of household expenditure that people reported to pay for sanitation services (NSSO 2016) we can conclude that sanitation services operate with significant
sub-sidies [38]. Cross subsidy, commonly through property tax, is a popular method for
consumers are willing to pay more than they are currently paying. In Fig. 5, the hypothetical 5% of consumer expenditure shows that at this (very high) rate, the
me-dian consumer is able to cover their share of the sanitation cost but the 5th percentile
person is not. These 5th percentile households living between 10,000 people/km2 and
about 24,000 people/km2 inhabit a gap in sanitation service. These households at
the upper-medium population densities are at higher risk for having no cost-feasible, equitable sanitation solution.
Using the SaNI framework provided a simple way to elucidate this market gap and quantify why it exists. Each piece that went into the framework aligns with what is expected: on-site sanitation is infeasible when land becomes scarce, centralized systems get cheaper per capita as they get larger, and people are not willing to pay enough to cover the complete costs of sanitation. With these pieces quantitatively defined and combined – even with simple scaling relationships – there are clear gaps between what people require of the system and what the system requires of them.
Chapter 4
Test case: Evaluation of an
FSM-based system
The goal of this analysis was to determine the performance gap between what cur-rent sanitation solutions can provide and what the needs of the “Rising Metro” city, contingent to a donor-sponsored business model are. Given the high-risk context of
low-income households at the population densities of 10,000 people/km2 to 24,000
people/km2 and the sustainable sanitation criteria chosen in the Chapter 2, the
re-quirements for sanitation technology performance could be estimated. To illustrate how the SaNI framework is used to evaluate candidate solutions against requirements, we analyze an FSM-based system within the “Rising Metro” city.
4.1
Requirements estimation
Each requirement estimate belongs to one of two categories: physical possibility or realistic capability. Physical possibility indicates a fundamental resource constraint. For example, in water usage, the absolute maximum quantity that may be available for sanitation is the volume of water extracted minus the volume of drinking water
consumed. While this estimate is unrealistic due to uses other than drinking or
sanitation, it is still a useful upper-bound. A more accurate, albeit harder to measure bound is one specified by realistic capability. For water usage, this would likely take
the form of surveying constituents of the target populations to quantify how much water they would be willing to expend for sanitation. This is the effect of ability versus willingness to expend a resource for sanitation. Notably, willingness can be changed with improved service, marketing or education (like in community-led total sanitation or CLTS) while ability cannot. Whenever possible, we try to capture willingness in our requirements but when infeasible, we instead capture ability.
The household water usage requirement is estimated assuming water supply capacity is the limiting factor (not ground water recharge rate). Using the reasoning
put forth in the Chapter2, we find “Rising Metro” archetype cities supply between 70
and 135 L per capita per day (LPCD) [35]. According to Shaban (2007), these cities
use 15.9% to 25.7% of total water use for sanitation [43]. Assuming the remainder of
the supplied water must be used for higher-value uses, this puts an upper bound on how much water could possibly be used for sanitation.
The household land usage requirement is estimated using the assumptions and
reasoning in the Chapter 2 section. Data from the NSS 69th round and 2011 Census
show the 5th percentile household in the high-risk population density range has up to
2.25 m2per person of non-dwelling land that could possibly house an on-site sanitation
system. Many of the households do not have any non-dwelling land which is reflective of the constraints of the high-density urban environment.
The capital cost requirement for this context is the average capital local govern-ments were able to secure from the central government for sanitation projects. The
average and 75th percentile are used as “maximum bounds” since cities with a special
sanitation focus are shown to be outliers. If an average city of this type wants to build sanitation infrastructure, there is a high probability that it will be able to secure an average amount, but it is far from guaranteed that every city could reach the high points that the outliers can.
The annual cost requirement is estimated as outlined in the Chapter 2. The
business model assumed relies on the citizens financing this part of the system so it is directly-comparable to the ability to pay. This quantification is done similarly to the willingness to pay, where household expenditure data are taken from the NSS
69th round. Similarly, this annual cost requirement is imposed by the 5th percentile household expenditure for population densities that span the high-risk city archetype. The level of end-user participation requirement is estimated based on data gathered on willingness to participate in the household recycling process, which is a process similar in nature to the process of household sanitation maintenance tasks
[44]. This provides an amount of time the task takes and the frequency of the task.
Our analysis weights tasks differently by considering how strenuous they are. Human
power expenditure for a wide variety of tasks is given in Ainsworth (1993) [45]. The
product of power expenditure and time spent participating in maintenance of the system gives the physical work (in kJ) per person per year to keep the sanitation system functional.
The end-user smell does not have a resource constrained “physical limitation” on how much a system can smell, but we instead use published data on what smell level of certain “sanitation smells” users are willing to tolerate. In this case, the measured
“sanitation smell” is Hydrogen Sulfide, H2S, chosen for its simple detectability [46].
According to the World Health Organization (2000), for H2S, 0.1 ppm is the thresh-old for avoiding annoyance over a prolonged, 24-hour exposure. The threshthresh-old for “substantial complaints about odour annoyance” is 0.05 ppm over a period of thirty minutes.
The six requirements of sustainable sanitation for the 5th percentile and median
households in the “Rising Metro” city are summarized in Table 4.1.
4.2
Sanitation technology performance estimation
When evaluating potential sanitation solutions using the SaNI framework, it is as-sumed that all sanitation systems provide adequate protection of human and envi-ronmental health (high enough service level) and that systems are 100% functional and properly-maintained.
Technology performance estimation is done on the subsystem level. This is con-venient because subsystems are often specified as single units (like the user interface
Table 4.1: Quantifiable requirements of sustainable sanitation in upper-middle pop-ulation density Indian communities
*This low estimate requirement signifies that the 5th percentile household does not
have any non-dwelling area
component). However, even when they are not (for example, when the total cost of a treatment plant is given but it contains multiple different technologies) approximate general cost breakdown percentages can be gleaned from built systems with an associ-ated cost breakdown. We assume that full technology systems of the same type have a similar cost breakdown. This allows us to use the same percentages to estimate cost breakdowns for other built systems (from government tenders and other published figures) that only have total system costs. For the other, non-cost, system perfor-mance metrics we use the same process where data are available. When unavailable, we use the cost percentages as a proxy for the percentage-wise contributions of each subsystem to the total. This enables us to mix and match compatible subsystems to quickly explore the effects of many combinations of sanitation solutions.
4.3
Example results for an FSM-based system
The six requirements in Table 4.1 are plotted against the performance of an
FSM-based system on a six-pointed radar plot (Fig. 4-1). An FSM-based system was used
Figure 4-1: faecal sludge management-based sanitation system (blue) plotted against the requirements (green) of the “Rising Metro” city archetype. This system meets all requirements with the exception of the capital cost requirement.
the technoeconomic analysis. This graphical depiction allows us to easily gauge the performance of the technology system relative to the requirements along each of the criteria.
The FSM-based systems plotted in blue in Fig. 4-1 tend to satisfy the quantified
sustainable sanitation requirements of the “Rising Metro” city archetype. When both the high and low performance estimates lie inside both of the requirement estimates, we can have high confidence that the requirement is met. Likewise, if both perfor-mance bounds lie outside the requirements, then the requirement is very likely not met. It is unsurprising that the solution violates at least one of the cost requirements (capital cost) since the cost of this sanitation technology was higher than willingness to pay in the techno-economic analysis.
The goal of this part of the SaNI framework is to determine what aspects of the chosen sanitation systems need to be improved, and by how much. A traditional MCA used to pick the best solution for a given context relies on weighing the criteria
used for analysis. In this case, because the goal is sustainable, equitable sanitation, meeting every is necessary. It is therefore not useful to measure which are more important. They must all be met. However, because this analysis is quantitative, we are able to estimate how much a system would have to improve along the unsatisfied criteria to meet the requirements.
In this sample analysis, the lower limits of household land and annual cost are zero and nearly zero, respectively. From this, we can posit that septic tank-based FSM systems are largely feasible in the “Rising Metro” city (also evidenced by their existence) but present two challenges: (1) annual cost is still too high to meet en-sure equitable service and (2) there is some fraction of the population (greater than 5%) that simply cannot have a system that takes up permanent area outside the household. We also see that the capital cost is higher than even the median person’s willingness to pay. This is just one example of how the SaNI framework can be ap-plied. One could imagine that if this same analysis was done on a sanitation system that was not as ubiquitous, different requirements may have been violated, therefore highlighting different areas of opportunity for improvement of that technology sys-tem. Furthermore, as long as requirements and sanitation technology performance can be quantified, they can be included in the gap analysis. The SaNI framework could also serve as a first-order feasibility assessment for solutions that have not yet been tested in the field.
Chapter 5
Discussion and implications
The SaNI framework is built to identify tangible ways to improve sanitation technol-ogy systems relative to the requirements imposed by a context of greatest financial need. Bassan (2015) presented a framework motivated by similar goals to uncover
deficiencies on the management and operations side of sanitation systems [15]. The
SaNI framework fills a comparable role but for the technologies themselves. This enables the identification of quantified ways in which sanitation technology systems can be improved to better-meet the needs of whichever underserved market segment is identified by the framework (in this case, upper-medium population densities in the “Rising Metro”). In the chosen sample case, our framework identifies that upper-medium scale population densities do not necessarily have access to sanitation that meets their financial needs. The quantitative performance-requirements analysis done for this underserved region found that an FSM-based example system falls short of meeting the land area, annual cost and capital cost requirements of households who have the least.
The SaNI framework accomplishes this by defining an underserved context based on population density, the prime driver of sanitation technology scaling. This way of segmenting the solution space is specific enough to use a multi-criteria-like approach, while being general enough to be applicable outside a single city. The simple process for estimating community requirements and sanitation system performance is capable of identifying non-financial deficiencies in these systems. This ultimately leads to
areas of opportunity for technology development. This same framework could also be applied to theoretical sanitation solutions with hypothetical scenarios to serve as a first-order test for feasibility across a few necessary sustainability criteria.
One limitation of the framework is that it focuses on quantifiable sustainable sanitation criteria. There are likely many other less-quantifiable metrics that are equally, if not more, important for determining the overall sustainability of a system. System complexity is one such example of a metric that is not sufficiently quantifiable to be included in the framework as we present it here. It is often cited as a major factor
in the successful operation of a system [47, 48]. The concept of system complexity
encompasses the understanding that a system should rarely fail, be observable when it does, and be easy to fix. These criteria, among others, are difficult to quantify concisely. Bassan (2015) is a strong example of such an analysis for management and operations practices in wastewater and faecal sludge treatment. However, an analogous technical analysis, perhaps based on “failure modes and effects analysis” (FMEA), could identify – and quantify – how sanitation technologies can become easier to maintain and operate.
The filtering process used to generate the final list of sustainable sanitation criteria
also presents a limitation of the analysis. Meeting quantitative requirements for
sustainable sanitation does not necessarily mean a system is sustainable. Some non-quantitative considerations, removed by the filtering process, may render the system unsustainable. In a sustainable system, all criteria relevant to the identified context are necessary. This means any chosen subset of the full criteria list may rule out a solution or identify areas of opportunity. However, it is impossible to guarantee sustainability even if all known criteria are met. Some notable, non-quantitative criteria left out of the analysis are: equity (ability to adapt to needs of differing age, gender and income groups), resource recovery potential, nutrient removal/circularity,
air emissions, physical suitability of the particular context and legal capacity [12].
These non-quantitative criteria need to be considered externally to the framework. The technoeconomic analysis used to define the underserved context considers three main classes of sanitation solutions to represent the solutions space. Together,
these chosen solutions cover a large portion of the solution space due to their use
frequency, they do not account for all of the possible solutions [49]. Therefore, claims
about any of the modeled trends being a least cost solution are limited to those three solutions and are not inclusive of novel technologies such as omni-processors. Despite the model’s relative simplicity, the trends and results match those of the model in Stantec (2019) once difference in system boundary is accounted for.
The SaNI framework does not require that a particular set of sanitation technology systems be considered. As long as the performance of the system can be quantified, it is applicable within this framework. Even given its simplicity, this framework is an effective way to identify gaps between end-user requirements and sanitation technology system performance. The focus on analyzing neighborhood-sized chunks grouped by population density makes it capable of identifying sanitation deficiencies that occur in similar neighborhoods of otherwise dissimilar cities. These deficiencies are categorized by the sustainability criteria and quantified to elucidate actionable ways in which technologies can be improved.
Chapter 6
Conclusions
The SaNI framework presented in this work synthesizes disparate types of information to present insight into precisely how existing sanitation technologies do not meet a set of key, quantitative, community-scale needs based on sustainability criteria. It is capable of scaffolding the identification of underserved populations, and then quantifying potential unmet needs of that population along each of these sustainability criteria. This makes the SaNI framework a generalizable gap analysis tool.
As an example case, this work presents insight into precisely how FSM-based sanitation technology systems do not meet a set of key, quantitative needs of high-risk Indian population densities. We conclude that our technoeconomic analysis, based only on simple scaling relationships, can identify these high-risk population densities where cost of sanitation is lower than a consumer ability to pay that would constitute equitability.
In one test case of an FSM-based sanitation technology system, our framework finds that this commonly-implemented system does not inherently meet the require-ments of equitable, sustainable sanitation for India. While the system does meet most requirements, it does not satisfy the capital cost requirement imposed by insti-tutional capacity or the lower-bound household area and annual cost requirements. This means that the system, in its current form, is feasible on average, but is likely to be unsuitable for people with lower available land areas and lower abilities to pay. Quantified deficiencies of current sanitation technologies are paramount to
un-derstanding what technology developers and researchers can contribute to making sustainable sanitation more equitable and attainable. Utilizing this framework to explore market gaps and candidate solutions could create a more coherent under-standing of precisely how solutions fail to fill the human and institutional needs of sustainable sanitation.