Collagen Scaffolds for Treatment of Penetrating Brain Injury in a Rat Model
by
MASSACHUSETTS INSTITUTE
Paul Ziad Elias OF TECHNOLOGY
M.S. Aeronautics and Astronautics MAR 0 1 2011
Massachusetts Institute of Technology, 2006
LIBRARIES
B.S. BioengmieeringUniversity of Washington, 2003
SUBMITTED TO THE HARVARD-MIT DIVISION OF HEALTH SCIENCES AND TECHNOLOGY IN PARTIAL FULFILLMENT OF THE REQUIREMENTS FOR THE
DEGREE OF
DOCTOR OF PHILOSOPHY IN BIOMEDICAL ENGINEERING
AT THE
ARCHIVES
MASSACHUSETTS INSTITUTE OF TECHNOLOGY
February 2011
C 2011 Massachusetts Institute of Technology. All rights reserved.
Signature of Author:
Harvara-ivi 1 Livision 01 Health Sciences and Technology
January 28, 2011
Certified by: MyronSpector
Myron Spector Professor of Orthopedic Surger Biomat ials), Harvard Medical School Thesis Supervisor Accepted by:
Ram Sasisekharan Director, Harvard-MIT Division of Health Sciences and Technology / Edwin Hood Taplin Professor of Health Sciences and Technology and Biological Engineering
Collagen Scaffolds for Treatment of Penetrating Brain Injury in a Rat Model
by
Paul Ziad Elias
Submitted to the Harvard-MIT Division of Health Sciences and Technology on January
28, 2011 in partial fulfillment of the requirements for the degree of Doctor of Philosophy
in Biomedical Engineering ABSTRACT
Recovery from central nervous system (CNS) injuries is hindered by a lack of spontaneous regeneration. In injuries such as stroke and traumatic brain injury, loss of viable tissue can lead to cavitation as necrotic debris is cleared. Using a rat model of penetrating brain injury, this thesis investigated the use of collagen biomaterials to fill a
cavitary brain defect and deliver therapeutic agents.
Characterization of the untreated injury revealed lesion volume expansion of 29% between weeks 1 and 5 post-injury. The cavity occupied parts of the striatum and cortex
in the left hemisphere, and was surrounded by glial scarring.
Implantation of a collagen scaffold one week after injury resulted in a modest cellular infiltrate four weeks later consisting of macrophages, astrocytes, and endothelial cells. The scaffold was able to fill the cavity and provide a substrate for cellular
migration into the defect.
Incorporation of a Nogo receptor molecule aimed at binding inhibitory myelin proteins did not appear to promote axonal regeneration, but resulted in increased
infiltration of macrophages and endothelial cells. The increased vascularization observed within the scaffolds represents a modified environment that might be more suitable for regenerative therapies.
A scaffold was also used to investigate the delivery of neural progenitor cells one
week after injury. After four weeks, viable implanted cells were found to have
differentiated into astrocytes, oligodendrocytes, endothelial cells, neurons, and possibly macrophages/microglia.
These results demonstrate the potential utility of combinatorial therapies involving collagen biomaterials, myelin protein antagonists, and neural progenitors for treatment of CNS injuries.
Thesis Supervisor: Myron Spector
Title: Professor of Orthopedic Surgery (Biomaterials), Harvard Medical School
Acknowledgements
I'd like to thank Dr. Spector very much for granting me the opportunity to do research in
his laboratory. I learned a great deal throughout this process and I sincerely appreciated his support and enthusiasm along the way. It was a privilege to have a research
supervisor who cares so much about his students.
Thank you to my committee members Dr. loannis Yannas and Dr. Larry Benowitz for helpful feedback on this research project.
Thank you to all of the students, post-docs, and fellows for being good lab mates and nice people. With regard to this research, thank you to Rahmat Cholas for helping with the
first few surgeries and for taking some of the surgical photographs. Thank you to Cathal Kearney for teaching me how to suture. Thank you to Karen Ng for assistance with handling of the biomaterials during one particularly long day of surgery. Thank you to
our lab manager Alix Weaver for assistance with all matters pertaining to the lab and also for helping with some of the H&E staining.
Thank you to Dr. Simona Socrate and Dr. Thibault Prevost at MIT for assistance with the mechanical testing.
Thank you to VA investigator Dr. Alice Alexander for assorted pieces of lab wisdom shared over the last few years, and for many interesting conversations. Thank you to VA investigator Dr. Kimberly Leite-Morris for assisting with the initial animal surgeries and for providing very helpful information about how to appropriately care for the animals. Thank you to Diane Ghera and the animal handlers in the animal research facility for contributing to the well-being of the rats throughout my studies.
Thank you to Dr. Daniel Lee and Dr. Paul Weinreb at Biogen Idec for generously
providing the soluble Nogo receptor. Thank you to Dr. Fred Gage at the Salk Institute for providing our lab with the neural progenitors. Thank you to James Groer at Dragonfly
Inc. for construction and assembly of the PBI apparatus.
To my family, this could not have been achieved without you. Your love and support were essential for making it through this challenging period. Dad, Mom, Maria, Laila
Table of Contents
Acknowledgements ... 4 Table of Contents ... 5 List of Figures ... 8 List of Tables ... 15 List of Equations ... 16Chapter 1: Introduction and Background ... 18
1.1 General Introduction ... 18
1.2 Intrinsic Factors Limiting Regeneration ... 19
1.3 Extrinsic Factors Lim iting Regeneration ... 19
1.3.1 M yelin Proteins ... 20
1.3.2 Glial Scar ... 21
1.3.3 Inhibitory Axon Guidance M olecules ... 22
1.3.4 Lack of Neurotrophic Factors ... 23
1.4 Injuries to the Central Nervous System ... 24
1.4.1 Traumatic Brain Injury: Non-penetrating... 24
1.4.2 Traumatic Brain Injury: Penetrating ... 25
1.4.3 Ischem ic Stroke... 28
1.4.4 Hemorrhagic Stroke ... 29
1.4.5 Spinal Cord Injury... 29
1.5 Neurodegenerative Diseases... 30
1.5.1 Parkinson's ... 30
1.5.2 Alzheimer's... ... ... 30
1.5.3 Huntington's ... 31
1.5.4 Amyotrophic Lateral Sclerosis (ALS)... 32
1.5.5 M ultiple Sclerosis... 32
1.5.6 Frontotemporal Dementia (FTD)... 32
1.6 Central Nervous System Tissue Engineering ... 33
1.6.1 Goals in the Field ... 33
1.6.2 Research Tools and M ethods: Biomaterials ... .. ... 35
1.6.3 Research Tools and Methods: Neural Stem/Progenitor Cells ... 36
1.6.4 Research Tools and Methods: Neurotrophic Factors ... 37
1.6.5 Research Tools and Methods: Antagonists to Nerve Growth Inhibitors.. 38
1.7 Outline of this Research ... 38
Chapter 2: Viscoelastic Characterization of Rat Cerebral Cortex and Type I Collagen Scaffolds for Central Nervous System Tissue Engineering ... 41
2.1 Introduction ... 42
2.1.1 Indentation Testing... 44
2.2 Experimental M ethods ... 45
2.2.1 Rat Brain Preparation ... 45
2.2.2 Collagen Scaffold Fabrication ... 46
2.2.3 M echanical Testing ... 47
2.2.4 Signal Processing ... 47
2.3 Analytical Methods... 48
2.3.1 Linear Elastic and Viscoelastic Modeling for Indentation of Rat Brain and Collagen Biomaterials... 48
2.4 R esu lts ... . . 54
2.4.1 Stress-Relaxation Behavior of Rat Brain and Collagen Scaffolds... 54
2.4.2 Idealized Short and Long Term Elastic Shear Moduli...56
2.4.3 Five-Element Model Parameters (G1, G2, G3, 112, T3)...57
2.4.4 Relaxation Time Constants...59
2.4.5 Percentage Force Relaxation ... 60
2.5 D iscussion ... . 60
2.6 L im itations... 65
2.7 C onclusion ... 65
Chapter 3: Characterization of a Bilateral Penetrating Brain Injury in Rats and Evaluation of a Collagen Biomaterial for Potential Treatment ... 67
3.1 Introduction ... 68
3.2 Materials and Methods... 70
3.2.1 Experimental Design ... 70
3.2.2 Penetrating Brain Injury Apparatus ... 71
3.2.3 Collagen Scaffold Fabrication ... 71
3.2.4 Surgical Procedure and Animal Care ... 72
3.2.5 Animal Sacrifice and Specimen Processing ... 75
3.2.6 Histology and Immunohistochemistry ... 76
3.2.7 Im aging ... . 78
3.2.8 Histomorphometric Analysis ... 78
3.2 .9 Statistics... . 78
3 .3 R esu lts ... . . 79
3.3.1 Animal Survival, Recovery, and Qualitative Behavioral Observations .... 79
3.3.2 Lesion Characteristics and Volume ... 81
3.3.3 Scaffold Localization and Cellular Infiltration...84
3.3.4 Glial Scarring and Inflammation: GFAP, CS56 and CD68...86
3.3.5 Blood Vessels and Endothelial Cells: Von Willebrand Factor... 93
3.3.6 Neuronal Degeneration: Fluoro-Jade C...95
3.3.7 Oligodendrocytes and Myelinated Axons: CNPase ... ... 96
3.3.8 Post-mitotic Neurons: NeuN... 100
3.3.9 Neural Progenitors: Doublecortin ... 102
3 .4 D iscu ssion ... 103
Chapter 4: Treatment of Penetrating Brain Injury in a Rat Model Using Collagen Scaffolds Loaded with Soluble Nogo Receptor... 114
4 .1 Introdu ction ... 115
4.2 Materials and Methods... 117
4.2.1 Experimental Design ... 117
4.2.2 Penetrating Brain Injury Apparatus ... 118
4.2.3 Collagen Scaffold Fabrication and sNgR Loading ... 119
4.2.4 Soluble Nogo Receptor... 120
4.2.5 Surgical Procedure and Animal Care ... 121
4.2.7 Histology and Immunohistochemistry ... 123
4 .2 .8 Im ag in g ... 12 5 4.2.9 Histomorphometric Analysis and Cell Counts ... 126
4 .2 .10 S tatistics... 12 6 4 .3 R esu lts ... 12 6 4.3.1 Animal Survival, Recovery, and Qualitative Behavioral Observations.. 126
4.3.2 Lesion Volume and Scaffold-Brain Histological Observations ... 128
4.3.3 Glial Scarring and Inflammation: GFAP and CD68 ... 132
4.3.4 Fluorojade C Staining for Degenerating Neurons...137
4.3.5 Von Willebrand Factor Staining for Endothelial Cells ... 138
4.3.6 CNPase Staining for Oligodendrocytes... 140
4.3.7 NeuN Staining for Mature Neurons ... 142
4.3.8 Doublecortin Staining for Neural Progenitors ... 143
4.3.9 Tau-1, Neurofilament, and MAP lb Staining for Axons ... 143
4 .4 D iscu ssion ... 146
Chapter 5: Implantation of a Collagen Scaffold Seeded with Adult Rat Hippocampal Progenitors in a Rat Model of Penetrating Brain Injury ... 154
5.1 Introdu ction ... 155
5.2 Materials and Methods... 157
5.2.1 Experimental Design ... 158
5.2.2 Penetrating Brain Injury Apparatus ... 158
5.2.3 Collagen Scaffold Fabrication ... 158
5.2.4 Cell Culture and Scaffold Seeding of Adult Hippocampal Neural P rog en itors ... 159
5.2.5 Surgical Procedure and Animal Care ... 160
5.2.6 Animal Sacrifice and Specimen Processing ... 162
5.2.7 Histology and Immunohistochemistry ... 162
5 .2 .8 Im agin g ... 165
5.2.9 Histomorphometric Analysis and Cell Counts ... 165
5 .2 .10 S tatistics... ... ... 16 5 5 .3 R esu lts ... 16 6 5.3.1 Animal Survival, Recovery, and Qualitative Behavioral Observation ... 166
5.3.2 Lesion Volume and Scaffold-Brain Histological Observations ... 167
5.3.3 Implanted Cell-Seeded Scaffolds... 168
5.3.4 Survival of Implanted Neural Progenitors... 171
5.3.5 Glial Scarring and Inflammation: GFAP and CD68 Staining ... 172
5.3.6 Von Willebrand Factor Staining: Blood Vessels and Endothelial Cells 174 5.3.7 CNPase Staining for Oligodendrocytes... 175
5.3.8 NeuN Staining for Mature Neurons ... 178
5.3.9 MAPlb Staining for Neurons ... 180
5.3.10 Doublecortin staining for Neural Progenitors... 180
5.4 D iscu ssion ... 180
Chapter 6: Conclusions and Future Work ... 189
List of Figures
Figure 2.1. Five-element viscoelastic model under load P and displacement 6. ... 50 Figure 2.2. Representative brain (n=5) and collagen scaffold (n=6) relaxation data fitted
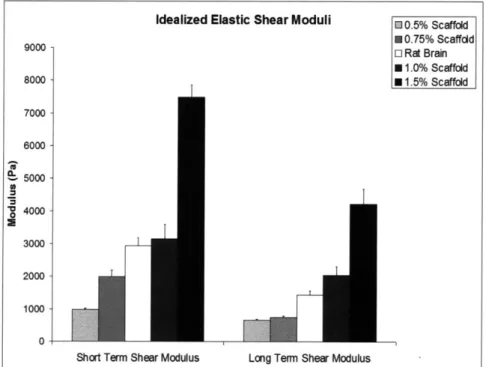
with the five-element viscoelastic model... 56 Figure 2.3. Idealized short term and long term elastic shear moduli ... 57
Figure 2.4. Shear moduli G1, G2, G3 for rat brain and collagen scaffold stress-relaxation
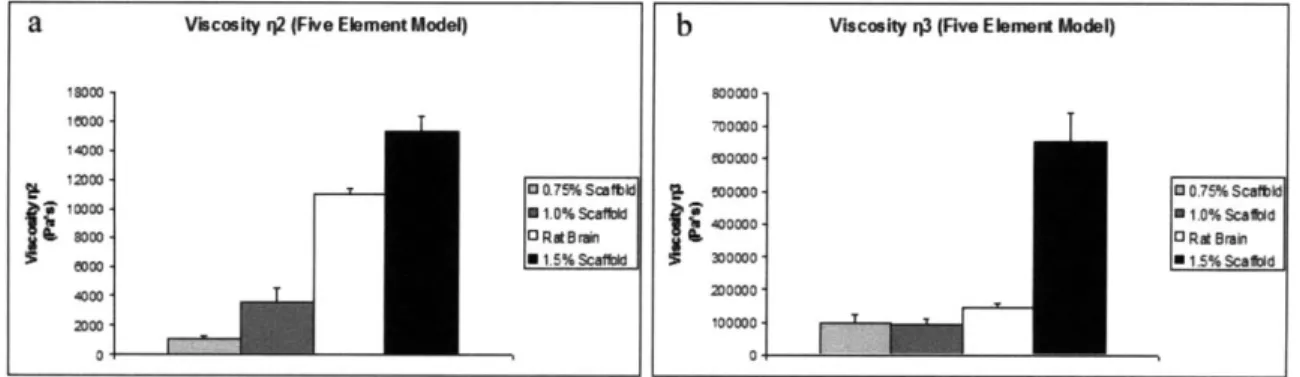
data fit with the five-element viscoelastic model...58 Figure 2.5. Viscosities 12 (a) and i13 (b) for rat brain and collagen scaffold
stress-relaxation data fit with the five-element viscoelastic model...59 Figure 2.6. Time constants 1ci (a) and T2 (b) for rat brain and collagen scaffold
stress-relaxation data fit with the five-element viscoelastic model...60 Figure 2.7. Percentage Relaxation (1-final load/peak load) for brain and scaffold
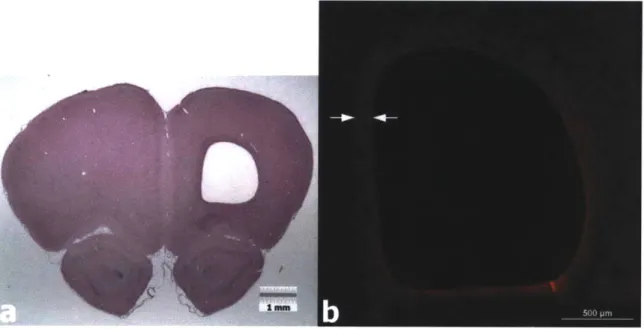
m aterials...6 0 Figure 3.1. PBI Surgical Procedure. a) Lateral aspect of the head with the temporalis
muscle exposed. b) Lateral surface of the skull exposed with part of the temporalis muscle excised. c) Cranial window though which the PBI probe will be inserted. d) PBI probe in place just prior to insertion into the brain. e) Collagen membrane
covering the cranial window following the injury. f) Incisions closed with 4-0
su tu res...7 3
Figure 3.2. Collagen Scaffold Implantation Surgery. a) Incision to expose the site of the cranial window. b) Scar tissue covering the collagen membrane and cranial window. c) Cranial window exposed. d) Cranial window exposed (different animal). e) Implantation of the collagen scaffold into the defect. f) Collagen membrane covering the cranial window prior to closing the incision...75 Figure 3.3. Transcardial Perfusion ... 75 Figure 3.4. Incision sites following surgery. a) 1 week post-injury. b) 5 days after 2nd
surgery (different anim al) ... 79
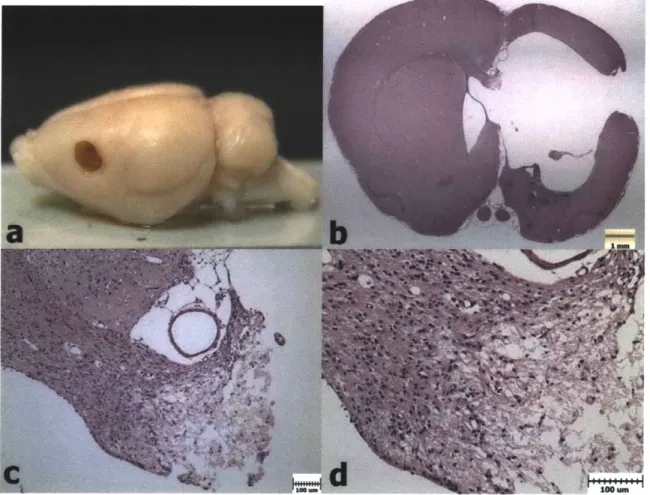
Figure 3.5. Weight Progression After PBI and Scaffold Implantation. a) Animals in Group 1 lost weight on average in the first 2 days after surgery, and thereafter began to gain weight again. b) Animals in Group 2 showed a similar trend to Group 1. c) Animals in Group 3 maintained their weight on average after the second surgery (Day 8). d). Animals in Group 4 showed a similar trend to those in Group 3. ... 80 Figure 3.6. H&E Histology 1 Week after PBI (Group 1). a) PBI lesion evident in the
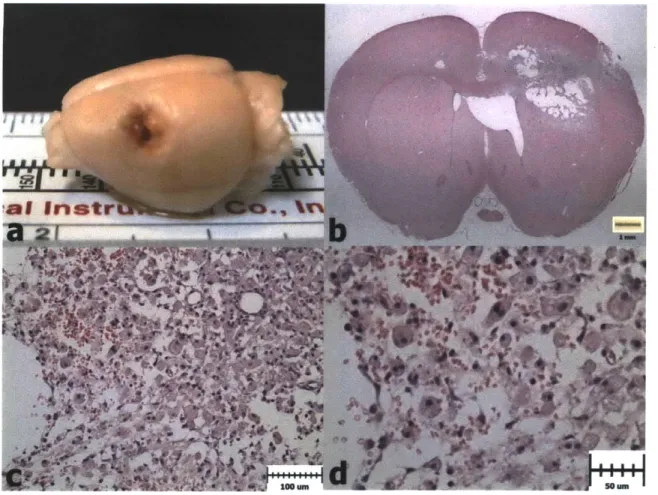
extracted brain from a Group 1 animal. b) H&E coronal section showing damaged regions of cortex, striatum, lateral ventricle, external capsule, and corpus callosum
after 1 week. c) Necrotic tissue being cleared by macrophages. d) Higher
magnification image showing erythrocytes and engorged macrophages in the lesion site ... 8 2
Figure 3.7. H&E Histology 5 Weeks after PBI (Group 3). a) PBI lesion after 5 weeks in the extracted brain of a Group 3 animals. b) H&E image showing the large PBI cavity in the left hemisphere at 5 weeks. c) Degeneration in the corpus callosum at
5 weeks. d) Higher magnification of the corpus callosum showing necrotic white
Figure 3.8. PBI Lesion Volumes. Group 3 and 4 volumes were significantly greater than
Group 1 (p=0.010, p=0.036, respectively) and Group 2 (p=0.020, p=0.041,
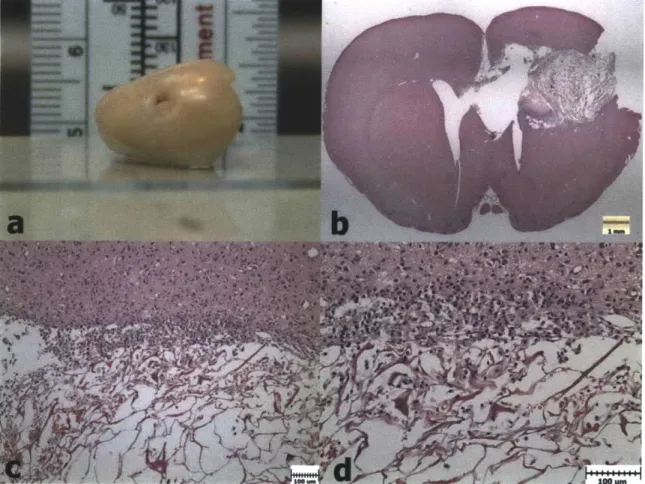
respectively) volum es. ... 84 Figure 3.9. H&E Histology 1 Week after PBI and Scaffold Implantation (Group 2). a)
Extracted brain showing a collagen scaffold in the PBI lesion. b) H&E histology showing the collagen scaffold within the PBI lesion. c) Cellular infiltration at the superior edge of the scaffold. d) Higher magnification view showing cells along the scaffold struts ... . 85
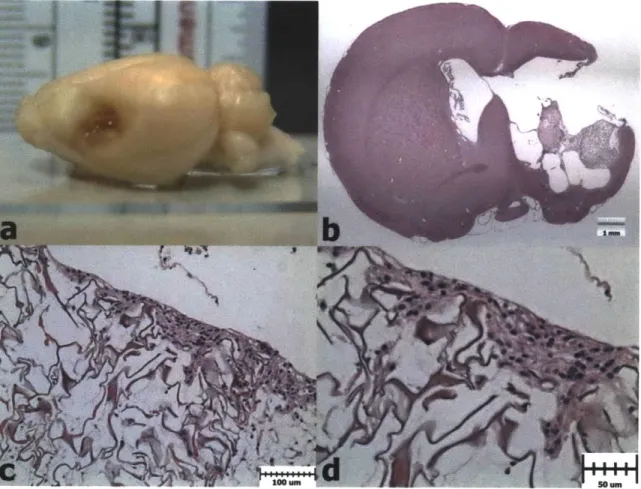
Figure 3.10. H&E Histology 4 Weeks after Scaffold Implantation (Group 4). a) Extracted brain with a collagen scaffold in the lesion site. b) H&E histology showing a collagen scaffold at the lateral edge of the PBI cavity. c) Cellular infiltration along the superior edge of the scaffold. d) Higher magnification image show ing cells w ithin the scaffold ... 86
Figure 3.11. GFAP Staining Surrounding the PBI Lesion after 1 Week (Group 1). a)
H&E histology showing a PBI lesion after 1 week. b) GFAP staining surrounding
th e lesio n site...87 Figure 3.12. GFAP Staining Surrounding the Implanted Collagen Scaffold after 1 Week
(Group 2). a) H&E image showing a collagen scaffold within the defect site after 1 week. b) GFAP reactivity surrounding the lesion, with very little staining within th e scaffo ld ... 87
Figure 3.13. GFAP Reactivity Bordering the PBI Cavity at 5 Weeks (Group 3). a)
H&E image of the PBI lesion after 5 weeks. b) GFAP reactivity along the superior
edge of the cavity... 88
Figure 3.14. GFAP Reactivity Near Anterior Aspect of Lesion at 5 weeks (Group 3). a)
H&E image of the anterior portion of the PBI cavity. b) GFAP staining bordering
the cavity and extending throughout much of the ipsilateral hemisphere. ... 89
Figure 3.15. GFAP Reactivity Surrounding the Implanted Collagen Scaffold (Group 4). a) H&E histology showing an implanted scaffold. b) GFAP reactivity surrounding the lesion with a relatively small amount of staining within the scaffold ... 89
Figure 3.16. GFAP positive astrocytes within the collagen scaffolds of Group 2 and Group 4. a) Astrocytes within a scaffold after 1 week (Group 2). b) Astrocytes within a scaffold after 4 weeks (Group 4). Green: GFAP, Blue: DAPI ... 90
Figure 3.17. GFAP Cell Density in Collagen Scaffolds (Group 2 and Group 4). The density of astrocytes in Group 4 scaffolds was significantly greater than in Group 2 scaffolds (p=0.053)... 90
Figure 3.18. CS56 Reactivity Surrounding the PBI Lesion at 5 Weeks (Group 3). a)
H&E image of a PBI lesion after 5 weeks. b) Increased CS56 reactivity bordering
the P B I cavity . ... 9 1
Figure 3.19. CD68 Staining of the PBI Lesion after 1 Week (Group 1). a) H&E image of a PBI lesion. b) Numerous CD68 positive macrophages in the lesion site at 1 w eek ... 9 2
Figure 3.20. CD68 Staining of PBI Lesion After 5 weeks (Group 3). a) H&E image of a PBI lesion at 5 weeks. b) Reduced CD68 staining at 5 weeks relative to the lesion at 1 week. Staining is evident around the border of the lesion and in the small amount of rem aining cellular debris ... 92
Figure 3.21. CD68 Staining within a collagen scaffold after 1 week (Group 2). a) H&E image of collagen scaffold within a PBI lesion after 1 week. b) CD68 staining of macrophages within the collagen scaffold (Red: CD68, Blue: DAPI)...93 Figure 3.22. CD68 Staining within a collagen scaffold after 4 weeks (Group 4). a) H&E
image of a collagen scaffold within a PBI lesion. b) CD68 staining of macrophages within the collagen scaffold (Red: CD68, Blue: DAPI)...93 Figure 3.23. VWF staining of blood vessels within the PBI lesion after 1 week (Group
1). a) H&E histology of a PBI lesion after 1 week. b) Numerous VWF positive
blood vessels in the lesion site. ... 94 Figure 3.24. VWF staining of blood vessels bordering the PBI cavity after 5 weeks
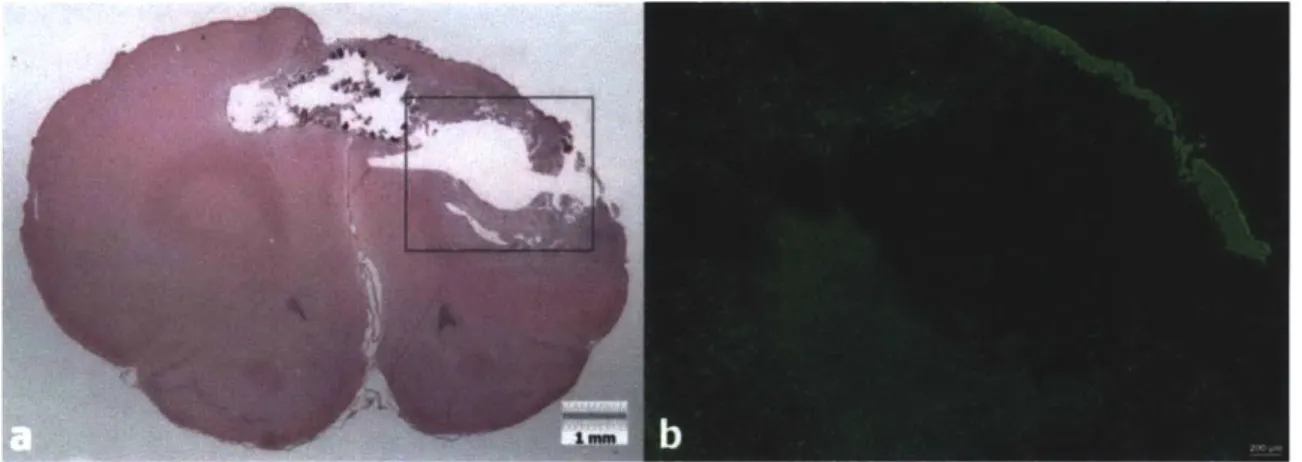
(Group 3). a) H&E image of a PBI lesion after 5 weeks. b) Blood vessels along the border of the PBI cavity. ... 94 Figure 3.25. VWF staining in collagen scaffolds after 1 week (Group 2) and 4 weeks
(Group 4). a) VWF positive cells/vessels in a collagen scaffold from Group 1. The approximate scaffold border is indicated with a white dotted line. b) VWF
cell/vessel in a collagen scaffold from Group 4... 95
Figure 3.26. Fluorojade staining of degenerating neurons 1 week after PBI (Group 1). a)
H&E section from Group 1 including thalamic nuclei. b) Low magnification
Fluorojade C staining showing reactivity in the thalamus and internal capsule. c) Neuronal cell bodies in the thalamus staining positively. d) Higher magnification image of degenerating neurons in the thalamus ... 96
Figure 3.27. CNPase staining 1 week after PBI (Group 1). a) H&E histology of a PBI lesion after 1 week. b) Discontinuity of CNPase staining in striatum. c)
Discontinuity of CNPase staining in corpus callosum. d) Normal striatum in the contralateral hemisphere. e) Damaged striatum in ipsilateral thalamus. ... 98
Figure 3.28. CNPase staining 5 week after PBI (Group 3). a) H&E histology of a PBI lesion after 5 weeks. b) Discontinuity of CNPase staining in the corpus callosum. c) CNPase staining along the superior edge of a PBI lesion...99 Figure 3.29. CNPase staining surrounding a collagen scaffold after 1 week (Group 2). a)
H&E histology showing a collagen scaffold in a PBI lesion after 1 week. b)
CNPase staining along the border (white line) of a collagen scaffold at 1 week...99 Figure 3.30. CNPase staining at the border of a collagen scaffold after 4 weeks (Group
4). a) H&E histology of a collagen scaffold in the PBI lesion after 4 weeks. b) CNPase staining near the border (white line) of a collagen scaffold. ... 100 Figure 3.31. NeuN staining near the PBI lesion after 1 week (Group 1). a) H&E image
of a PBI lesion after 1 week. b) NeuN staining extending from the border of the PBI lesion into the viable cortex. There is a complete absence of staining within the le sio n ... 10 1
Figure 3.32. NeuN staining bordering the PBI lesion after 5 weeks (Group 3). a) H&E image of a PBI lesion after 5 weeks. b) NeuN positive neurons in close proximity to the cavity border...10 1
Figure 3.33. NeuN staining near a collagen scaffold after 1 week (Group 2). a) H&E image of a collagen scaffold within a PBI lesion after 1 week. b) Absence of NeuN staining w ithin the collagen scaffold. ... 102
Figure 3.34. NeuN staining bordering a collagen scaffold after 4 weeks (Group 4). a)
H&E image of a collagen scaffold within a PBI lesion after 4 weeks. b) NeuN
positive neurons near the edge (white line) of a collagen scaffold. ... 102 Figure 3.35. Doublecortin staining near the medial border of a PBI lesion after 1 week
(Group 1). a) H&E image of a PBI lesion after 1 week. b) DCX positive cells spreading from the subventricular zone to the medial border of the PBI lesion...103 Figure 3.36. Doublecortin staining near the medial border of the PBI cavity after 5 weeks
(Group 3). a) H&E image of a PBI lesion after 5 weeks. b) DCX positive cells along the medial border of the PBI cavity. ... 103
Figure 4.1. Group 5 Weight Progression Following PBI and Scaffold Implantation .... 127
Figure 4.2. Group 6 Weight Progression Following PBI and Scaffold Implantation .... 127
Figure 4.3. Group 7 Weight Progression Following PBI and Scaffold Implantation .... 128 Figure 4.4. Lesion Volume for Groups 5, 6, and 7. Lesion volume in Group 7 was
significantly larger than that of Group 6 (p=0.009). ...
128
Figure 4.5. H&E Histology 4 Weeks after Scaffold Implantation (Group 5). a) H&E image showing a scaffold filling the defect in Group 5, 4 weeks after implantation.
b) Cellular infiltration at the inferior border of the scaffold. c) Sparse cellular
infiltration near the superior medial border of the lesion cavity. ... 130
Figure 4.6. H&E Histology 4 Weeks after Implantation of an sNgR-loaded Scaffold (Group 6). a) H&E image of the PBI lesion with an sNgR loaded scaffold filling the defect. The cellular infiltrate can be seen even at low magnification. b) Dense cellular infiltration near the medial border of the scaffold. c) Cellular infiltrate with cells of varying m orphology apparent. ... 131
Figure 4.7. H&E Histology 8 Weeks after Implantation of an sNgR-loaded Scaffold (Group 7). a) H&E image of a PBI lesion with an sNgR scaffold filling much of the defect 8 weeks after implantation. b) Dense cellular infiltrate near the superior border of the lesion. c) Cellular infiltrate near the inferior border of the scaffold.
...132 Figure 4.8. GFAP Staining Near the Implanted Scaffold after 4 weeks (Group 5). a)
H&E image of a PBI lesion with an implanted scaffold. b) GFAP staining
surrounding the scaffold, with some scattered staining within the scaffold. ... 133 Figure 4.9. GFAP Staining Near an sNgR-loaded Scaffold after 4 weeks (Group 6). a)
H&E image of an sNgR loaded scaffold within a PBI lesion. b) Dense GFAP
staining surrounding the scaffold, with a little staining within the scaffold ... 134 Figure 4.10. GFAP Staining Near an sNgR-loaded scaffold after 8 weeks (Group 7). a)
H&E image of an sNgR scaffold with a PBI lesion. b) GFAP staining surrounding
the scaffold, with a some staining also seen within the scaffold... 134 Figure 4.11. GFAP cell density within collagen scaffolds (Groups 5, 6, 7). GFAP cell
density in Group 7 scaffolds was significantly higher than in Group 5 (p=0.001) and
G roup 6 (p= 0.004)... 135
Figure 4.12. CD68-positive macrophages within a collagen scaffold after 4 weeks (Group 5). a) 20x magnification image showing numerous macrophages within a scaffold. b) High magnification image showing a macrophage along a scaffold strut. (R ed: CD 68, B lue: D A PI)... 136
Figure 4.13. CD68-positive macrophages within an sNgR-loaded scaffold after 4 weeks (Group 6). a) 20x magnification image showing a very dense macrophage infiltrate
within a scaffold. b) 40x image showing macrophages among cells of other phenotypes within the scaffold. (Red: CD68, Blue: DAPI)...136 Figure 4.14. CD68 positive macrophages within an sNgR-loaded scaffold after 8 weeks
(Group 7). a) H&E image of a scaffold within a PBI lesion. b) Macrophages w ithin the scaffold. ... 137
Figure 4.15. CD68 Cell Density Within Collagen Scaffolds (Groups 5, 6, and 7). Group
6 had a significantly higher density of macrophages in the scaffold than Group 5 (p=0.003) and Group 7 (p=0.009). Group 7 also had a higher density than Group 5
(p
=
0 .0
0 9 )...
13 7
Figure 4.16. VWF positive cells/vessels in a collagen scaffold after 4 weeks (Group 5). a) VWF positive cells/vessels within a scaffold. b) 40x magnification of VWF positive cell/vessel. (Green: VW F, Blue: DAPI) ... 138
Figure 4.17. VWF positive cells/vessels in a sNgR loaded scaffold after 4 weeks (Group
6). a) H&E image of a scaffold within a PBI lesion. b) VWF positive cells/vessels
distributed throughout the collagen scaffold (white line indicates approximate scaffold border). c) 40x magnification of VWF positive cells/vessels. (Green: VWF, Blue: DAPI)...139 Figure 4.18. VWF positive cells/vessels in a sNgR loaded scaffold after 8 weeks (Group
7). a) VWF positive cells/vessels within a collagen scaffold. b) Additional VWF
positive cells/vessels w ith a scaffold. ... 139
Figure 4.19. VWF Cell/Vessel Density within collagen scaffolds. The density of cells/vessels in Group 6 and Group 7 was significantly greater than in Group 5
(p=O.001 and p=0.0 18, respectively). ... 140 Figure 4.20. CNPase staining near the border of a collagen scaffold after 4 weeks (Group
5). a) DAPI stain showing cells in close proximity or in contact with a collagen
scaffold (white lines show scaffold struts). b) A CNPase positive oligodendrocyte (white arrow) slightly within the border of the scaffold... 141 Figure 4.21. CNPase staining near the border of an sNgR loaded scaffold after 4 weeks
(Group 6). a) DAPI staining showing cells within the scaffold, near its border. White lines indicate scaffold struts. b) CNPase positive oligodendrocytes (white arrows) slightly within the scaffold border... 141 Figure 4.22. CNPase staining near the border of an sNgR loaded scaffold after 8 weeks
(Group 7). a) CNPase staining showing myelinated axons near the scaffold border (white line) b) CNPase staining showing myelinated axons and a few
oligodendrocytes (white arrows) in contact with the scaffold edge ... 141 Figure 4.23. NeuN staining near the border of a collagen scaffold after 4 weeks (Group
5). a) NeuN positive neurons in viable brain near the scaffold edge. White lines
indicate the approximate location of scaffold struts b) A few NeuN positive cells (w hite arrow ) w ithin the scaffold ... 142 Figure 4.24. NeuN staining near the border of an sNgR loaded scaffold after 4 weeks
(Group 6). a) DAPI staining showing cells slightly within the scaffold border. Scaffold struts are indicated with white lines b) NeuN staining showing a few neurons (white arrows) within the scaffold... 143 Figure 4.25. NeuN staining near the border of an sNgR loaded scaffold after 8 weeks
superior border. White lines indicate scaffold struts b) 40 x magnification of the neurons (white arrows), surrounded by scaffold struts... 143 Figure 4.26. Neurofilament staining bordering a collagen scaffold after 4 weeks (Group
5). a) DAPI staining showing cells along and within the scaffold border (white
line). b) Neurofilament staining of axons running alongside the scaffold, but not w ith in it. ... 14 4 Figure 4.27. Neurofilament staining bordering an sNgR loaded scaffold after 4 weeks
(Group 6). a) DAPI staining showing cells bordering the scaffold and a dense infiltrate into the scaffold. b) Neurofilament staining along the scaffold border, but not w ithin the scaffold. ... 144 Figure 4.28. Neurofilament staining bordering an sNgR loaded scaffold after 8 weeks
(Group 7). a) DAPI staining showing cells along and within the scaffold border (white line). b) Neurofilament staining showing axons passing adjacent to the scaffo ld ... 14 5
Figure 4.29. Tau-1 staining bordering a collagen scaffold after 4 weeks (Group 5). a)
DAPI staining showing cells bordering and within the scaffold. The white line
indicates the scaffold border. b) Tau- 1 staining showing axons bordering the
scaffold, but not entering it. ... 145 Figure 4.30. Tau-1 staining near the border of an sNgR loaded scaffold after 4 weeks
(Group 6). a) DAPI staining showing cells near the scaffold border and slightly within it. White lines indicate scaffold struts. b) Tau- 1 staining which comes in contact with the scaffold near the lesion border... 146 Figure 4.31. Tau- 1 staining near the border of an sNgR loaded scaffold after 8 weeks
(Group 7). a) DAPI staining showing a dense cellular infiltrate into the collagen scaffold. The scaffold border is indicated by the white line. b) Tau- 1 staining showing axons in contact with the scaffold border, but not extending far within the scaffo ld ... 14 6 Figure 5.1. PBI Weight Progression for Group 8. Animals typically lost weight for 1-2
days after the injury, but thereafter resumed weight gain. Weight was generally maintained following the 2"d surgery to implant the cell-seeded scaffold. ... 167 Figure 5.2. H&E Histology of a Scaffold Seeded with Neural Progenitors (Group 8). a)
H&E image of a scaffold within the lesion site 4 weeks after implantation. b)
Integration of the scaffold with tissue a the lateral edge of the brain. c) Cellular infiltration of the scaffold. ... 168
Figure 5.3. Collagen scaffold containing BrdU labeled neural progenitors (prior to implantation). a) DAPI staining showing the nuclei of cells within the scaffold. b) BrdU staining showing that nearly all of the cells within the scaffold were labeled w ith B rdU ... 169
Figure 5.4. Collagen scaffold containing nestin-positive neural progenitors (prior to implantation). a) 1Ox magnification image showing many cells staining positive for nestin within the scaffold. b) 20x image showing a cluster of cells with most staining positive for nestin. c) 40x image of nestin positive cells along a scaffold strut. (G reen: N estin, B lue: D A PI)... 170
Figure 5.5. Collagen scaffold containing a GFAP positive cell (prior to implantation). a) 20x image demonstrating that very few cells in the scaffold were GFAP positive. b) 40x image of a GFAP positive cell. (Green: GFAP, Blue: DAPI)... 171
Figure 5.6. BrdU labeled neural progenitors detected in vivo 4 weeks after implantation. a) H&E image of a scaffold within the PBI lesion 4 weeks after implantation. b)
DAPI staining (blue) showing nuclei of cells at the scaffold border (white line) and
within the brain on the medial side. c) BrdU staining (red) showing implanted cells that have survived in the brain after 4 weeks... 172
Figure 5.7. Implanted neural progenitors staining positive for BrdU and GFAP after 4 weeks. a) Double labeling for DAPI (blue) and GFAP (green) showing that some implanted cells differentiate into astrocytes (arrow) among the glial scar bordering the scaffold. b) Double labeling showing implanted cells that differentiate into astrocytes (arrows) in normal appearing brain tissue. ... 173
Figure 5.8. Implanted neural progenitors staining positively for CD68. a) Double labeling for BrdU (blue) and CD68 (red) showing an implanted cell (arrow) that may have differentiated into a macrophage within the brain. b). An implanted cell (arrow) from a different animal staining positively for BrdU (blue) and CD68 (red).
... 174 Figure 5.9. Implanted neural progenitors staining positively for VWF. a) DAPI staining
(magenta) showing nuclei of all cells in the field. b) BrdU staining (blue) showing implanted cells. c) Double labeling for BrdU (blue) and VWF (green) showing a small blood vessel with three implanted cells (white arrows) that have taken on an endothelial cell phenotype. ... 175
Figure 5.10. Implanted neural progenitors staining positive for CNPase. a) DAPI staining (magenta) showing nuclei of all cells in the field. b) CNPase staining (green) showing several oligodendrocytes. c) Double labeling for BrdU (blue) and CNPase (green) showing three implanted cells (arrows) that have differentiated into
oligodendrocytes... 177
Figure 5.11. Implanted neural progenitor differentiated into a perineuronal satellite oligodendrocyte. a) DAPI staining (magenta) showing nuclei of all cells in the field. b) CNPase staining (green) showing a perineuronal satellite oligodendrocyte (white arrow). c) Double labeling for BrdU (blue) and CNPase (green) showing that the perineuronal satellite oligodendrocyte is an implanted cell. ... 178
Figure 5.12. Implanted neural progenitor staining positive for NeuN. a) DAPI staining (magenta) showing nuclei of all cells in the field. b) NeuN staining (red) showing post-mitotic neurons. c) Double labeling for BrdU (blue) and NeuN (red) showing an implanted cell (arrow) that appears to stain dimly, but positively, for NeuN.... 179
List of Tables
Table 1: Experimental Groups ... 70
Table 2: Immunohistochemistry reagents (Abbreviations: rb (rabbit), ms (mouse), gt (g o at),...7 7
Table 3. Experimental Groups ... 118
Table 4 Immunohistochemistry reagents (Abbreviations: rb (rabbit), ms (mouse), gt (g o at)... 12 4 Table 5 Immunohistochemistry reagents (Abbreviations: rb (rabbit), ms (mouse), gt
List of Equations
Equation 1: Spherical-tip indentation solution for the shear modulus of an
incompressible linearly elastic material... 49
Equation 2: Spherical-tip indentation solution of a viscoelastic material modeled with three linear elem ents ... 49
Equation 3: Laplace transformed relationship between load P and step displacement 6o. ...50
Equation 4: Laplace transformed relationship between deviatoric stress and strain for a viscoelastic material modeled with five linear elements. ... 51
Equation 5a: Spherical-tip indentation solution for a viscoelastic material modeled with five linear elements and subjected to a step displacement 6o... ... 51
Equation 6: Determination of G1 from estimation of the experimental value P(0)...53
Equation 7: Determination of G2 from experimental values P(t2), P(o)...53
Equation 8: Determination of 12 from experimental values P(t2), P(t3), and P(o). ... 53
Equation 9: Determination of G3 from experimental values P(0), P(t2), P(t3), and P(oo). 53 Equation 10: Determination of r3from experimental values ... 53
Chapter 1: Introduction and Background
1.1 General Introduction
Injuries and diseases of the central nervous system (CNS) are particularly
devastating due to the lack of spontaneous tissue regeneration. Stroke, neurodegenerative disease, spinal cord injury, and traumatic brain injuries collectively present a major health care challenge for both the civilian and military populations. A more extensive
understanding of the cellular and environmental regenerative limitations involved in CNS lesions will be necessary for the development of effective treatments. While considerable challenges remain, many elements of the physiological injury response in the CNS are now known. This improved body of knowledge has made clear that the complexity of
CNS lesions is likely to require combinatorial therapies targeting several distinct
components of the pathologies. In general, the factors preventing regeneration can be divided into intrinsic cellular limitations and extrinsic elements of the injury
environments [1, 2]. Devising comprehensive methods to simultaneously and adequately address these factors will be a prerequisite for ultimately achieving more satisfactory clinical outcomes.
This work aims to investigate several therapeutic agents with potential utility in treatment of CNS lesions. The starting point for the proposed work is a collagen scaffold that can be implanted into a damaged brain. This biomaterial provides a foundation for subsequent studies of combinatorial therapies involving delivery of a therapeutic protein or a population of neural progenitor cells.
This chapter begins with an overview of some of the major obstacles that must be overcome in the process of developing CNS treatments. This is followed by descriptions of common CNS injuries and diseases, as well as a summary of various research tools used in CNS tissue engineering. The chapter concludes with an outline of the
experiments included in this thesis.
1.2 Intrinsic Factors Limiting Regeneration
Intrinsic cellular limitations refer to the insufficient capacity of existing cells to proliferate, grow, and potentially replace damaged or dead cells [1]. A major obstacle lies in the fact that mature neurons do not proliferate, and therefore are unable to
repopulate a region of the brain or spinal cord lost to disease or injury. Similarly, mature neurons that undergo damage have a greatly limited ability to extend axons relative to developing cells. One reason for this is the decreased expression of genes such as GAP-43 [3] that regulate the growth of axons and establishment of synapses. Further, various neuronal subtypes differ substantially in their intrinsic axonal growth capability and their response to exogenous environmental factors [4]. While the existence and multipotency of endogenous neural progenitors in the brain and spinal cord have been demonstrated, they appear to be insufficient for robust CNS repair in their native form and number.
1.3 Extrinsic Factors Limiting Regeneration
Although the axonal growth capacity of mature neurons is not as robust as during development, a significant degree of regeneration is theoretically still be possible. This
potential for regeneration is defeated largely by inhibitory factors in the CNS injury environment. It was demonstrated, for example, that neurons from the CNS can extend
long distances through a peripheral nerve graft [5]. Identifying and targeting the inhibitory extrinsic elements in the CNS will be necessary for achieving regeneration.
1.3.1 Myelin Proteins
It was discovered early on that oligodendrocyte myelin is inhibitory for growing axons, causing acute growth cone collapse [6]. 3 particular myelin proteins were eventually identified and characterized as major axon growth inhibitors: Reticulon 4 (Nogo) [7], Oligodendrocyte Myelin Glycoprotein (OMgp) [8], and Myelin Associated Glycoprotein (MAG) [9]. Interestingly, it was found that they bind a common receptor, known as Nogo Receptor (NgR) [8, 10-12]. NgR is a 473 amino acid
glycosylphosphatidylinositol-anchored (GPI-anchored) protein, which includes 8 leucine-rich-repeat domains that are involved in ligand-binding[13, 14]. Although NgR is a receptor for several signaling molecules, it lacks an intracellular domain and must rely on co-receptors such as P75 [15, 16], LINGO-I [17], Gtlb, and TROY [18, 19] for
intracellular signaling [20]. The intracellular signaling cascade following binding of the
NgR complex leads to collapse of axonal growth cones by activation of cytoskeletal
regulators such as rhoA GTPase and rho kinase (ROCK) [21, 22]. The NgR pathway has been the subject of much research over the last decade. While many promising results have been obtained, it has become clear that additional approaches will be necessary going forward. Recently, the paired immunoglobulin-like receptor B (PirB) in mice was also found to bind the 3 myelin proteins and act as an inhibitor of axonal regeneration
[23]. This discovery has helped to explain some confounding results previously obtained
while studying NgR, particularly the result that NgR knockout mice show only moderately enhanced regeneration after CNS injury [24]. This and other work has
demonstrated that blocking the effects of myelin proteins or their downstream targets will be an important part of a comprehensive treatment plan for certain CNS lesions.
Recent findings have suggested that the same myelin proteins involved in growth cone collapse may also have effects on neural progenitor cells (NPCs). The use of NPCs has been hindered in part by a lack of control over differentiation after implantation, with some results suggesting a tendency to either remain undifferentiated or to take on an astroglial phenotype. Similar effects were demonstrated in vitro when NPCs expressing
NgR were exposed to Nogo or its active inhibitory fragment [25-27]. It is possible then
that myelin proteins may play a role in limiting the efficacy of both implanted and endogenous NPCs after injury.
1.3.2 Glial Scar
Another major factor inhibiting axonal regeneration is the presence of a glial scar
[28]. While scar tissue in peripheral organs such as skin and peripheral nerve is
characterized by fibrous collagen deposition and wound contraction, scar in the CNS is markedly different. Following a CNS injury, resident astrocytes respond to
environmental cues by proliferating and taking on a ramified phenotype known as an "activated" astrocyte. The astrocytes, along with microglia, migrate to the site of the injury and surround it with a cellular barrier [29]. Additionally, they deposit extracellular matrix molecules consisting of axon-inhibitory chondroitin sulfate proteoglycans [30].
Until recently, the precise mechanism by which CSPGs inhibit regeneration was
unknown. While it had been suggested that the mechanism involved activation of protein kinase C and rho GTPase, evidence for binding to a particular receptor was lacking [31]. It was also observed that disrupting epidermal growth factor (EGFR) signaling blocked
some of the inhibitory effects, EGFR was not found to directly bind CSPGs [31]. It was, however, recently discovered that a transmembrane protein tyrosine phophatase (PTPG) is a receptor for CSPGs, and that disruption of PTPG after spinal cord injury resulted in enhanced regeneration [32]. As this area of research continues, it is likely that novel therapies will be available to better target the inhibitory nature of the glial scar.
To date, many therapeutic approaches have focused on disrupting either the formation of the glial scar, or the scar itself after the acute injury response has subsided. Approaches of interest include blocking elements of the inflammatory cascade [28], using biomaterials to prevent formation of the cellular barrier [33], and enzymatic degradation of the inhibitory extracellular matrix (ECM) molecules using chondroitinase [31, 34]. While eliminating elements of the glial scar will likely be necessary in developing treatment options, it has been suggested that the timing of such action is of critical
importance. Studies have demonstrated positive effects of the reactive astrocytes in early stages following an acute insult [35, 36], and thus it may be essential to allow initial scar formation without inhibition to avoid further injury.
1.3.3 Inhibitory Axon Guidance Molecules
In addition to the myelin proteins that act through NgR, there exist other
play a crucial role in proper development of the CNS, a subset of them that possess axon-repulsive characteristics are prevalent in lesion sites and act to inhibit regeneration. Netrin- 1, for example, continues to be expressed by mature neurons, oligodendrocytes, and Schwann cells. Molecules such as Semaphorins, ephrins and various slits have also been found in the glial scar and CNS myelin. Repulsive guidance molecule A (RGMa) is
expressed in the adult spinal cord and appears to play a role in preventing recovery after injury. Neutralizing axon guidance molecules may prove to be an important component of future therapies [37].
1.3.4 Lack of Neurotrophic Factors
Aside from active inhibitors, it may also be that the lesion environment is lacking the trophic factors necessary for neuronal survival and axonal outgrowth. A variety of molecules have been identified and characterized for their ability to promote neuronal survival and growth.
The neurotrophins make up one such class of molecules consisting of nerve growth factor (NGF), brain-derived neurotrophic factor (BDNF), neurotrophin 3 (NT-3), and neurotrophin 4/5 (NT-4/5). Neurotrophins have a major role in promoting neuronal survival, but also act to regulate axon growth, synapse formation, dendrite formation, cell migration, and proliferation. Neurotrophins are known to act through specific tyrosine kinase receptors, with NGF binding to tyrosine kinase receptor A (TrkA), BDNF and
NT-4/5 binding to TrkB, and NT-3 to TrkC. Additionally, all neurotrophins can bind to the
receptor p7 5NTR hough with lower affinity. The response to individual neurotrophins does, however, vary substantially between neuronal subtypes [38].
Glial cell line-derived neurotrophic factor (GDNF), along with the molecules neurturin, artemin, and persephin compose a distinct group of neurotrophic factors.
GDNF acts through a receptor complex involving GNDF family receptor and rearranged
during transfection (RET) Trk, with subsequent effects of promoting neuronal survival and axonal regeneration. GDNF has demonstrated particular benefit for survival of motoneurons and dopaminergic neurons, making it a therapeutic candidate for amyotrophic lateral scleroris and Parkinson's disease [38].
Members of the fibroblast growth factor (FGF) family have also been shown to enhance neuronal survival and neurite outgrowth. FGFs can have several distinct effects, such as maintaining calcium homeostasis, regulating enzymes involved in neutralizing reactive oxygen species, and stimulating anti-apoptotic pathways. Further, the FGF-2 (also known as basic FGF) is a mitogen that appears to be important in preventing differentiation of neural (and other) progenitors and maintaining their multipotency [38].
Ciliary neurotrophic factor (CNTF) is another molecule with demonstrated neuroprotective effects [38].
1.4 Injuries to the Central Nervous System
1.4.1 Traumatic Brain Injury: Non-penetrating
Traumatic brain injury (TBI) presents a significant cause of morbidity and mortality in military conflicts and also in the civilian sector. Roadside bombs and improvised explosive devices in Iraq and Afghanistan have made TBI an increasingly
common problem, with few good treatment options. The severity of TBI can range from mild injuries imperceptible by standard imaging modalities, to penetrating injuries
causing extensive hemorrhage and loss of brain tissue. From an interventional
standpoint, closed head injuries present a difficulty in administering treatment. While considerable work remains in understanding the pathophysiology of such injuries, there is a challenge in determining whether a potential therapy should be administered directly via surgery, or peripherally. Peripheral administration requires that the agent can cross the blood-brain barrier, a topic of considerable pharmacological research. Surgery, on the other hand, presents obvious risks and complications that may outweigh the potential benefit of the therapy.
1.4.2 Traumatic Brain Injury: Penetrating
Penetrating brain injury may be more amenable to therapy administered
surgically, due to the fact that surgical intervention is often acutely necessary after the injury. While PBI has unique characteristics not found in closed head injuries, there are similarities particularly in the secondary injury response that may be applicable to other TBI scenarios, as well as ischemic or hemorrhagic insults. By studying potential
implantable therapeutics in a model of PBI, one can begin to assess whether such options would be of sufficient benefit to warrant surgical intervention in other CNS lesions.
When relatively high velocity objects enter the brain in a PBI, they create a complex wound resulting largely from radial dissipation of the projectile's kinetic energy. Tissue surrounding the projectile track is rapidly compressed, leading to the formation of a temporary cavity larger than the actual projectile. The projectile injury track is thus
surrounded by a significantly larger amount of injured tissue as a result of the temporary cavity [39]. While the tissue associated with the permanent injury track of the projectile has generally been destroyed, the surrounding peri-lesional area may potentially be salvageable if an appropriate therapy were applied soon enough [40].
The initial mechanical insult of a penetrating brain injury causes disruption of membranes associated with blood vessels, cell bodies, and axons. A large degree of hemorrhage rapidly ensues and intracellular contents of damaged neurons and glial cells are released. The loss of blood supply associated with damaged vessels causes metabolic and ischemic stress to areas of surrounding tissue, while the release of intracellular contents produces an extracellular ionic imbalance (Ca2+, Na*, K*), contributing to diffuse axonal injury. Breakdown of axons leads to release of myelin components that act to inhibit potential regeneration [41].
Release of cytokines, as well as breakdown of the blood-brain-barrier, causes a large inflammatory response consisting of both resident microglia and peripheral leukocytes. Reactive astrocytes proliferate and surround the injury site, creating a glial scar both with their cell bodies and production of axon-inhibitory extracellular matrix
(ECM) molecules. With time, a delayed degeneration of axons and neuronal cell bodies
remote from the lesion occurs, possibly as a result of lost synaptic targets and retrograde degeneration from sites of axonal injury. It is also thought that myelin proteins may play a role in remote degeneration in the thalamus. Electrophysiological abnormalities ensue and functional deficits become apparent depending on the location and extent of injury. At the injury site, debris and dead cells are eventually cleared and a permanent cavity
remains [42, 43]. Bone and metal fragments remaining in the brain pose a serious risk for infection and seizure.
It has also been suggested that the pressure wave during PBI damages axons that connect to brainstem respiratory centers, leading in some cases to apnea and subsequent death [44].
Treatment options are limited in PBL. Surgical intervention typically involves debridement of necrotic tissue and removal of accessible bone and metal fragments [45]. In many cases, risk of damaging functional brain tissue precludes the removal of all fragments. In these cases, there exists no broad consensus on how aggressively to pursue the removal of embedded fragments [46]. However, recent advances in image-guided surgery present possibilities for improved removal techniques to safely eliminate as much foreign matter as possible from the brain [47]. With better imaging, the surgeons can choose less destructive paths for accessing fragments and potentially minimize damage to viable tissue.
Given the temporal limitations in getting patients, particularly in military settings, to surgery, it is a major challenge to devise an appropriate treatment for the acute injury phase. Although significantly mitigating the primary injury process may not be currently feasible, there may be a great deal that can be done to limit secondary tissue damage. While it has been shown that degeneration of both white and gray matter persists long after traumatic brain injury [48], there are currently no effective pharmacological agents or surgical therapies to significantly disrupt this process. Implantation of a biomaterial or other drug-delivery agent during the time of surgery may allow damaged or ischemic
neural cells to survive. Further, promoting axonal regeneration may prevent the loss of additional neurons by allowing the reestablishment of synapses disrupted by the lesion.
1.4.3 Ischemic Stroke
Ischemic stroke is caused by an interruption of blood supply to the brain, often as a result of thrombosis or embolism. Death of neurons occurs rapidly in the absence of oxygen, leading to permanent neurological damage depending on the duration before reperfusion can be established. While a particularly region of the brain may be damaged beyond repair, there is often a region of ischemic tissue referred to as a penumbra that may be viable with appropriate intervention. For this reason, it is imperative that
treatment is sought as soon as possible after recognition of the event. The penumbra and areas more remote from the region are susceptible to further injury and neuronal
degeneration [49]. Neuroprotective agents that may improve the amount of spared tissue and decrease remote degeneration are thus a topic of intense research. The complexity of this goal is emphasized by the fact that numerous clinical trials to date have not shown benefits for neuroprotective drugs [50].
The design and application of such therapies depends on knowledge of how ischemia leads to neuronal cell death and degeneration. The ischemic cascade begins with reduction of ATP production due to loss of the oxygen supply. Without adequate energy supplies, ATP-dependent ion pumps fail, disrupting the regular ionic balance and cell potential. Influx of calcium leads to release of glutamate, which excites other cells and results in an even greater calcium influx and eventually more glutamate release. The result of this uncontrolled positive feedback is excitotoxic damage from production of
calcium dependent enzymes. Breakdown of the cell membrane leads to influx of extracellular ions and molecules, and also to release of intracellular contents that further alter the extracellular environment [51].
Application of a biomaterial supplemented with neuroprotective agents and perhaps neural progenitor cells may have the potential to reduce secondary injury and promote regeneration.
1.4.4 Hemorrhagic Stroke
Many of the pathophysiological effects are similar in ischemic and hemorrhagic stroke, but hemorrhagic events tend to be significantly more severe. In addition to the potential for dangerous rises in intracranial pressure due to hematomas, hemoglobin in the blood is cytotoxic and may cause increased neuronal death [52]. Delivery of neuroprotective therapeutics and agents to neutralize hemoglobin toxicity may help clinical outcome.
1.4.5 Spinal Cord Injury
Spinal cord injuries affect several million people worldwide, with a wide range of severities including debilitating conditions like quadriplegia and diaphragm paralysis. Such injuries can result from contusion, compression, and partial or complete severing of the cord [53]. Pathophysiological events include the death of neuronal cell bodies at the injury site, remote degeneration of neurons whose axons have been severed, myelin breakdown, severe inflammation, and formation of a glial scar [54]. As with injuries to
the brain, combinatorial therapies involving biomaterials, cells, growth factors, and antagonists to inhibitory molecules offer significant promise for restoring function.
1.5 Neurodegenerative Diseases
1.5.1 Parkinson's
Parkinson's disease is characterized by loss of dopaminergic neurons of the substantia nigra region of the basal ganglia. These neurons play a direct role in regulation of the striatum as part of the direct and indirect basal ganglia pathways. These pathways contribute to control of cortical excitation through the thalamus, modulating voluntary movement. Pharmacological therapy currently involves administration of L-Dopa, a dopamine precursor that can cross the blood-brain barrier before being metabolized to dopamine. While this helps to control symptoms, it does not stop the progressive loss of the dopaminergic neurons. Alternative therapies are aimed at alterations of the basal ganglia pathways by surgical lesions or an implantable deep brain stimulation device. Cell replacement is a promising therapeutic approach for Parkinson's, as significant progress has been made in directing stem/progenitor cells to differentiate into
dopaminergic neurons [55]. Developing a viable dopaminergic cell-scaffold construct for implantation into the substantia nigra could be a potentially beneficial therapeutic
strategy.
Alzheimer's disease is a common form of dementia that is characterized by the loss of cortical neurons and degeneration in various other brain regions. In addition to marked cortical atrophy, histological analysis of Alzheimer's brains shows accumulation of amyloid plaques and neurofibrillary tangles. Plaques consist of beta amyloid peptides that improperly accumulate due to abnormal folding. Research into the processing and function of amyloid precursor protein (APP) will aid in the understanding of how amyloid plaques form. Therapeutic approaches are aimed at reducing beta amyloid accumulation, though a long-term goal may also be to regenerate lost cortical neurons. Interestingly, it has been found that APP associates physically with the Nogo receptor
[56].
1.5.3 Huntington's
Huntington's disease is an autosomal dominant genetic neurological disease that results in an abnormal movement disorder (chorea) and decline in cognitive ability. The disease is caused by a mutation of the Huntingtin gene such that it contains an
abnormally large number of trinucleotide repeats [57]. The resulting mutant protein accelerates degeneration of certain subpopulations of neurons in the striatum, frontal cortex, and temporal cortex. Astrogliosis is apparently also increased. While gene therapy may present the best hope for a comprehensive cure, neuroprotection or regeneration of some affected neuronal populations may be a more feasible goal in the shorter term.
1.5.4 Amyotrophic Lateral Sclerosis (ALS)
ALS, also called Lou Gehrig's disease, is characterized by the progressive
degeneration of cortical motoneurons. Early symptoms consist of muscle weakness or speech difficulties, but progress eventually to major problems with limb movement and severe muscle atrophy. While the cause is unknown in most cases, a small subset of patients have a genetic form of the disease correlated with a mutation in the superoxide dismutase (SOD1) gene [58]. Potential therapies are aimed at preventing motoneuron degeneration by controlling glutamate release and associated possible excitotoxic effects. Novel neuroprotective agents combined with cell replacement therapy may present effective future strategies.
1.5.5 Multiple Sclerosis
Multiple scleroris (MS) is an autoimmune disease that results in demyelinatin of white matter in the CNS. Demylinated axons have poor conduction capabilities, and as a result virtually any neurological symptom may be present. While some degree of
remyelination takes place, particularly in early stages of the diseases, the disease affects oligodendrocytes to a degree that they cannot adequately keep up with the loss of myelin. Therapeutic approaches have included the use of anti-inflammatory medications and immunosuppressants. Cell therapy to promote remyelination is an area of significant research for developing a potential future treatment [59].
FTD is a dementia characterized by degeneration of neurons in the frontal and sometimes temporal lobe of the brain [60]. Symptoms of the disease can include lethargy and apathy, or alternatively disinhibition resulting in inappropriate social behavior. While there is no known common cause, some cases appear to be genetic. Therapeutic options are currently extremely limited. Neuroprotective agents or cell replacement may in the future be able to prevent progression of the disease if applied in the early stages.
1.6 Central Nervous System Tissue Engineering
Regeneration of the Central Nervous System is extraordinarily difficult relative to other tissues due its enormous complexity and the abundance of inhibitory factors. Given the variation between regions of the brain and the spinal cord, there is unlikely to be a single therapeutic approach for all problems. To replace a neuronal population with cells of the same subtype and guide them to reestablish connections similar to those lost would be a monumental feat.
1.6.1 Goals in the Field
CNS tissue engineering strategies currently are not necessarily aimed at trying to
produce tissue indistinguishable from that which was initially lost, though this remains a long-term goal. At the present time, one can broadly categorize the desired outcomes as cellular replacement, axonal regeneration, and collateral sprouting.
Cellular replacement in some cases is aimed at replacing a particular population of lost neurons or glial cells, depending on the injury or disease. An example would be