HAL Id: hal-00667994
https://hal.archives-ouvertes.fr/hal-00667994
Submitted on 8 Feb 2012
HAL is a multi-disciplinary open access
archive for the deposit and dissemination of
sci-entific research documents, whether they are
pub-lished or not. The documents may come from
teaching and research institutions in France or
abroad, or from public or private research centers.
L’archive ouverte pluridisciplinaire HAL, est
destinée au dépôt et à la diffusion de documents
scientifiques de niveau recherche, publiés ou non,
émanant des établissements d’enseignement et de
recherche français ou étrangers, des laboratoires
publics ou privés.
A framework for the objective evaluation of
segmentation algorithms using a ground-truth of human
segmented 3D-models
Halim Benhabiles, Jean-Philippe Vandeborre, Guillaume Lavoué, Mohamed
Daoudi
To cite this version:
Halim Benhabiles, Jean-Philippe Vandeborre, Guillaume Lavoué, Mohamed Daoudi. A framework
for the objective evaluation of segmentation algorithms using a ground-truth of human segmented
3D-models. IEEE International Conference on Shape Modeling and Applications (SMI), Jun 2009,
Beijing, China. pp.Session 5. �hal-00667994�
IEEE INTERNATIONAL CONFERENCE ON SHAPE MODELING AND APPLICATIONS (SMI) 2009 1
A framework for the objective evaluation of segmentation
algorithms using a ground-truth of human segmented 3D-models
H. Benhabiles1, J-P. Vandeborre1,2, G. Lavou´e3, M. Daoudi1,2 1LIFL (UMR USTL/CNRS 8022), University of Lille, France
2Institut TELECOM ; TELECOM Lille 1, France
3University of Lyon, CNRS, INSA-Lyon, LIRIS, UMR5205, F-69621, France
Abstract—In this paper, we present an evaluation method of 3D-mesh segmentation algorithms based on a ground-truth corpus. This corpus is composed of a set of 3D-models grouped in different classes (ani-mals, furnitures, etc.) associated with several manual segmentations produced by human observers. We define a measure that quantifies the consistency between two segmentations of a 3D-model, whatever their granularity. Finally, we propose an objective quality score for the automatic evaluation of 3D-mesh segmentation algorithms based on these measures and on the ground-truth corpus. Thus the quality of segmentations obtained by automatic algorithms is evaluated in a quantitative way thanks to the quality score, and on an objective basis thanks to the ground-truth corpus. Our approach is illustrated through the evaluation of two recent 3D-mesh segmentation methods.
Keywords—3D-mesh; segmentation; evaluation; ground-truth
1. INTRODUCTION
Mesh segmentation consists in decomposing a polyg-onal surface into different regions (i.e. connected set of vertices or facets) of uniform properties, either from a geometric point of view or from a semantic point of view. This operation has become a necessary pre-processing step for many applications such as shape modeling [1], compression [1], deformation [2], texture mapping [3], etc.
According to recent states-of-the-art [4], [5], mesh segmentation techniques can be classified into two cat-egories: surface-type (or geometric) methods and part-type (or semantic) methods. In the first case, the al-gorithms are based on low level geometric information (e.g. curvature [6]) in order to define segments (i.e. regions) with respect to geometric homogeneity, while in the latter case, the algorithms aim at distinguishing segments that correspond to relevant features of the shape, by following higher level notions such as defined in human perception theory [7]. This kind of approach is particularly suited for object animation / deformation and indexing applications, where the decomposition has to be meaningful.
In the literature, there exist a huge number of seg-mentation algorithms for both approaches (surface-type
and part-type) allowing the processing of 3D-meshes [4], [5]. For the first approach (surface-type) some tools exist for quantifying the quality of the segmentation however they are linked to some specific applications like texture mapping [8] or medical imaging [9]. The fact is that no automatic tool has been proposed to evaluate segmentation algorithms (especially part-type ones) in a general purpose context, although, this task is not only necessary for researchers to compare a new algorithm to those already existing, but also for users so as to choose an algorithm and fix its parameters depending on the problem to solve.
The question of the evaluation of these part-type segmentation algorithms is quite critical, in order to produce better methods. Whereas compression or recog-nition algorithms are quite easy to evaluate thanks to compression ratio or misclassification probability, this task is far more difficult to handle for segmentation (and particularly semantic segmentation). Typically re-searchers exhibit some results for several models and just point out why their results look “good”.
Attene et al. [5] have proposed some criteria like the aspect of the boundaries (smoothness, length), the hierarchical / multi-scale properties, the robustness, the complexity and the number of parameters. However these criteria rather judge some technical points than the real quality of the techniques themselves. As it is raised by the authors, the main problem is that the objective quality of a segmentation of a given model is quite difficult to define, since it depends on the viewer’s point of view and knowledge. Moreover many authors argue that a segmentation quality is theoretically impossible to evaluate objectively because it depends only on the desired application. Indeed the desired task is of course of importance. For instance a structural recognition application does not need the same segmen-tation than a mesh simplification task. An alternative solution, which was also suggested by Attene et al. [5] is to compare the algorithm’s results with manual seg-mentations produced by human subjects (i.e. a ground-truth). The objective is thus to capture the semantic and cognitive behavior of the user regarding 3D graphics. It is obvious that this framework will not be suited for evaluating the segmentations within certain specific applications (medical, texture mapping, etc.). However for many applications (e.g. animation) researchers aim to obtain such semantic decomposition. Thus our objective
is rather to focus on the evaluation of such semantic (i.e. part based) methods. This kind of ground-truth-based evaluation was investigated in the field of 2D-image [10]. Of course, the ground-truth can depend also on the application.
This question of objective evaluation of segmentation is the main motivation of this paper, which introduces three main contributions. Firstly, we propose a ground-truth corpus, composed of a set of 3D-models associated with several manual segmentations produced by human observers. Secondly, we propose some objective dissimi-larity measures which provide a quantitative comparison between two segmentations of a 3D-model. Thirdly, we define an automatic protocol for the calculation of an objective quality score for the evaluation of 3D-mesh segmentation algorithms based on these objective measures and on the ground-truth corpus.
This work is done within the framework of the MADRAS project (3D Models And Dynamic models Representation And Segmentation) supported by the French Government Research Department. The ground-truth corpus is available for download for the scientific community, on the project website1.
This paper is organized as follows. In section 2, we provide a review of the state-of-the-art of segmentation evaluation. In section 3, we detail the construction of the ground-truth corpus. In section 4, we define two mea-sures that compute the discrepancy (i.e. the dissimilarity) between two segmentations of a same object: a ground-truth segmentation and that obtained by an algorithm to evaluate, for instance, then we define an objective segmentation algorithm quality score. In section 5, our objective measures are firstly validated using the ground-truth corpus, then we demonstrate the usability of our whole evaluation protocol through the evaluation of two recent segmentation methods [6], [11]. Section 6 concludes the paper.
2. STATE-OF-THE-ART OF SEGMENTATION EVALUATION
Whereas almost nothing has been done by the scien-tific community regarding 3D-mesh segmentation eval-uation, several advanced works exist for the quality assessment of 2D-image segmentation.
2.1 Evaluation of 2D-image segmentation
Zhang [12] offers a study on the different methods proposed so far for evaluation of 2D-image segmenta-tion. According to Zhang, the different methods can be classified into three groups:
• Analytical methods: they directly treat the
seg-mentation algorithms themselves by taking into account principles, requirements, utilities, complex-ity, etc., of algorithms. Using analytical methods to evaluate segmentation algorithm avoids a concrete
1http://www-rech.telecom-lille1.eu/madras/
implementation of the algorithm. However, the real quality of these algorithms cannot be obtained by a simple analytical study.
• Empirical goodness methods: they evaluate the per-formance of the algorithms by judging the quality of the segmented images themselves. To achieve this task, a set of quality criteria has to be defined. These criteria are established according to human intuition about what conditions should be satisfied by an ideal segmentation. However it seems dif-ficult to establish quantitatively the quality of a segmentation only by using such a priori criteria.
• Empirical discrepancy methods: in this kind of methods, a set of reference images presenting the ideal segmentation is first of all built. This set of images which can be manually segmented by experts of the domain, constitutes a ground-truth. The purpose is to measure the discrepancy between the reference segmentation and that obtained by an algorithm to be evaluated. So, these methods try to determine how far a segmented image ob-tained by an algorithm is from one or several reference images. A large discrepancy involves a large segmentation error and thus this indicates a low performance of the considered segmentation algorithm.
The empirical discrepancy methods are the most pop-ular for 2D-image segmentation evaluation [10], [13], indeed they seem to be the most suited for a quantitative evaluation as the measures of quality can be numerically computed, and for an objective evaluation thanks to the ground-truth.
Martin et al. [10] have proposed such a method to evaluate image segmentation algorithms. They built a public database containing ground-truth segmentations produced by human volunteers for images of a wide variety of natural scenes. They also defined a measure based on the computation of refinement error of a pixel between two segments (i.e. regions) containing this pixel.
2.2 Evaluation of 3D-mesh segmentation
In the literature there exist some works proposing the assessment of segmentation in a specific context. In the MRI (Magnetic Resonance Imaging) field for example, Gerig et al. [9] propose a tool that quantifies the segmen-tation quality of 3D-images (volumetric images) includ-ing different shape distance metrics such as maximum Hausdorff distance, and mean/median absolute distance between object surfaces. For texture mapping, Sander et al. [8] introduce a metric based on the texture stretch induced by the parametrization of the segmented regions and allowing the evaluation of the segmentation quality. More recently a set of technical criteria was proposed by Attene et al. [5] but they rather fall in the empirical goodness methods. Lastly, Berretti et al. [14] have presented some experimental results which are based on a ground-truth to validate their own segmentation
algorithm. However, the ground-truth is not available on-line and according to the authors it contains very simple 3D-models (surfaces of revolution, vases, etc.). Their measure to compare two segmentations of a 3D-mesh is also a simple one. It is based on the area of regions and is not tolerant to refinement. Indeed the tolerance to refinement is an important property since it allows to distinguish between consistent and non-consistent segmentations. We can notice that the proposed solutions are either depending on the application context or do not reflect the real quality of the techniques themselves. Hence, the importance to propose a generic framework allowing an objective evaluation of segmentation algo-rithms.
3. GROUND-TRUTH CORPUS
We have created a ground-truth corpus available on-line2 for 3D-mesh segmentation evaluation. This
cor-pus contains twenty 3D-models (as polygonal meshes) grouped in five classes, namely animal, furniture, hand, humanand few-vertices. Each class contains four models as illustrated in figure 1.
Fig. 1. From top to bottom line: animal, human, furniture, few-verticesand hand classes.
The models come from the GAMMA3 database from
INRIA and from the Princeton Shape Benchmark [15], which are both public 3D-model databases.
2http://www-rech.telecom-lille1.eu/madras/?page id=108 3http://www-c.inria.fr/gamma/disclaimer.php
Note that it was crucial for our corpus, to present a high variety of models so as to be able to study properly the different segmentation algorithm’s behaviors while avoiding to privilege certain algorithms over others.
We have then conducted a large campaign of manual segmentation with human subjects.
3.1 Tool for manual segmentation
In order to easily collect manual segmentations from a wide range of people, we have used the MeshLab4 application; this software allows the processing of 3D-meshes, providing a set of tools for editing, filtering, inspecting, rendering and converting them. In particular it allows an explicit segmentation of models using colors.
Indeed, a virtual brush allows a human observer to colorize each vertex of the mesh to segment. Each segment (a set of vertices) is then distinguished from others by its associated color.
Using this application, anyone can segment models without having any prior skills in computer graphics. Moreover to accelerate the coloring process (which could be fastidious for complex models) and to make it easier, we have developed a color propagation algo-rithm allowing the user to only indicate the different boundaries between the different segments; the whole segments are then automatically filled by colors (see figure 2). Basically with this tool, between 5 and 10 minutes are necessary for an observer to segment a 3D-model.
Fig. 2. Automatic propagation of colors on the baby model. The user just need to color the boundaries of the regions that he wants to separate (left), our algorithm then automatically complete the coloring (right).
3.2 Segmentation protocol
In order to obtain a lot of ground-truth segmentations for the model corpus, we have made a large call to volunteers. They have freely segmented the models and no condition was imposed on the manner with which they had to do this task. The models were randomly assigned to each volunteer with a bias towards models that had been already segmented several times. Figure 3 illustrates some models with one of their associated ground-truth segmentation.
Fig. 3. Some ground-truth segmented models.
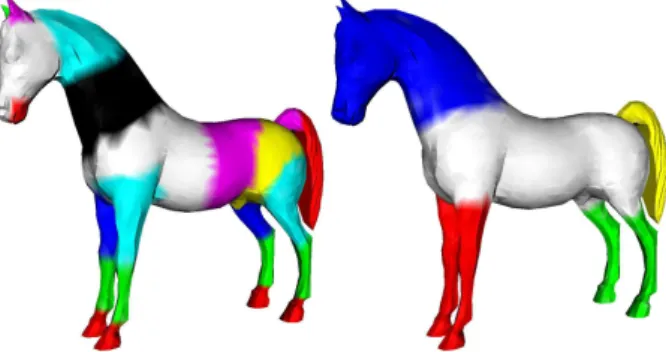
This ground-truth corpus is in a constant evolution in terms of number of models and number of segmentations per model. Having more than one segmentation per mesh is very important since two observers do not necessarily share the same opinion on the segmentation of a model. This is due to the lack of rules that define how to decompose an object into sub-objects: thus each observer can segment at different granularities for instance. Figure 4 illustrates an example of a 3D-model segmented by two different persons. One can notice that the first segmentation (on the left side) is nearly a refinement of the second one (on the right side).
Fig. 4. Manual segmentations of the horse done by two different persons.
The results presented in this paper have been gener-ated using our current version of the ground-truth corpus including 60 segmentations, 3 per model, done by 25 different subjects (staff members and PhD students from University of Lille and Insa-Lyon).
4. FROM DISSIMILARITY MEASURES TO OBJECTIVE QUALITY SCORE
The objective of such measures is to evaluate existing and future segmentation algorithms in a quantitative way and on an objective basis. This objective can be achieved by measuring the dissimilarity between the segmentations obtained by algorithms to evaluate and those of the associated ground-truth.
4.1 Segmentation dissimilarity measures
As mentioned in the state-of-the-art section, in the field of 2D-image, Martin et al. [10] have defined two measures based on the computation of refinement error of a pixel between two segments containing this pixel; they have then applied them to evaluate the performance of 2D-segmentation algorithms and have shown the relevance of the obtained results.
Hence we have generalized their dissimilarity mea-sures for 3D-mesh segmentation evaluation.
First of all, we formally define what is a segmentation of a 3D-mesh.
According to Shamir [4], let M be a 3D-mesh, and R the set of mesh elements; in our case these elements are the vertices viof M . A segmentation S of M is the
set of sub-meshes S = {M0, ..., Mk−1} induced by the
partitioning of R into k disjoint sub-sets of vertices. Similarly to the 2D measure from Martin et al. [10], we define the 3D local refinement error L3D. Let
S1 and S2 be two segmentations of a 3D-mesh M .
L3D(S1, S2, vi) is the local refinement error of a vertex
vi between S1and S2 defined as:
L3D(S1, S2, vi) =
|R(S1, vi)\R(S2, vi)|
|R(S1, vi)|
(1)
Where the operator \ denotes the set differencing , |x| the cardinality of the set x, and R(S, vi) the region
in segmentation S that contains the vertex vi, i.e. the
subset of vertices corresponding to a sub-mesh Mj of
S containing vi.
This local refinement error produces a positive real valued output that presents the ratio of the number of vertices not shared between the first segment and the second one.
The L3D is asymmetrically tolerant to refinement
since the error is null when segment S1 is a subset
(refinement) of segment S2.
We have to precise here that our measure consider that a segmented region is a set of vertices. We could have considered a segmented region as a set of facets (indeed, both definitions exist). We have chosen this kind of partitioning since it seems preponderant in the litera-ture [4]. However, our measure could be easily adapted to face-based methods; in that case the set differencing operator (equation 1) should take into account some kind of surfacic difference.
Given this L3D, there exist two ways to combine it
for all vertices into a global measure for the entire 3D-mesh [10]: the Global Consistency Error (GCE) and the Local Consistency Error (LCE).
The Global Consistency Error (GCE) forces all local refinements to be in the same direction and is defined as:
GCE(S1, S2) = 1 Nmin{ X i L3D(S1, S2, vi), X i L3D(S2, S1, vi)} (2)
The Local Consistency Error (LCE) allows for differ-ent directions of refinemdiffer-ent in differdiffer-ent segmdiffer-ents of the 3D-mesh: LCE(S1, S2) = 1 N X i min{L3D(S1, S2, vi), L3D(S2, S1, vi)} (3)
Where N is the number of vertices. For both the GCE and the LCE, a value of 0 indicates a complete similarity, whereas a value of 1 indicates a maximum deviation between the two segmentations being compared. It is clear that the GCE is a tougher measure than LCE since LCE ≤ GCE.
It is important to note that these measures are based on vertices and thus depend on the surface sampling. Indeed, the regions that have a high number of vertices will have a high effect on the consistency error whatever their area. However we do not consider this surface sampling dependence as a drawback since we suppose that in a correctly modelized object, the number of vertices well reflects the significance of the region.
Another important point to note is that there are two degenerative segmentations that achieve a GCE and a LCE score of zero: one vertex per segment, and one segment for the entire mesh. This is due to the tolerance of the measure toward refinement. However in prac-tice, as further experiments demonstrate, this measure has a quite good behavior, since we never meet such degenerate cases in standard 3D-mesh segmentation algorithms. Actually, the segmentations to be compared must have numbers of segments sharing the same orders of magnitude.
4.2 Quality score of a segmentation algorithm
GCE and LCE are dissimilarity measures between two segmentation results of a same object. Using these two measures, together with the ground-truth corpus, we now define two quality measures for automatically rating segmentation algorithms. These two metrics reflect the global quality of the considered segmentation algorithm when comparing its segmentation results to the whole ground-truth corpus.
Let GCEM(gi, S) be the Global Consistency Error
applied to a model M between a ground-truth segmen-tation giand the corresponding segmentation S obtained
by an automatic algorithm to evaluate. The per-model Global Consistency Error of a model M regarding a certain segmentation algorithm is then:
GCEM = 1 n X i GCEM(gi, S) (4)
Where n is the number of ground-truth segmentations associated to the model M .
Similarly, the per-model Local Consistency Error of a model M is: LCEM = 1 n X i LCEM(gi, S) (5)
Given these two measures (GCEM and LCEM),
we define the Global Consistency Score (GCS) for the algorithm to evaluate, that takes into account the N models from the ground-truth:
GCS = 1 − (1 N
X
i
GCEM) (6)
And the Local Consistency Score (LCS): LCS = 1 − (1
N X
i
LCEM) (7)
Both of these Scores quantify the global similarity between the results of the segmentation algorithm to evaluate and the ground-truth rather than dissimilarity. Hence they quantify the quality of the segmentation algorithms. They lie in the range [0, 1] with value of 1 indicating a perfect quality and a value of 0 indicating no correlation with the ground-truth.
5. EXPERIMENTS
We begin this section by validating our objective measures using the ground-truth corpus, then we present two segmentation algorithms [6], [11] and evaluate them using our whole evaluation protocol.
5.1 Validation of segmentation dissimilarity measures One way to attest the validity of our 3D segmentation dissimilarity measures, is to show that they provide low values when comparing ground-truth segmentations of a same object – namely consistent segmentations – and high values when comparing random segmentations of a same object. Hence we have compared the GCEM
and the LCEM distributions between these two kinds
of segmentation pairs, consistent and random.
For each model of the corpus, two random seg-mentations were generated by a simple and automatic algorithm: n seed vertices were randomly chosen on the object, then n connected regions were obtained by a simple region growing mechanism. Figure 5 shows some 3D-models of the corpus on which the random segmentation algorithm was applied.
Figure 6 illustrates the GCEM and the LCEM
dis-tributions of each model of the corpus for both kinds of segmentation (consistent and random). To compute the GCEM and the LCEM for the consistent segmentations
and, in order to be in agreement with our definitions of the GCEM and the LCEM, we considered the first
ground-truth associated to a given model as an automatic segmentation. Similarly, for the random segmentations,
Fig. 5. Random segmentations of some 3D-models of the corpus.
we therefore considered, the first random segmentation as an automatic segmentation and the second one as a ground-truth segmentation.
(a)
(b)
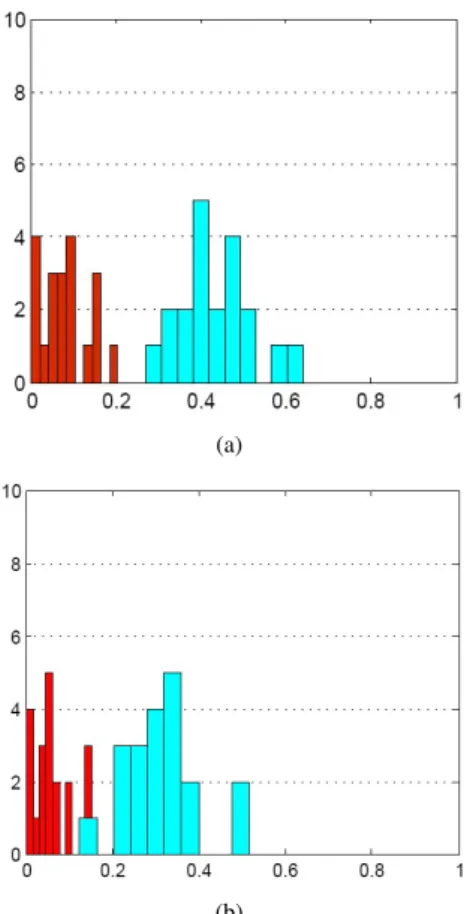
Fig. 6. Distributions of the GCEM(a) and the LCEM (b) for both
segmentation pairs (consistent in red color and random in blue color) over all 3D-models corpus (20 3D-models).
We can notice that for the GCEM (figure 6(a)), the
distances between consistent segmentations are close to zero. However, the random segmentation distances are localized around 0.4. Thus the error between segmen-tations produced by volunteers for a same 3D-model is significatively lower than the ones obtained between ran-dom segmentations. More precisely, the GCEM mean
for the consistent segmentations is 0.081 against 0.43 for the random segmentations. These results clearly validate the accuracy of the GCE measure for assessing segmentation dissimilarity, since they provide results
agreeing with the human opinion (the ground-truth). However, figure 6(b) shows that the LCE measure fails to distinguish clearly between random and consistent segmentations as some models share the same values of LCEM for both types (consistent and random).
5.2 Evaluation of two segmentation algorithms We apply here the quality metrics defined in section 4 to evaluate two recent segmentation algorithms [6], [11] of the state-of-the-art.
Tierny et al. [11] have proposed a part-type hierar-chical segmentation method based on the extraction of an enhanced topological skeleton. Globally, the skeleton is used to delimit the object core and to identify the junction surfaces. The result of this operation is a coarse segmentation which is refined following a hierarchical scheme defined with regard to the topology of the model. In figure 7(a), each node of the skeleton denotes a segment of the mesh. Each segment is distinguished by a color resulting in an over-segmentation of the object (figure 7(b)). A region merging algorithm based on the notions of core and junction areas is then applied to provide a hierarchical segmentation as illustrated in figure 7(c, d).
(a) (b) (c) (d)
Fig. 7. Hierarchical segmentation process proposed by Tierny et al. [11]: original skeleton graph (a), over-segmentation (b), coarse segmentation (c) and fine segmentation (d)) (from [11]).
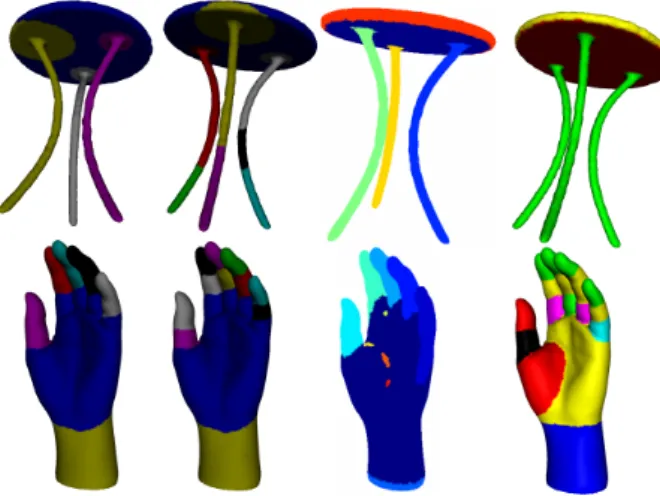
Lavou´e et al. [6] have rather proposed a surface-type segmentation method using a region growing algorithm. The curvature is first calculated for all vertices of the mesh, and classified into several clusters. A region growing mechanism then extracts connected regions (associated with similar curvature), starting from several seed-facets. Figure 8 illustrates some typical examples of results from this algorithm which is rather dedicated to CAD models.
To ensure a relevant comparison between these al-gorithms, we compute the GCEM and the LCEM for
every 3D-model of the corpus and each segmentation algorithm, and then their GCS and LCS.
The first experiment for the evaluation of the algo-rithms is illustrated in figure 9 that shows the GCEM
Fig. 8. Several segmentation results using the algorithm of Lavou´e et al. [6] (from [6]).
and the LCEM for each model of the corpus for each
al-gorithm and also for random segmentations. The values are sorted in increasing order for each algorithm, hence the jth model may not be the same across algorithms. This kind of graph was already applied for segmentation evaluation in the field of 2D-image [13].
(a)
(b)
Fig. 9. GCEM (a) and LCEM (b) sorted in increasing order over
all the corpus models.
The graph in figure 9(a) demonstrates that algorithms from Tierny et al. [11] and Lavou´e et al. [6] are both significatively better than the random segmentation regarding their ability to produce segmentations that are consistent with the ground-truth. It is interesting to see that the GCE measure is able to well differentiate the different methods: Tierny, coarse segmentation is clearly better than Lavou´e. This discriminating capacity is much weaker in the case of the LCE (see figure 9(b)).
The second experiment consists in comparing, for the
different algorithms, the global and per-class GCS and LCS. Tables 1, 2, 3 confirm that the algorithm which gives the best results is the one proposed by Tierny et al. [11], more precisely the coarse segmentation since it has the highest values for both GCS and LCS. However, once again, except the random segmentation, LCS scores (see table 3) are very close to each other, that confirms that this measure owns a quite low discriminating power. Besides, the GCS scores are close to 1, we can conclude that the segmentations obtained by both automatic algo-rithms are of accurate quality.
Class Tierny, coarse Tierny, fine Lavou´e Random Animal 0.80 0.79 0.76 0.60 Human 0.82 0.75 0.75 0.60 Furniture 0.89 0.88 0.88 0.59 Few-vertices 0.86 0.85 0.83 0.50 Hand 0.81 0.80 0.75 0.53 TABLE 1
SUMMARY OF THE PER-CLASSGCSOF EACH ALGORITHM.
Class Tierny, coarse Tierny, fine Lavou´e Random Animal 0.85 0.84 0.84 0.69 Human 0.86 0.84 0.87 0.72 Furniture 0.92 0.92 0.93 0.69 Few-vertices 0.88 0.89 0.86 0.62 Hand 0.87 0.86 0.83 0.67 TABLE 2
SUMMARY OF THE PER-CLASSLCSOF EACH ALGORITHM.
Algorithm GCS LCS Tierny [11], coarse 0.83 0.88 Tierny [11], fine 0.81 0.87 Lavou´e [6] 0.79 0.87 Random 0.57 0.68 TABLE 3
SUMMARY OF THE GLOBALGCSANDLCS.
To explain the difference between Tierny et al. [11] and Lavou´e et al. [6] algorithms, we present in figure 10 two models of the corpus with their segmentations obtained by both algorithms and one of their associated ground-truth.
From a global point of view, the obtained segmenta-tions are correct for both algorithms since they basically follow the ground-truth. However, it is clear that if we take into account the detail of each segment and the continuity of its boundaries, then Tierny et al. [11] al-gorithm gives the best segmentation for the hand model while Lavou´e et al. [6] algorithm is better for the table model. This segmentation difference is straight since the algorithms belong to different segmentation classes: part-type for Tierny and surface-type for Lavou´e. It is interesting to observe that this class difference appears on the per-class GCS results (see table 1): segmentation
Fig. 10. Different segmentations of the table and hand models. From left to right: Tierny et al. [11] coarse version, Tierny et al. [11] fine version, Lavou´e et al. [6] and the ground-truth.
results from Lavou´e et al. [6] algorithm are very good for the furniture and few-vertices classes which contain mechanical or non-organic pieces which are rather seg-mented in a geometric manner (i.e. surface-type) by the human observers. On the other hand, results from Tierny et al. [11] algorithm are significatively better for human, hand and animal classes which are rather segmented in a semantic way by the observers.
6. CONCLUSION AND FUTURE WORK
In this paper, we presented a fully automatic protocol for the quantitative evaluation of 3D-mesh segmentation algorithms. The protocol is based on a ground-truth corpus, allowing an objective evaluation. We made the following contributions: (1) We built a ground-truth cor-pus available on-line. This corcor-pus is composed of a set of 3D-models associated with several manual segmen-tations produced by human observers. (2) We proposed two measures that quantify the consistency between two segmentations of a 3D-model. These measures are based on the computing of the refinement error of a vertex between two segments containing this vertex, similarly to the work of Martin et al. [10] for 2D segmentation evaluation. (3) Based on these measures and on the ground-truth corpus, we proposed an objective score that reflects the global quality of an automatic segmentation algorithm.
To demonstrate the usability of this evaluation frame-work, we performed a detailed comparison between two recent segmentation algorithms: Tierny et al. [11] algorithm and Lavou´e et al. [6] algorithm.
Currently, we are still working on the enlargement of the corpus in terms of number of models and ground-truth. We also plan to integrate the results of other segmentation algorithms applied to this corpus to offer a wealthier comparison and a more relevant analysis. Our objective is that the corpus and the evaluation methods become a valuable tool for the scientific community.
We also would like to define new measures according to the family of shapes (CAD-CAM shapes or natural
shapes) and for a given application context such as segmenting for partial indexing for instance. Moreover, an interesting property that such measures would possess is the robustness to surface sampling in order to allow a valid comparison between segmentations of a same object with different sampling.
An other interesting point will be to integrate the user’s opinion to judge which segmentation is the best, then compare this subjective evaluation of the observer to our evaluation protocol.
ACKNOWLEDGMENTS
This work is supported by the ANR (Agence Na-tionale de la Recherche, France) through MADRAS project (ANR-07-MDCO-015) and is partially supported by the CPER Nord-Pas-De-Calais Ambient Intelligence, France.
REFERENCES
[1] E. Zeckerberger, A. Tal, and S. Shlafman, “Polyhedral surface decomposition with applications,” Computers and Graphics, vol. 26(5), pp. 733–743, 2002.
[2] S. Katz and A. Tal, “Hierarchical mesh decomposition using fuzzy clustering and cuts,” ACM Transactions on Graphics (SIGGRAPH), vol. 22(3), pp. 954–961, 2003.
[3] A. Sheffer, E. Praun, and K. Rose, “Mesh parameterization methods and their applications,” Foundations and Trends in Computer Graphics and Vision (FTCGV), vol. 2(2), p. 64, 2007. [4] A. Shamir, “A survey on mesh segmentation techniques,”
Com-puter Graphics Forum, vol. 27, no. 6, pp. 1539–1556, 2008. [5] M. Attene, S. Katz, M. Mortara, G. Patan´e, M. Spagnuolo,
and A. Tal, “Mesh segmentation, a comparative study,” IEEE International Conference on Shape Modeling and Applications, pp. 7–7, 2006.
[6] G. Lavou´e, F. Dupont, and A. Baskurt, “A new cad mesh segmen-tation method, based on curvature tensor analysis,” Computer Aided Design, vol. 37(10), pp. 975–987, 2005.
[7] I. Biederman, “Recognition-by-compenents: A theory of human image understanding,” Psychological Review, vol. 94, pp. 115– 147, 1987.
[8] P. V. Sander, J. Snyder, S. J. Gortler, and H. Hoppe, “Texture mapping progressive meshes,” in SIGGRAPH 2001. ACM Press, 2001, pp. 409–416.
[9] G. Gerig, M. Jomier, and A. Chakos, “Valmet: A new validation tool for assessing and improving 3d object segmentation,” in MICCAI 2001: Fourth International Conference on Medical Im-age Computing and Computer-Assisted Intervention. Springer, 2001, pp. 516–523.
[10] D. Martin, C. Fowlkes, D. Tal, and J. Malik, “A database of human segmented natural images and its application to evaluat-ing algorithms and measurevaluat-ing ecological statistics,” International Conference On Computer Vision, vol. 2, pp. 416–423, 2001. [11] J. Tierny, J.-P. Vandeborre, and M. Daoudi, “Topology driven
3D mesh hierarchical segmentation,” in Shape Modeling Inter-national, Lyon, France, 2007.
[12] Y. J. Zhang, “A survey on evaluation methods for image segmen-tation,” Pattern Recognition, vol. 29(8), pp. 1335–1346, 1996. [13] R. Unnikrishnan, C. Pantofaru, and M. Hebert, “Toward objective
evaluation of image segmentation algorithms,” IEEE Transaction on pattern analysis and machine intelligence, vol. 29(6), pp. 929–944, 2007.
[14] S. Berretti, A. D. Bimbo, and P. Pala, “Partitioning of 3d meshes using reeb graphs,” in ICPR ’06: Proceedings of the 18th International Conference on Pattern Recognition, 2006. [15] P. Shilane, P. Min, P. Kazhdan, and M. Funkhoser, “The
prince-ton shape benchmark,” Shape modelling international, IEEE Computer, pp. 167–178, 2004.

![Fig. 8. Several segmentation results using the algorithm of Lavou´e et al. [6] (from [6]).](https://thumb-eu.123doks.com/thumbv2/123doknet/14374770.504934/8.892.98.437.103.212/fig-segmentation-results-using-algorithm-lavou-et-al.webp)