HAL Id: hal-01375603
https://hal.archives-ouvertes.fr/hal-01375603v2
Preprint submitted on 16 Dec 2016HAL is a multi-disciplinary open access archive for the deposit and dissemination of sci-entific research documents, whether they are pub-lished or not. The documents may come from teaching and research institutions in France or abroad, or from public or private research centers.
L’archive ouverte pluridisciplinaire HAL, est destinée au dépôt et à la diffusion de documents scientifiques de niveau recherche, publiés ou non, émanant des établissements d’enseignement et de recherche français ou étrangers, des laboratoires publics ou privés.
Behavioral Adaptation to Heat-Related Health Risks in
Cities
Martin Hendel, Karina Azos-Diaz, Brice Tremeac
To cite this version:
Martin Hendel, Karina Azos-Diaz, Brice Tremeac. Behavioral Adaptation to Heat-Related Health Risks in Cities. 2016. �hal-01375603v2�
Behavioral Adaptation to Heat-Related
Health Risks in Cities
Martin HENDEL1, Karina AZOS-DIAZ2,3, Brice TREMEAC3
1Univ Paris Diderot, Sorbonne Paris Cité, LIED, UMR 8236, CNRS, F-75013, Paris, France 2MANASLU Ing., Le Bourget-du-Lac, France
3Laboratoire de chimie moléculaire, génie des procédés chimiques et énergétiques (CMPGCE, EA7341) CNAM,
Paris, France
Abstract
Heat-related mortality is of growing concern for cities faced with the combined effects of increasing heat-wave frequency and intensity and stronger urban heat islands (UHI). In cities around the world, high air temperatures have been found to have strong repercussions in terms of heat-related mortality for populations aged 65 years and older, especially nighttime temperatures.
In response, many measures have been proposed to counteract the effects of UHI such as cool roofs and materials or urban greening. While these approaches are promising and are rightfully explored, behavioral adaptation measures have not received as much attention. Given the importance of nighttime temperatures on heat-wave mortality and the importance of sleep quality for individuals to recover from intense daytime heat exposure, adapting sleeping habits to reduce sleep time exposure to intense heat may help reduce the health impacts of heat-waves.
In this paper, outdoor and indoor temperature measurements conducted over the summer of 2015 in the bedrooms of two apartments in Paris, France are analyzed. The potential for this kind of behavioral adaptation to reduce occupant exposure to high sleep time temperatures is quantified and discussed. The policy implications of our findings and their practicality are also mentioned.
Keywords: climate change adaptation; urban heat; heat-waves; heat-related mortality; indoor temperature; sleep; behavioral adaptation.
Nomenclature
HEI heat exposure index [°C.h] MRT mean radiant temperature [°C]
UHI urban heat island
UTCI Universal Thermal Climate Index [°C]
1 Introduction
Climate change is expected to bring increases in the intensity and frequency of extreme weather events over the coming decades [1]. This is namely the case for heat-waves in many European cities including Paris, France [2]. This is a major concern given the severe health impacts of such events, especially for populations over 65 years of age, as witnessed during the 2003 heat-wave [3]. Recent work has demonstrated the negative role played by the urban heat island (UHI) effect during heat-waves, amplifying temperatures further and thus making cities even more vulnerable to extreme heat [4].
To address the impacts of heat-waves, extensive research has been conducted to develop countermeasures to UHI and to promote urban cooling. Such tactics typically involve the use of so-called cool materials and coatings on urban surfaces [5]–[9], or the use of vegetation in streets, parks and on building envelopes [10]–[12]. Implemented at sufficiently large scales, it is hoped that these solutions can reduce exposure to extreme heat.
While these solutions are promising and are rightfully explored, many are costly and slow to implement at large scales in existing cities and cannot be relied on to address short- to medium-term concerns. In addition, UHI countermeasures are only rarely assessed for their improvement of indoor conditions [13], although that is where people spend the vast majority of their time [14].
To date, few efforts have focused on the potential for behavioral adaptation to reduce the risks associated with heat-waves and UHI. Behavioral adaptation is an interesting prospect as it is often a simple,
the indoor setpoint temperature in winter on building energy consumption. Indeed, heating energy consumption can be immediately reduced by 7% for every 1°C-reduction in setpoint temperature without the need for any retrofitting.
This article sets out with a similar perspective for heat-waves, thus aiming to identify simple modifications of occupant behavior that might reduce the health impacts of heat-waves. Considering that the population most affected by heat-waves is that of persons 65 years of age and older and that night time temperatures affect heat-wave mortality the most due to their impact on sleep quality [15]–[18], we propose modifying occupant sleeping habits. By delaying the sleep period by one or two hours, we hope to reduce exposure of inhabitants to high indoor temperatures during their sleep. The upcoming analyses will be based on indoor temperature measurements conducted inside the bedrooms of two apartments with internal or external thermal insulation over the summer of 2015 in Paris, France. The potential for the proposed modifications in sleeping habits to limit exposure to indoor heat and consequently heat-wave mortality and health impacts will be discussed.
2 Materials and Methods
2.1 Heat Exposure Index (HEI)
As mentioned in the introduction, we focus on the sleep-time exposure of persons 65 years and older to high indoor temperatures. This choice is justified by the higher impact of minimum temperatures, reached at night, on heat-wave mortality compared to maximum temperatures, reached during the day. This higher impact has been interpreted as being the consequence of high night time heat on sleep quality, crucial to the proper recovery from daytime exposure to intense heat [13], [15]–[18]. Indeed, sleep quality and body temperature regulation are closely linked [19].
As a result of this choice, we must first determine the time period during which most of our target population is sleeping. While precise and relevant activity schedules may exist, we choose to simply assume an 8-hour night spanning from 11 pm to 7 am. Although this may be a crude estimation, it will allow us to reasonably estimate and discuss the impact of behavioral change on sleep-time exposure to intense heat.
2.1.1 Indoor air temperature
Next, we must determine an appropriate exposure index. Ideally, a thermal model of the human body should be used to determine the thermal stress level of the studied individuals, combined with an exposure-health effect response curve. Although such information may be available, as a first approach we choose to focus on the duration of exposure to indoor air temperatures above 26°C between 11 pm and 7 am local time.
We briefly discuss the selected threshold temperature. While health-relevant outdoor temperature thresholds can easily be chosen from the existing literature relating extreme heat to mortality or morbidity [20], very few studies have sought similar temperature thresholds for indoor environments [21]–[24]. Guidelines published by the World Health Organization indicate maximum indoor temperatures of 24°C [25], though more recent work indicates thresholds of 26°C or more depending on the room considered and their air movement (e.g. use of fans) [26]. For lack of better information, we choose a threshold of 26°C.
Such an index makes sense firstly because sleep is typically an indoor activity. Furthermore, it is intuitive to proceed in such a fashion and the resulting index is very similar to the “cooling degree hours” (CDH) used for building cooling load quantification with a setpoint temperature of 26°C, often found in the literature or in building energy regulations [27].
Although the resulting index is imperfect and imprecise from a thermal heat stress perspective, it can be readily modified to a more appropriate setpoint temperature or used with an equivalent temperature obtained from a more accurate or relevant thermal stress model.
Our Heat Exposure Index (HEI) is defined as follows, with 𝑇"#$%&'($ = 26°𝐶:
𝐻𝐸𝐼 = 𝑇'(1&&2"− 𝑇"#$%&'($ 4
567889:;4:<=>856=𝑑𝑡
A CD
In addition to the intensity of heat exposure – measured by HEI – it is also interesting to measure the length of time during which indoor temperatures exceed the setpoint temperature. Indeed, this indicator will help determine if the proposed scenarios mainly impact the frequency of exposure to high temperature or its intensity.
2.1.2 Occupant heat stress
Similarly, to better reflect exposure to heat stress, we also monitor the period of time during sleep spent above a certain Universal Thermal Climate Index (UTCI) equivalent temperature threshold. We chose UTCI because it is being increasingly adopted by the scientific community for evaluating thermal stress levels, ensuring comparability with existing and future studies [11], [28], [29]. However, the proposed method is not index-specific and alternative indices could have been used, such as Perceived Temperature (PT) or Physiological Equivalent Temperature (PET).
Regardless which index is used, thermal comfort estimation requires information on air temperature and humidity as well as the radiative environment and air movement. For air temperature and relative humidity, bedroom measurements are used. For wind speed and mean radiant temperature (MRT), which were not measured, we assume the minimal value (0.5 m/s) for 10-m wind speed and a MRT equal to air temperature.
The assumed wind speed value is that of the UTCI reference conditions and is the minimum value that can be computed with the fast-calculation developed by Bröde et al. [30]. MRT equal to air temperature is representative of a room where the walls and air are in or near thermal equilibrium. While air and wall temperatures are in reality constantly fluctuating, this assumption seems valid for nighttime. Given our assumptions, which set identical wind speed and MRT to those of the UTCI reference conditions, the only distinguishing variable between UTCI and air temperature is relative humidity.
It should also be noted that UTCI makes assumptions for clothing and metabolic activity, i.e. European clothing habits and the metabolic activity of a pedestrian walking at a speed of 4 km/h, i.e. 2.3 Met [31]. These assumptions merit a short discussion. In reality, it is unlikely that sleeping occupants are dressed the same way as when outdoors and their thermal insulation is also modified by the type of bedding they use [32]. Furthermore, the metabolic rate during sleep is 0.7 Met, i.e. more than three times lower than that assumed [33]. However, the relative wind speed would also be much lower than the assumed 1.4 m/s. These two errors tend to compensate for each other, though they may not cancel out. The error made for clo values is hard to quantify a priori. We now proceed to select an appropriate UTCI threshold with these shortcomings in mind.
Lemonsu et al. have used a similar approach to evaluate indoor thermal heat stress under different idealized heat-waves in Paris [28]. This analysis was conducted with a UTCI threshold of 32°C, i.e. strong or greater heat stress. This threshold was used for simulated heat-waves with maximum temperatures of 34°C to 46°C over 3 to 38 consecutive days. We select a threshold of 26°C, i.e. a state of moderate or greater heat stress, as UTCI in the considered bedrooms does not exceed 32°C over the study period. To evaluate the effect of different sleeping habits, we now formulate our control and case scenarios.
2.2 Sleeping Habit Scenarios
Indoor temperatures, as a result of building thermal inertia, have lower amplitude than outdoor temperatures and are skewed by a one- to two-hour hysteresis lag. Consequently, maximum and minimum indoor temperatures are often reached a few hours later than outside temperature. As a result, indoor temperatures may still be high when inhabitants go to sleep, having only had a few hours to begin their evening decrease. In response, we compare HEI for three different sleeping-habit scenarios: S0, S1 and S2. Each scenario considers an 8-hour long sleep, but with different bedtimes, respectively delayed by 0, 1 and 2 hours from a base case of 11 pm to 7 am. The proposed sleep time adjustments are perfectly equivalent to changing time zones.
Scenario S0 is the base case and corresponds to sleep from 11 pm to 7 am (equivalent to France’s Central Europe Summer Time (CEST), i.e. UTC+2). Scenario S1 considers a one-hour adjustment, i.e. 12 am to 8 am (equivalent to Central European Time (CET), i.e. UTC+1). Finally, in scenario S2, we consider the impact of a two-hour delay, i.e. 1 am to 9 am (equivalent to switching to Greenwich Meridian Time (GMT), i.e. UTC).
The time-zone-change format helps illustrate the impact of legal time zoning due to its discrepancy with local solar time. In France for example, CEST results in local legal time being approximately two hours ahead of local solar time, as shown in Figure 1. While this may offer late summer sunsets and has many practical implications for businesses, it may also have negative implications on sleep quality during heat-waves by advancing the beginning of sleep to a period where indoor environments remain near their daily maximum temperature. Other countries in Western Europe are also affected in this manner.
Figure 1: Difference between legal time and local mean time in Europe during the summer [34]. We now describe the site where measurements were made over the summer of 2015.
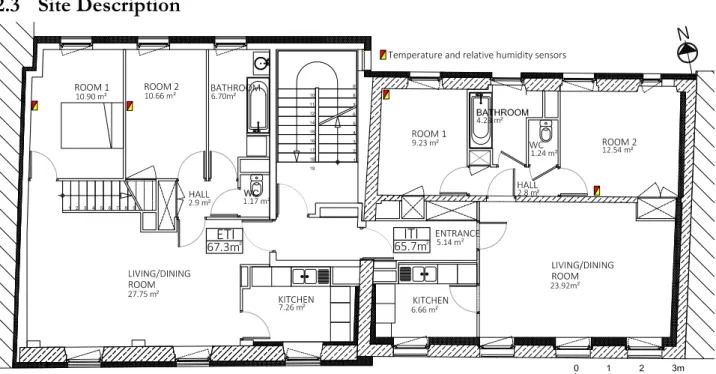
2.3 Site Description
Figure 2: Floor plan of ETI (left) and ITI (right). Red and yellow squares indicate the position of temperature sensors in the bedrooms.
Temperature measurements were conducted in two apartments located in a residential building in the 20th
Arrondissement in Paris, France. The building dates back to the 19th Century and has a thick limestone
façade. The two selected apartments experience identical external weather conditions: both are on the 3rd
floor and have the same orientation (Southwest). However, they have been renovated in different ways: one with internal thermal insulation (ITI) using mineral wool and the other with external thermal insulation (ETI) using polystyrene. These apartments are hereafter referred to as ITI and ETI, respectively, and their general layout is presented in Figure 2.
In addition to wall insulation, renovation work also included windows, mechanical ventilation and heating systems. It should be noted that although both apartments are subject to the same external conditions,
ETI is a duplex while ITI isn’t. As a result, ETI has a larger floor area (87.1 m²) than ITI (65.7 m²) and ETI’s third floor exchanges air with its fourth floor. This information is crucial when comparing the response of both apartments to external weather forcing.
For the reader’s information, the thermal properties of the façade materials are presented in Table 1 [35]. Table 1: Façade material properties [35].
Material Thermal Conductivity [W/m.K] Density [kg/m3] Specific Heat [J/kg.K]
Limestone 0.900 1,680 840
Polystyrene 0.036 35 1,400
Mineral Wool 0.038 140 840
Concrete Block 0.900 850 250
For the purpose of our study, indoor temperature data measured in the two 3rd-floor bedrooms (rooms 1
and 2) in both apartments will be used. These rooms are all sheltered from direct sunlight, facing towards the Northeast. For the calculation of HEI, we use hourly air temperature averaged between both bedrooms for each apartment.
2.4 Indoor Instruments and Study Period
Temperature sensors were positioned as described in Figure 2 (red and yellow squares) and began recording in April 2014 [35]. These sensors were carefully placed to avoid any direct solar radiation or any other heat sources. The monitoring system is composed of a Delta OHM wireless data logging HD35 and HD35AP radio frequency base unit. Table 2 shows the characteristics of the meteorological instruments used in our analyses.
Table 2: Instrument Characteristics [35]
Parameter Uncertainty Measurement Range Air temperature 0.20°C (0°C…60°C) -40°C…05°C Relative humidity 1.8% (0%…80%) 0%…100%
We focus on hourly measurements obtained from June 29th 11 pm until July 7th 10 pm. The selected
period is characterized by a heat-wave spanning from June 29th until July 4th, with three-day average
maximum and minimum temperatures reaching 31°C and 21°C or more, respectively. In order to account for building inertia, three additional days following the end of the heat-wave are included. The start of the study period is 11 pm to ensure that a whole number of nights is considered. It should be noted that both apartments were occupied over the course of the study period.
3 Results and Discussion
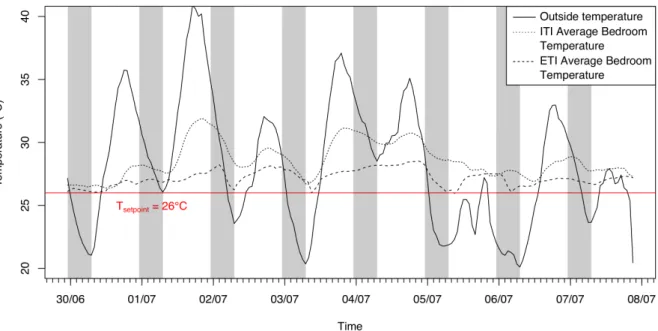
Figure 3 illustrates outside and indoor temperature measurements conducted over the study period. The setpoint temperature (26°C) is also illustrated as a horizontal red line. The sleep periods for scenario S0 are indicated in grey. Outside temperature serves to illustrate the duration and intensity of the heat wave being considered but is not meant to represent the immediate outdoor conditions of the study site which may differ greatly. These measurements were conducted 1.5 m above ground level approximately 2.5 km away from the study location in a dense urban location [36].
Figure 3: Outdoor and indoor air temperatures from June 29th 11 pm until July 7th 10 pm 2015
(UTC+2). The daily periods of sleep (11 pm to 7 am) are highlighted by light gray vertical bands. Over the course of the selected period, outside air temperature ranged from 18.3°C to 39.5°C, while average bedroom temperature ranged from 26.4°C to 31.9°C for ITI and from 26.0°C to 28.5°C for ETI. We immediately note that the amplitude of bedroom temperature is higher for ITI than for ETI. This is unsurprising given the differences in insulation strategies and apartment layout resulting in higher thermal inertia for ETI than for ITI.
As can be seen, indoor temperatures were always above the setpoint temperature, even during the three days following the heat-wave. Therefore, it is immediately apparent that scenarios S1 and S2 will have no impact on the duration of occupant exposure to sleep-time heat, but might be able to reduce its intensity. To assess this, we now calculate HEI over the period for both apartments.
Table 3 presents HEI obtained from average bedroom temperature from June 29th 11 pm until July 7th
10 pm 2015 for both apartments and all scenarios. As was the case for bedroom temperatures, the impact of the insulation strategies and layout is reflected in HEI, i.e. much greater for ITI than for ETI.
Table 3: HEI from June 29th 11 pm to July 7th 10 pm with 26°C setpoint and change from S0
Scenario
ITI ETI
HEI (°C.h) Difference from S0 (°C.h) HEI Difference from S0
S0 – Reference 166.4 - 72.8 -
S1 – One-hour delay 157.5 -5.3% 67.3 -7.6% S2 – Two-hour delay 148.4 -10.8% 62.4 -14.3%
As can immediately be seen, scenarios S1 and S2 result in lower HEI for both apartments compared to S0. Scenario S1 reduces HEI by 5.3% for ITI and by 7.6% for ETI, while S2 offers even greater reductions, reaching 10.8% for ITI and 14.3% for ETI. In both cases, obtained HEI reductions are greater for ETI than for ITI.
The beneficial impact of the one-hour (S1) and two-hour (S2) shifts is a result of the additional time they allow for the building to cool before occupants go to sleep. Indeed, while maximum outdoor temperature is reached at 6 pm or 7 pm (UTC+2) on all heat-wave days, the maximum average bedroom temperature is generally reached one to two hours later, between 8 pm and 9 pm. The indoor environment is therefore nearly at its maximum temperature when occupants go to bed. Delaying bedtime by one or two hours by
20 25 30 35 40 Time Temper ature (°C) 30/06 01/07 02/07 03/07 04/07 05/07 06/07 07/07 08/07 Outside temperature ITI Average Bedroom Temperature ETI Average Bedroom Temperature
shifting time zones therefore allows for building cooling to gain momentum, the positive effects of which are visible in the reduced HEI.
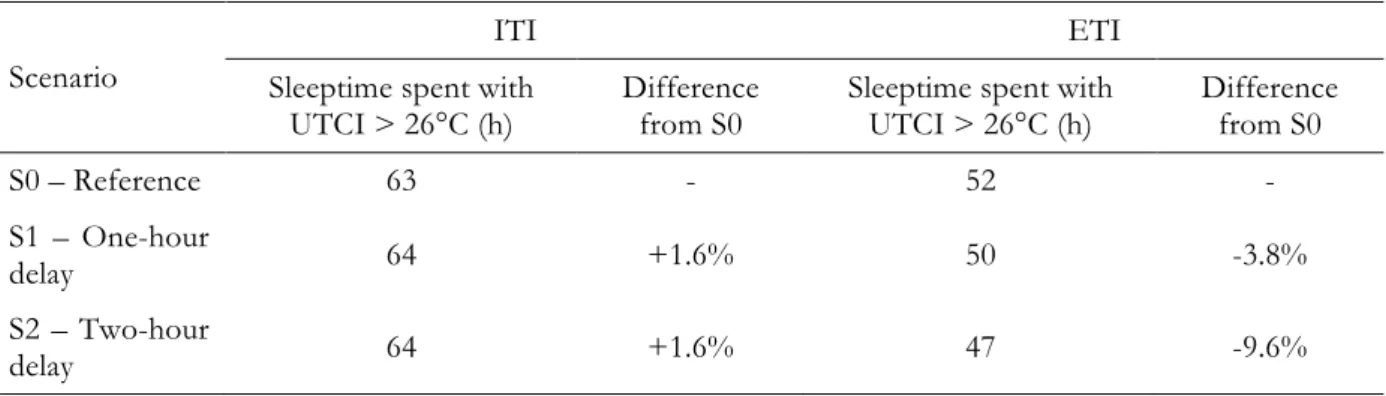
We now consider the length of time during which UTCI is above 26°C. Results are presented in Table 4. Table 4: Time spent with UTCI over 26°C from June 29th 11 pm to July 7th 10 pm
Scenario
ITI ETI
Sleeptime spent with
UTCI > 26°C (h) Difference from S0 Sleeptime spent with UTCI > 26°C (h) Difference from S0
S0 – Reference 63 - 52 -
S1 – One-hour
delay 64 +1.6% 50 -3.8%
S2 – Two-hour
delay 64 +1.6% 47 -9.6%
In the case of ITI, the time spent with UTCI above 26°C is practically unchanged over the study period, no matter what scenario is considered. Indeed, over the eight days considered, only one hour is changed when switching from S0 to S1 or S2, although this change is in fact an increase. In the case of ETI, the impact of changing scenarios is clearly visible, with the sleep time with a UTCI above 26°C reduced from 52 hours to 50 hours or 47 hours with scenarios S1 or S2, respectively. We conclude once more that delaying bedtime has positive impacts on occupant exposure to heat stress.
To our knowledge, no data cross analyzing indoor temperatures during sleeptime with heat-wave mortality or heath impacts are available that might support a more detailed analysis or quantitative estimate of the potential health benefits of the proposed scenarios. Nevertheless, we argue that it is reasonable to expect positive health effects from them, given the available literature on the links between high indoor temperatures and poor sleep quality and between high night time temperatures and heat-wave health impacts [13], [15], [17], [19], [37], [38]. The observed reduction of sleeptime heat stress also weighs in this direction.
Future epidemiological data cross analyzing bedroom temperatures with heat-wave health impacts could prove to be a very useful resource in this regard. Unfortunately, such a dataset would be costly and long to construct. However, as portable devices such as cellphones and wristwatches which can record an increasing amount of their wearer’s physiological data become more widespread, the construction of such a database may not be as far-fetched in the coming years. At that time, it will become possible to confirm the pertinence of our proposed heat exposure index as an indicator of heat-wave health effects as well as evaluate the potential of our proposed behavioral adaptation scenarios to limit them.
4 Conclusion
A behavioral adaptation approach for reducing the negative health impacts of heat-waves by shifting time zones and/or delaying bedtime by one (S1) to two hours (S2) was presented and discussed for two apartments in Paris, France. The conducted analyses were based on bedroom temperature and humidity measurements conducted during the summer of 2015. The proposed time zone or sleep schedule shifts were found to reduce exposure to sleeptime heat by up to 14%. Furthermore, the time spent by occupants in a state of moderate heat stress was reduced up to 10% for one of the apartments. Although precise health effects cannot be estimated in the absence of appropriate datasets combining indoor thermal environment measurements with health events during heat-waves, it seems reasonable to expect that reductions in exposure to intense heat will have positive repercussions on heat-wave health effects. As mentioned previously, scenarios S1 and S2 are equivalent to delaying sleep by one or two hours. Such behavioral adaptation already exists in Spain or Italy where it is known as la siesta. In addition to other positive health effects such as reduced coronary mortality, lower blood pressure and improved memory [39]–[41], our analysis suggests that positive health effects during heat-waves should also be expected. From a public health policy perspective, these results add to the literature arguing in favor of abandoning daylight savings time, at least for France [42]–[44]. From the perspective of heat-wave impacts, the
greatest improvements are to be expected from changing France’s summer time zone from CEST to GMT. Alternatively, health authorities in France could consider promoting one- or two-hour siestas in the early afternoon and delaying bedtime by the same duration as a part of their heat-wave management strategy, in particular for persons 65 years and older. A combination of both approaches would provide the same effect as scenario S2 while possibly being simpler to implement.
Our findings are generalizable to any country whose legal summer time is behind local solar time and is subject to heat-waves. Improvements will be greatest for the countries that are the furthest behind. Figure 4 provides a global view of the discrepancy between solar time and local legal time in the summer, adapted from Stefano Maggiolo [45]. Choosing a two-hour offset as a threshold (areas in strong red), we find that, in addition to France, all of Western Europe, Iceland and many other European countries stretching North to South from Finland to Greece appear to be likely candidates. In the rest of the world, this approach also identifies Western Algeria, Libya, Sudan and Namibia, most of North America, Argentina, Chile, Southeastern Brazil, and parts of Kazakhstan, Iran and Russia, Mongolia, Western China, the Maylasian peninsula, Southeastern Australia and New Zealand as well.
Figure 4: World Map of Solar Time vs. Daylight Savings Time (adapted from [45]). Areas in strong red are two hours or more behind local solar time and are likely to benefit similarly from a
change in (local) summer time zone.
To complete this brief analysis of countries where the local time zone may increase heat-related health risks, a map identifying probable increases in extreme heat events due to climate change should also be used.
5 Acknowledgements
The authors would like to acknowledge the contribution of the attendees of the Fourth International Conference on Countermeasures to Urban Heat Islands (IC2UHI) held in Singapore from May 30th to
June 1st, 2016 as well as that of the reviewers to improve the quality of this article.
6 References
[1] IPCC, “Climate Change 2013: The Physical Science Basis. Summary for Policymakers,” Ipcc, pp. 1– 29, 2013.
[2] A. Lemonsu, R. Kounkou-Arnaud, J. Desplat, J. L. Salagnac, and V. Masson, “Evolution of the Parisian urban climate under a global changing climate,” Clim. Change, vol. 116, no. 3–4, pp. 679–
692, Jul. 2013.
[3] J.-M. Robine, S. L. K. Cheung, S. Le Roy, H. Van Oyen, C. Griffiths, J.-P. Michel, and F. R. Herrmann, “Death toll exceeded 70,000 in Europe during the summer of 2003.,” C. R. Biol., vol. 331, no. 2, pp. 171–178, Feb. 2008.
[4] D. Li and E. Bou-Zeid, “Synergistic Interactions between Urban Heat Islands and Heat Waves: The Impact in Cities Is Larger than the Sum of Its Parts,” J. Appl. Meteorol. Climatol., vol. 52, no. 9, pp. 2051–2064, Sep. 2013.
[5] H. Akbari and H. Taha, “The impact of trees and white surfaces on residential heating and cooling energy use in four Canadian cities,” Energy, vol. 17, no. 2, pp. 141–149, Feb. 1992.
[6] P. Rosado, H. Gilbert, M. Pomerantz, B. Mandel, and R. Levinson, “Cool Pavement Demonstration and Study,” in Third International Conference on Countermeasures to Urban Heat Island, 2014, pp. 815–826.
[7] E. Erell, D. Pearlmutter, D. Boneh, and P. B. Kutiel, “Effect of high-albedo materials on pedestrian heat stress in urban street canyons,” Urban Clim., Oct. 2013.
[8] M. Santamouris, “Using cool pavements as a mitigation strategy to fight urban heat island—A review of the actual developments,” Renew. Sustain. Energy Rev., vol. 26, pp. 224–240, Oct. 2013. [9] M. Santamouris, A. Synnefa, and T. Karlessi, “Using advanced cool materials in the urban built
environment to mitigate heat islands and improve thermal comfort conditions,” Sol. Energy, vol. 85, no. 12, pp. 3085–3102, 2011.
[10] H. Akbari, M. Pomerantz, and H. Taha, “Cool surfaces and shade trees to reduce energy use and improve air quality in urban areas,” Sol. Energy, vol. 70, no. 3, pp. 295–310, Jan. 2001.
[11] M. Musy, L. Malys, B. Morille, A. Szucs, C. Inard, E. Bozonnet, R. Djedjig, R. Belarbi, A. Lemonsu, C. de Munck, and K. Chancibault, “Impact of vegetation on urban climate , thermal comfort and building energy consumption – Overview of VegDUD project results,” in Third
International Conference on Countermeasures to Urban Heat Island, 2014, pp. 719–730.
[12] E. Jauregui, “Influence of a large urban park on temperature and convective precipitation in a tropical city,” Energy Build., vol. 15, no. 3–4, pp. 457–463, Jan. 1990.
[13] O. Buchin, M.-T. Hoelscher, F. Meier, T. Nehls, and F. Ziegler, “Evaluation of the health-risk reduction potential of countermeasures to urban heat islands,” Energy Build., Jun. 2015.
[14] C. Schweizer, R. D. Edwards, L. Bayer-Oglesby, W. J. Gauderman, V. Ilacqua, M. Juhani Jantunen, H. K. Lai, M. Nieuwenhuijsen, and N. Künzli, “Indoor time–microenvironment–activity patterns in seven regions of Europe,” J. Expo. Sci. Environ. Epidemiol., vol. 17, no. 2, pp. 170–181, 2006. [15] M. Pascal, K. Laaidi, M. Ledrans, E. Baffert, C. Caserio-Schönemann, A. Le Tertre, J. Manach, S.
Medina, J. Rudant, and P. Empereur-Bissonnet, “France’s heat health watch warning system,” Int.
J. Biometeorol., vol. 50, no. 3, pp. 144–153, 2006.
[16] J. Díaz, R. García, F. Velázquez de Castro, E. Hernández, C. López, and A. Otero, “Effects of extremely hot days on people older than 65 years in Seville (Spain) from 1986 to 1997.,” Int. J.
Biometeorol., vol. 46, no. 3, pp. 145–9, 2002.
[17] P. Höppe, “Improving indoor thermal comfort by changing outdoor conditions,” Energy Build., vol. 16, no. 1–2, pp. 743–747, 1991.
[18] J. Díaz, A. Jordán, R. García, C. López, J. C. Alberdi, E. Hernández, and A. Otero, “Heat waves in Madrid 1986-1997: Effects on the health of the elderly,” Int. Arch. Occup. Environ. Health, vol. 75, no. 3, pp. 163–170, 2002.
[19] M. Gradisar, L. Lack, H. Wright, J. Harris, and A. Brooks, “Do chronic primary insomniacs have impaired heat loss when attempting sleep?,” Am. J. Physiol. Regul. Integr. Comp. Physiol., vol. 290, no. 4, pp. R1115–R1121, 2006.
[20] A. Gasparrini, Y. Guo, M. Hashizume, E. Lavigne, A. Zanobetti, J. Schwartz, A. Tobias, S. Tong, J. Rocklöv, B. Forsberg, M. Leone, M. De Sario, M. L. Bell, Y. L. L. Guo, C. F. Wu, H. Kan, S. M. Yi, M. De Sousa Zanotti Stagliorio Coelho, P. H. N. Saldiva, Y. Honda, H. Kim, and B. Armstrong, “Mortality risk attributable to high and low ambient temperature: A multicountry observational study,” Lancet, vol. 386, no. 9991, pp. 369–375, 2015.
[21] M. Anderson, C. Carmichael, V. Murray, A. Dengel, and M. Swainson, “Defining indoor heat thresholds for health in the UK,” Perspect. Public Health, vol. 133, no. 3, pp. 158–164, May 2013. [22] A. Quinn, J. D. Tamerius, M. Perzanowski, J. S. Jacobson, I. Goldstein, L. Acosta, and J. Shaman,
“Predicting indoor heat exposure risk during extreme heat events,” Sci. Total Environ., vol. 490, pp. 686–693, 2014.
[23] World Meteorological Organization and World Health Organization, Heatwaves and Health: Guidance
on Warning-System Development, no. 1142. 2015.
[24] J. D. Spengler, “Climate change, indoor environments, and health,” Indoor Air, vol. 22, no. 2, pp. 89–95, 2012.
[25] World Health Organization, “Health impact of low indoor temperatures. Report on a WHO meeting.” p. 27, 1987.
[26] N. Willand, I. Ridley, and A. Pears, “Relationship of thermal performance rating, summer indoor temperatures and cooling energy use in 107 homes in Melbourne, Australia,” Energy Build., vol. 113, pp. 159–168, 2016.
[27] J.-M. Ayrault, C. Duflot, and D. Batho, French Thermal Regulation for Buildings. (in French), 2012. [28] A. Lemonsu, V. Viguié, M. Daniel, and V. Masson, “Vulnerability to heat waves_Impact of urban
expansion scenarios on urban heat island and heat stress in Paris,” Urban Clim., vol. 14, pp. 586– 605, 2015.
[29] D. Fröhlich and A. Matzarakis, “Human-biometeorological estimation of adaptation- and mitigation potential of urban green in Southwest Germany,” in Third International Conference on
Countermeasures to Urban Heat Island, 2014, pp. 351–362.
[30] P. Bröde, D. Fiala, K. Błażejczyk, I. Holmér, G. Jendritzky, B. Kampmann, B. Tinz, and G. Havenith, “Deriving the operational procedure for the Universal Thermal Climate Index (UTCI).,”
Int. J. Biometeorol., vol. 56, no. 3, pp. 481–94, May 2012.
[31] K. Blazejczyk, P. Bröde, D. Fiala, G. Havenith, I. Holmér, G. Jendritzky, B. Kampmann, and A. Kunert, “Principles of the new Universal Thermal Climate Index (UTCI) and its Application to Bioclimatic Research in European Scale,” Misc. Geogr., vol. 14, pp. 91–102, 2010.
[32] B. Lin, X. Li, Y. Zhu, and Y. Qin, “Numerical simulation studies of the different vegetation patterns’ effects on outdoor pedestrian thermal comfort,” J. Wind Eng. Ind. Aerodyn., vol. 96, no. 10–11, pp. 1707–1718, Oct. 2008.
[33] Z. Lin and S. Deng, “A study on the thermal comfort in sleeping environments in the subtropics-Developing a thermal comfort model for sleeping environments,” Build. Environ., vol. 43, no. 1, pp. 70–81, 2008.
[34] Naive cynic at English Wikipedia, “Difference between legal time and local mean time in Europe during the summer.,” 2006. [Online]. Available: https://commons.wikimedia.org/wiki/File:Tzdiff-Europe-summer.png. [Accessed: 01-Aug-2016].
[35] K. Azos-Diaz, B. Tremeac, F. Simon, D. Corgier, and C. Marvillet, “How Heat Waves Influence Indoor Temperature During Summer in Old Renovated Parisian Buildings,” in 24th IIR
International Congress of Refrigeration, 2015.
[36] M. Hendel, P. Gutierrez, M. Colombert, Y. Diab, and L. Royon, “Measuring the effects of urban heat island mitigation techniques in the field: Application to the case of pavement-watering in Paris,” Urban Clim., vol. 16, pp. 43–58, Jun. 2016.
[37] J. F. Clarke and W. Bach, “Comparison of the comfort conditions in different urban and suburban microenvironments,” Int. J. Biometeorol., vol. 15, no. 1, pp. 41–54, 1971.
[38] Y. Shimoda, “Adaptation measures for climate change and the urban heat island in Japan’s built environment,” Build. Res. Inf., vol. 31, no. 3–4, pp. 222–230, Jan. 2003.
[39] A. Naska, E. Oikonomou, A. Trichopoulou, T. Psaltopoulou, and D. Trichopoulos, “Siesta in Healthy Adults and Coronary Mortality in the General Population,” Arch. Intern. Med., vol. 167, no. 3, p. 296, Feb. 2007.
[40] R. C. Brindle and S. M. Conklin, “Daytime Sleep Accelerates Cardiovascular Recovery after Psychological Stress,” Int. J. Behav. Med., vol. 19, no. 1, pp. 111–114, Mar. 2012.
[41] S. C. Mednick, D. J. Cai, J. Kanady, and S. P. A. Drummond, “Comparing the benefits of caffeine, naps and placebo on verbal, motor and perceptual memory,” Behav. Brain Res., vol. 193, no. 1, pp. 79–86, Nov. 2008.
[42] S. Coren, “Daylight Savings Time and Traffic Accidents,” N. Engl. J. Med., vol. 334, no. 14, pp. 924–925, Apr. 1996.
[43] J. Varughese and R. Allen, “Fatal accidents following changes in daylight savings time: the American experience.,” Sleep Med., vol. 2, no. 1, pp. 31–36, 2001.
[44] M. R. Jiddou, M. Pica, J. Boura, L. Qu, and B. a Franklin, “Incidence of myocardial infarction with shifts to and from daylight savings time.,” Am. J. Cardiol., vol. 111, no. 5, pp. 631–5, 2013.
[45] S. Maggiolo, “Solar Time Vs Standard Time,” 2015. [Online]. Available: https://en.wikipedia.org/wiki/File:Solar_time_vs_standard_time.png. [Accessed: 01-Aug-2016].
![Table 2: Instrument Characteristics [35]](https://thumb-eu.123doks.com/thumbv2/123doknet/15014792.680602/6.892.204.690.629.756/table-instrument-characteristics.webp)
![Figure 4: World Map of Solar Time vs. Daylight Savings Time (adapted from [45]). Areas in strong red are two hours or more behind local solar time and are likely to benefit similarly from a](https://thumb-eu.123doks.com/thumbv2/123doknet/15014792.680602/9.892.118.780.397.784/figure-world-solar-daylight-savings-adapted-benefit-similarly.webp)